Sort算子落盘性能太慢,希望产品层面进行优化

【需求涉及的问题场景】
在测试传统数据库与TiDB数据库性能过程中,关于排序方面,只要涉及到落盘,tidb性能都会有较大折扣。

这里找开源数据库postgresql(下称为:pg)作为测试案例只针对sort算子进行性能对比,对比方式为:
1、全部单线程内存排序,观察效率。
2、全部单线程溢出磁盘排序,观察效率。
3、pg多线程溢出磁盘排序,观察效率。(pg内存排序方式为quicksort不支持并行,溢出磁盘为外部排序支持并行)
其它情况说明:tidb不支持sort并行,因此只测试单线程。

表结构和数据量如下:

mysql> show create table customer \G
*************************** 1. row ***************************
       Table: customer
Create Table: CREATE TABLE `customer` (
  `C_CUSTKEY` bigint(20) NOT NULL,
  `C_NAME` varchar(25) NOT NULL,
  `C_ADDRESS` varchar(40) NOT NULL,
  `C_NATIONKEY` bigint(20) NOT NULL,
  `C_PHONE` char(15) NOT NULL,
  `C_ACCTBAL` decimal(15,2) NOT NULL,
  `C_MKTSEGMENT` char(10) NOT NULL,
  `C_COMMENT` varchar(117) NOT NULL,
  PRIMARY KEY (`C_CUSTKEY`) /*T![clustered_index] CLUSTERED */,
  KEY `customer_idx1` (`C_PHONE`),
  KEY `customer_idx2` (`C_NATIONKEY`)
) ENGINE=InnoDB DEFAULT CHARSET=utf8mb4 COLLATE=utf8mb4_bin
1 row in set (0.00 sec)

mysql> select count(*) from customer;
+----------+
| count(*) |
+----------+
|  1500000 |
+----------+
1 row in set (0.56 sec)

1、全部单线程内存排序,观察效率。
tidb:
#设置语句内存大小为1GB,表扫描并行度为1;

set tidb_distsql_scan_concurrency=1;
set tidb_mem_quota_query=1073741824;

mysql> explain analyze select * from customer order by C_COMMENT desc, C_ACCTBAL asc;
+-------------------------+------------+---------+-----------+----------------+------------------------------------------------------------------------------------------------------------------------------------------------------------------------------------------------------------------------------------------------------------------------------------------------------+-------------------------------------------------------+----------+---------+
| id                      | estRows    | actRows | task      | access object  | execution info                                                                                                                                                                                                                                                                                       | operator info                                         | memory   | disk    |
+-------------------------+------------+---------+-----------+----------------+------------------------------------------------------------------------------------------------------------------------------------------------------------------------------------------------------------------------------------------------------------------------------------------------------+-------------------------------------------------------+----------+---------+
| Sort_4                  | 1500000.00 | 1500000 | root      |                | time:7.26s, loops:1466                                                                                                                                                                                                                                                                               | tpch.customer.c_comment:desc, tpch.customer.c_acctbal | 351.5 MB | 0 Bytes |
| └─TableReader_8         | 1500000.00 | 1500000 | root      |                | time:1.86s, loops:1471, cop_task: {num: 8, max: 445.5ms, min: 67.7ms, avg: 231.2ms, p95: 445.5ms, max_proc_keys: 297022, p95_proc_keys: 297022, tot_proc: 1.32s, tot_wait: 2ms, rpc_num: 8, rpc_time: 1.85s, copr_cache: disabled, distsql_concurrency: 1}                                           | data:TableFullScan_7                                  | 128.9 MB | N/A     |
|   └─TableFullScan_7     | 1500000.00 | 1500000 | cop[tikv] | table:customer | tikv_task:{proc max:173ms, min:34ms, avg: 110.3ms, p80:172ms, p95:173ms, iters:1502, tasks:8}, scan_detail: {total_process_keys: 1500000, total_process_keys_size: 305225771, total_keys: 1500008, get_snapshot_time: 6.43ms, rocksdb: {key_skipped_count: 1500000, block: {cache_hit_count: 5035}}} | keep order:false                                      | N/A      | N/A     |
+-------------------------+------------+---------+-----------+----------------+------------------------------------------------------------------------------------------------------------------------------------------------------------------------------------------------------------------------------------------------------------------------------------------------------+-------------------------------------------------------+----------+---------+
3 rows in set (7.27 sec)

可以看到copTask在tikv-client缓存大小为128MB,排序全部在内存中进行,使用了351MB,语句总内存使用大小约为500MB。

在pg中测试情况如下:

tpch=# explain analyze select * from customer order by C_COMMENT desc, C_ACCTBAL asc;
                                                         QUERY PLAN                                                         
----------------------------------------------------------------------------------------------------------------------------
 Sort  (cost=206554.90..210304.40 rows=1499799 width=167) (actual time=12918.633..13180.047 rows=1500000 loops=1)
   Sort Key: c_comment DESC, c_acctbal
   Sort Method: quicksort  Memory: 439757kB
   ->  Seq Scan on customer  (cost=0.00..52702.99 rows=1499799 width=167) (actual time=0.005..111.692 rows=1500000 loops=1)
 Planning Time: 0.065 ms
 Execution Time: 13237.138 ms
(6 rows)

Time: 13237.643 ms (00:13.238)

可以看到在快排方面,tidb性能要明显好于pg。
(数据加载均只需1.x秒,这里暂时忽略数据读取耗时)
pg需要13秒,430MB内存。tidb只需要7.3秒350MB内存。

2、全部单线程溢出磁盘排序,观察效率。
根据上面测试可以看到copTask在tikv-client缓存大小为128MB,排序全部在内存中进行,使用了351MB,语句总内存使用大小约为500MB。让其进行落盘,内存修改为200MB:

set tidb_distsql_scan_concurrency=1;
set tidb_mem_quota_query=209715200;
mysql> explain analyze select * from customer order by C_COMMENT desc, C_ACCTBAL asc;
+-------------------------+------------+---------+-----------+----------------+------------------------------------------------------------------------------------------------------------------------------------------------------------------------------------------------------------------------------------------------------------------------------------------------------+-------------------------------------------------------+----------+----------+
| id                      | estRows    | actRows | task      | access object  | execution info                                                                                                                                                                                                                                                                                       | operator info                                         | memory   | disk     |
+-------------------------+------------+---------+-----------+----------------+------------------------------------------------------------------------------------------------------------------------------------------------------------------------------------------------------------------------------------------------------------------------------------------------------+-------------------------------------------------------+----------+----------+
| Sort_4                  | 1500000.00 | 1500000 | root      |                | time:39.3s, loops:1466                                                                                                                                                                                                                                                                               | tpch.customer.c_comment:desc, tpch.customer.c_acctbal | 144.9 MB | 284.2 MB |
| └─TableReader_8         | 1500000.00 | 1500000 | root      |                | time:1.94s, loops:1471, cop_task: {num: 8, max: 470.8ms, min: 70.3ms, avg: 241.2ms, p95: 470.8ms, max_proc_keys: 297022, p95_proc_keys: 297022, tot_proc: 1.38s, tot_wait: 4ms, rpc_num: 8, rpc_time: 1.93s, copr_cache: disabled, distsql_concurrency: 1}                                           | data:TableFullScan_7                                  | 128.9 MB | N/A      |
|   └─TableFullScan_7     | 1500000.00 | 1500000 | cop[tikv] | table:customer | tikv_task:{proc max:186ms, min:34ms, avg: 112.4ms, p80:174ms, p95:186ms, iters:1502, tasks:8}, scan_detail: {total_process_keys: 1500000, total_process_keys_size: 305225771, total_keys: 1500008, get_snapshot_time: 7.08ms, rocksdb: {key_skipped_count: 1500000, block: {cache_hit_count: 5035}}} | keep order:false                                      | N/A      | N/A      |
+-------------------------+------------+---------+-----------+----------------+------------------------------------------------------------------------------------------------------------------------------------------------------------------------------------------------------------------------------------------------------------------------------------------------------+-------------------------------------------------------+----------+----------+
3 rows in set (39.30 sec)

可以看到外部排序需要花费39.3秒。
在pg中测试情况如下:
关闭pg并行,设置排序区内存大小为50MB(小于tidb排序使用内存):

tpch=# set work_mem=51200;
tpch=# set max_parallel_workers_per_gather=1;
SET
Time: 0.397 ms
tpch=# explain analyze select * from customer order by C_COMMENT desc, C_ACCTBAL asc;
                                                               QUERY PLAN                                                               
----------------------------------------------------------------------------------------------------------------------------------------
 Gather Merge  (cost=207024.61..308481.63 rows=882235 width=167) (actual time=4737.983..7385.264 rows=1500000 loops=1)
   Workers Planned: 1
   Workers Launched: 1
   ->  Sort  (cost=206024.60..208230.19 rows=882235 width=167) (actual time=4507.940..5643.202 rows=750000 loops=2)
         Sort Key: c_comment DESC, c_acctbal
         Sort Method: external merge  Disk: 143792kB
         Worker 0:  Sort Method: external merge  Disk: 123336kB
         ->  Parallel Seq Scan on customer  (cost=0.00..46527.35 rows=882235 width=167) (actual time=0.008..61.661 rows=750000 loops=2)
 Planning Time: 0.066 ms
 Execution Time: 7468.150 ms
(10 rows)

可以看到pg外部排序需要7.4秒,比全内存的快排要快接近1倍。
可以看到在溢出到磁盘的外部排序放,pg性能要明显好于tidb。
pg需要7.5秒,tidb需要39.3秒。
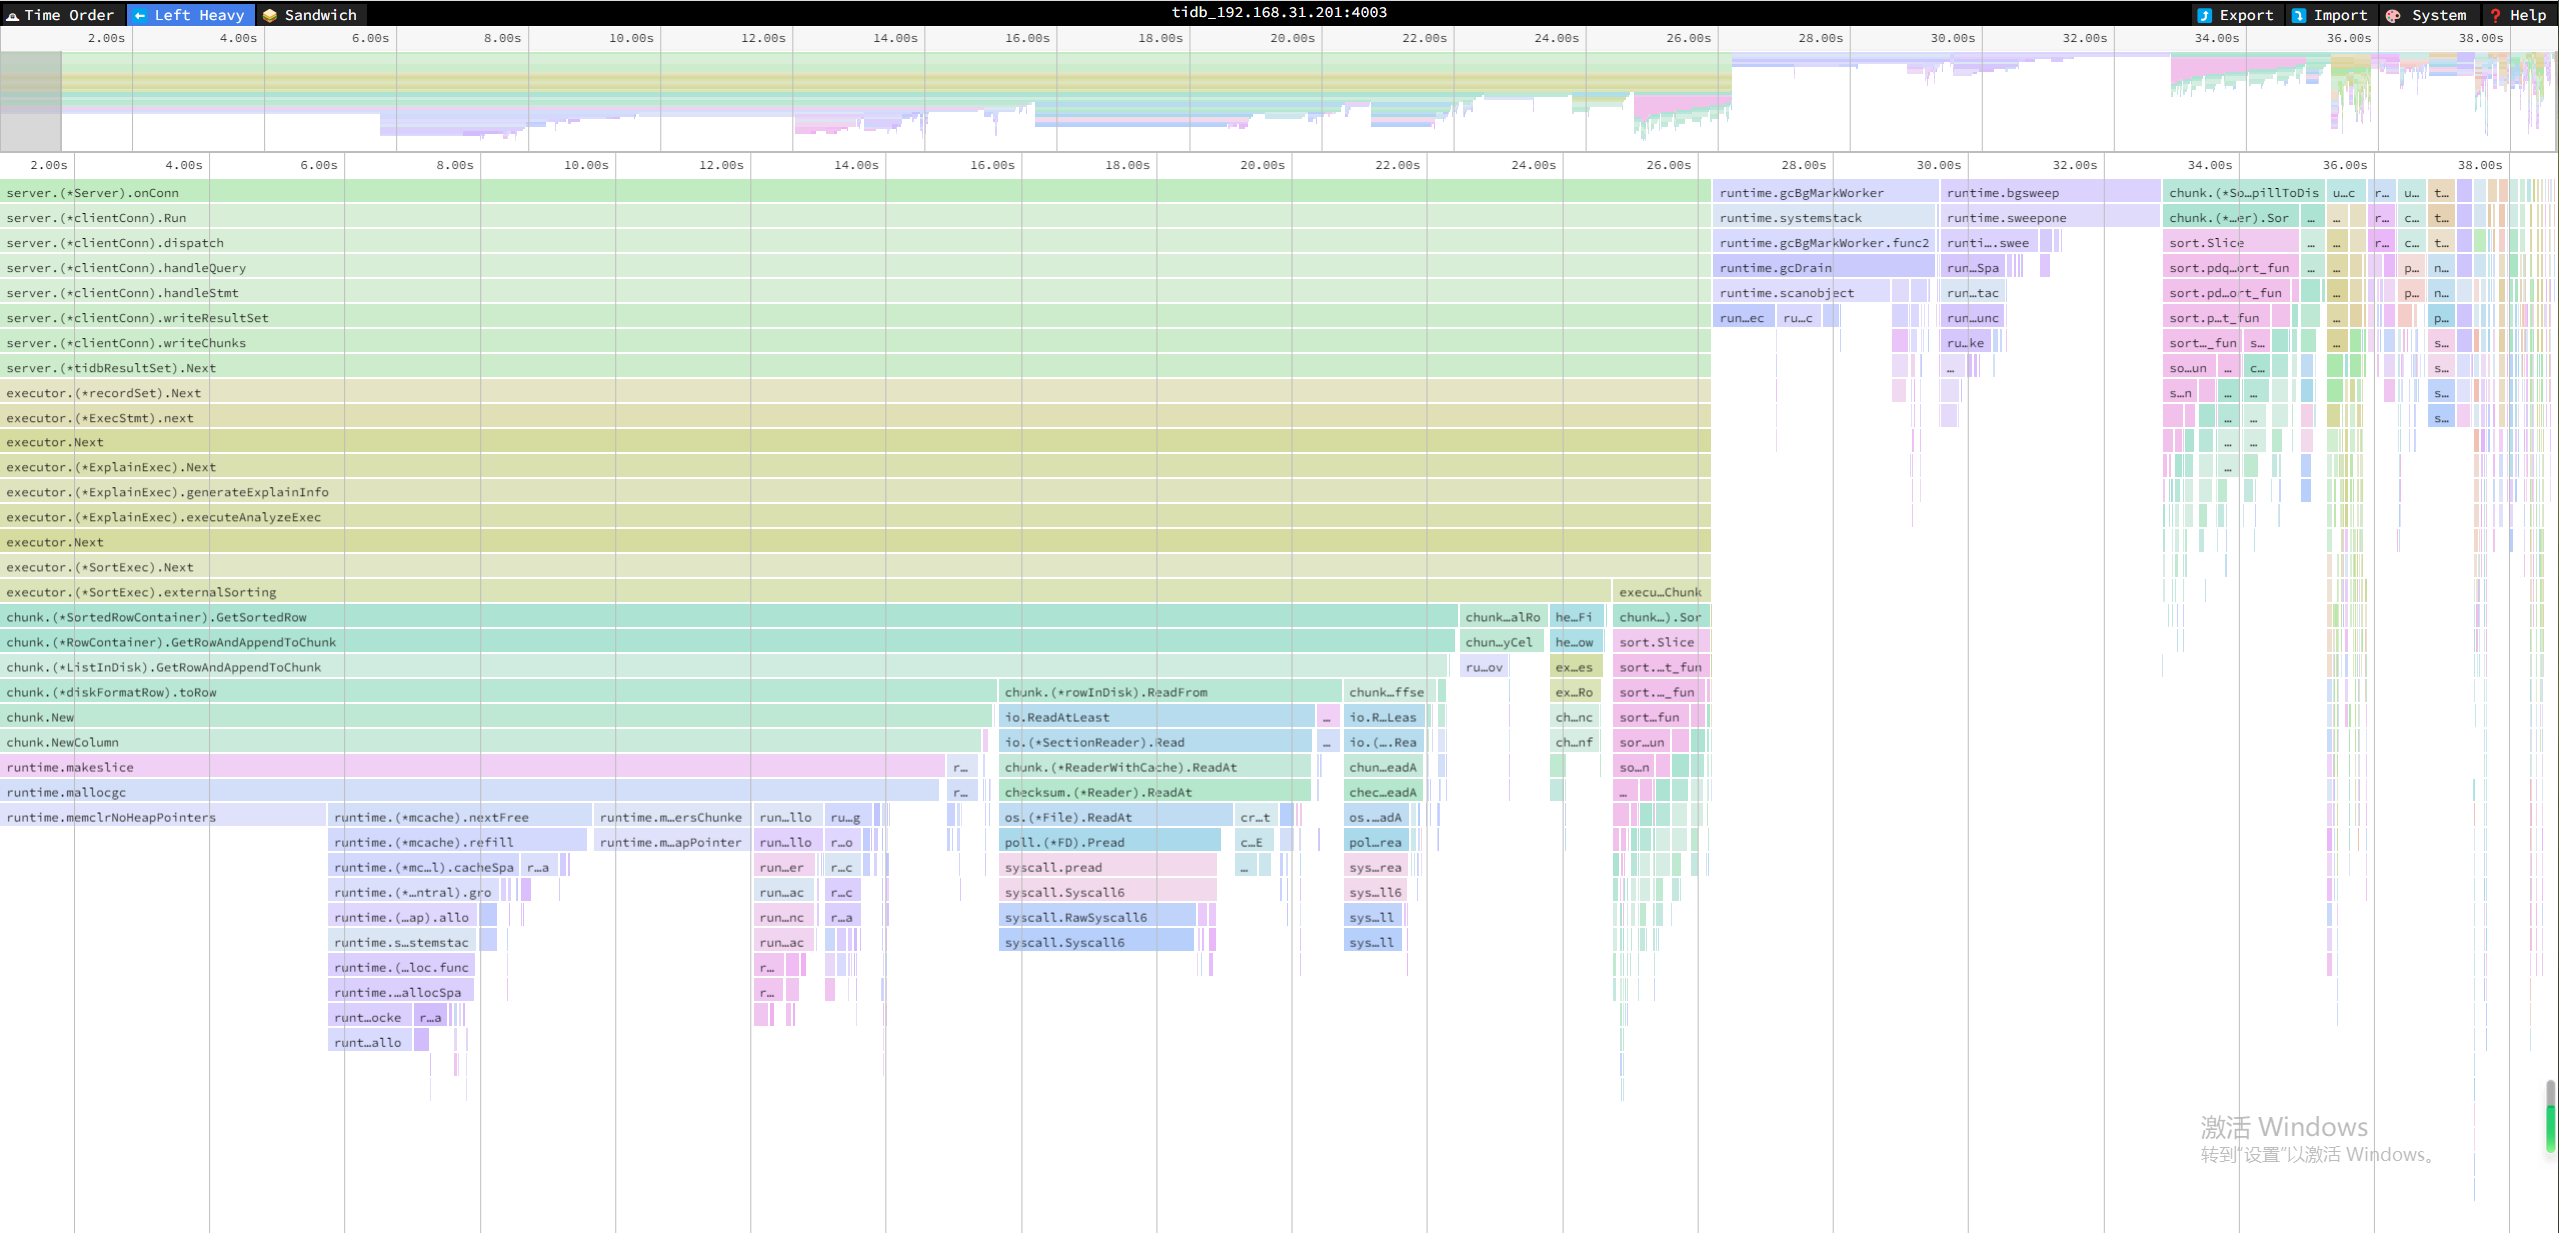
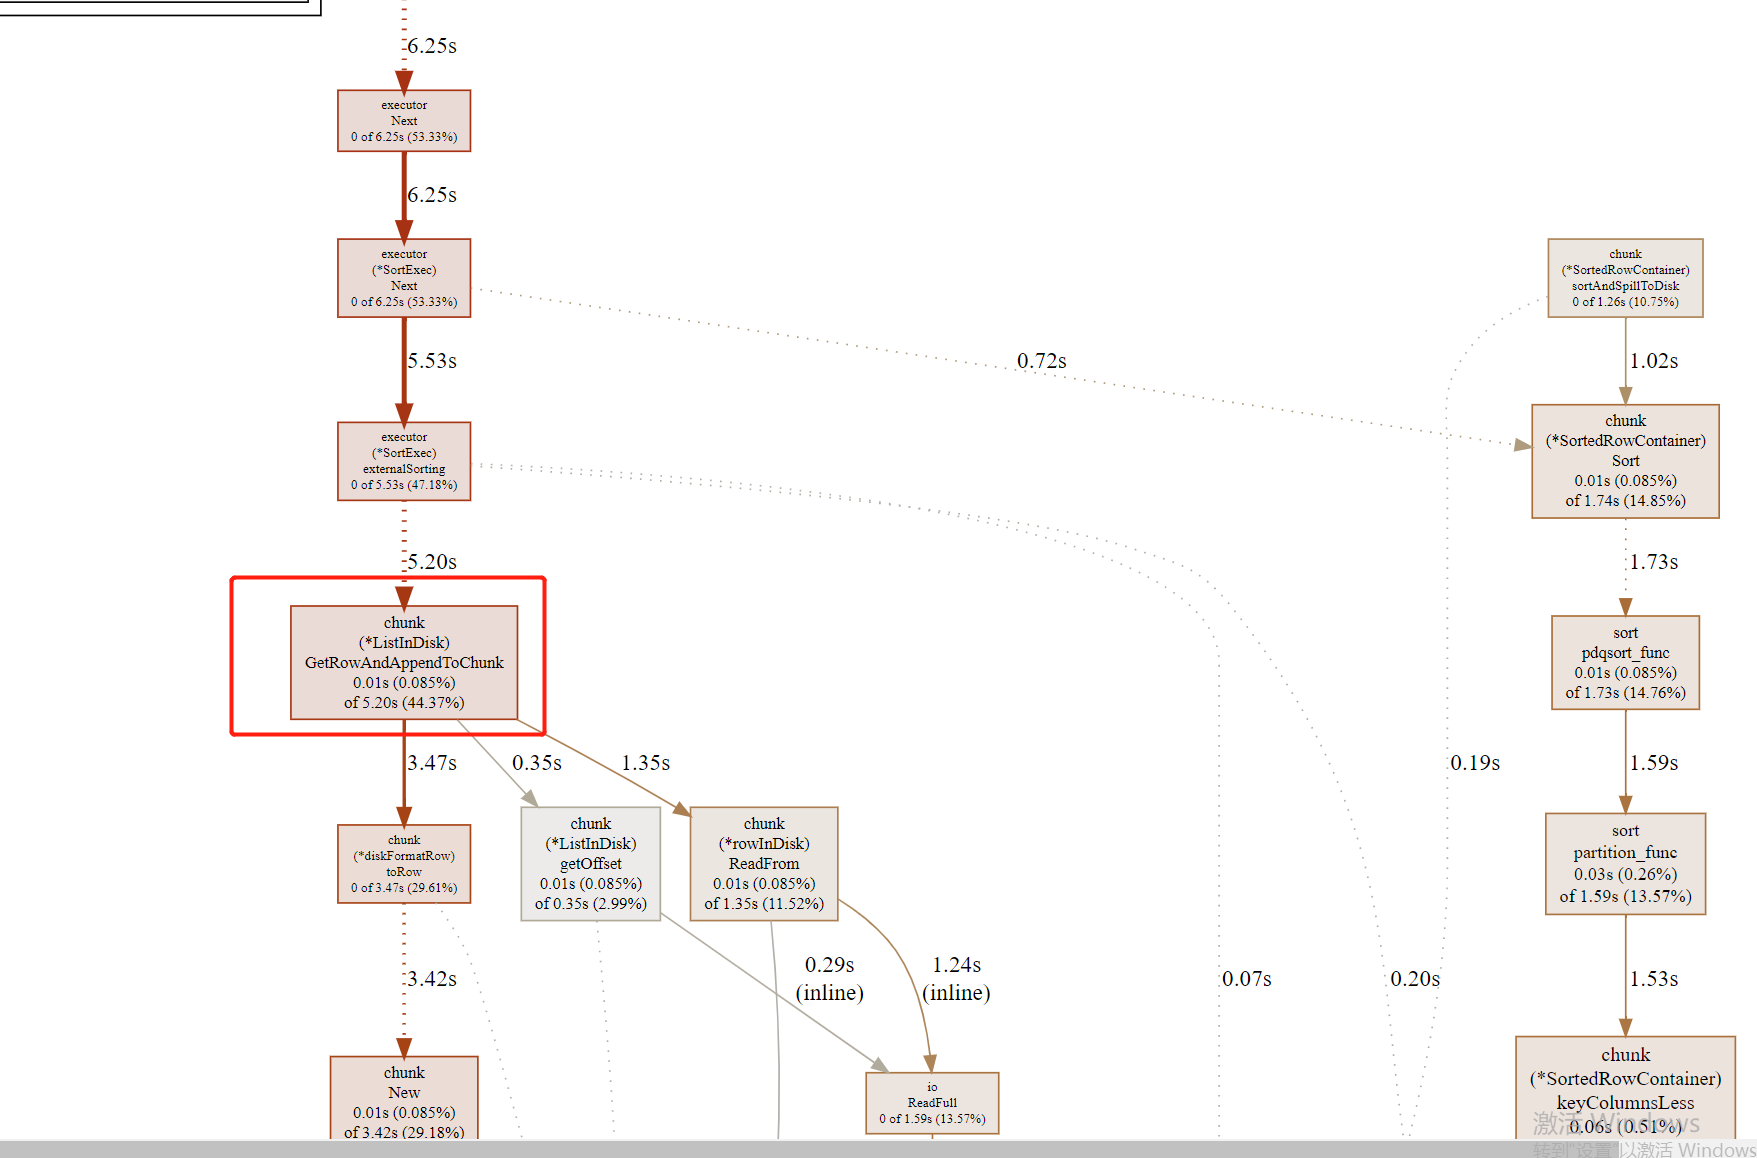
tidb主要耗时都是花在磁盘等待相关处理上:

3、pg多线程溢出磁盘排序,观察效率

#开启并行:
set max_parallel_workers_per_gather=4;
#将sort工作区设置为50MB。(比tidb的sort算子可用内存小)
set work_mem=51200;

tpch=# explain analyze select * from customer order by C_COMMENT desc, C_ACCTBAL asc;
                                                               QUERY PLAN                                                               
----------------------------------------------------------------------------------------------------------------------------------------
 Gather Merge  (cost=107926.06..287503.96 rows=1499799 width=167) (actual time=2829.578..6503.408 rows=1500000 loops=1)
   Workers Planned: 4
   Workers Launched: 4
   ->  Sort  (cost=106926.00..107863.38 rows=374950 width=167) (actual time=2618.420..2836.848 rows=300000 loops=5)
         Sort Key: c_comment DESC, c_acctbal
         Sort Method: external merge  Disk: 62128kB
         Worker 0:  Sort Method: external merge  Disk: 79400kB
         Worker 1:  Sort Method: external merge  Disk: 31752kB
         Worker 2:  Sort Method: external merge  Disk: 62128kB
         Worker 3:  Sort Method: external merge  Disk: 31744kB
         ->  Parallel Seq Scan on customer  (cost=0.00..41454.50 rows=374950 width=167) (actual time=0.010..57.328 rows=300000 loops=5)
 Planning Time: 0.148 ms
 Execution Time: 6571.564 ms
(13 rows)

可以看到在并行方面pg的外部排序并没有太大性能提升(但是通过观察CPU多了几倍的消耗)。
总体结论:tidb的外部排序比pg要慢几倍。
因此希望tidb的外部排序可以进一步优化,比如将溢出磁盘的行为作为异步的方式,来减少非排序时间的消耗,进而增加整体排序效率。

3 个赞

这个最大的耗时应该在从磁盘拿数据的时候是一次IO是一行中的一个column获取数据导致的性能瓶颈,如果一次获取是一个chunk,效率上应该会好很多。

// GetRowAndAppendToChunk gets a Row from the ListInDisk by RowPtr. Return the Row and the Ref Chunk.
func (l *ListInDisk) GetRowAndAppendToChunk(ptr RowPtr, chk *Chunk) (row Row, _ *Chunk, err error) {
	off, err := l.getOffset(ptr.ChkIdx, ptr.RowIdx)
	if err != nil {
		return
	}
	r := l.dataFile.getSectionReader(off)
	format := rowInDisk{numCol: len(l.fieldTypes)}
	_, err = format.ReadFrom(r)
	if err != nil {
		return row, nil, err
	}
	row, chk = format.toRow(l.fieldTypes, chk)
	return row, chk, err
}

// ReadFrom reads data of r, deserializes it from the format of diskFormatRow
// into Row.
func (row *rowInDisk) ReadFrom(r io.Reader) (n int64, err error) {
	b := make([]byte, 8*row.numCol)
	var n1 int
	n1, err = io.ReadFull(r, b)
	n += int64(n1)
	if err != nil {
		return
	}
	row.sizesOfColumns = bytesToI64Slice(b)
	row.cells = make([][]byte, 0, row.numCol)
	for _, size := range row.sizesOfColumns {
		if size == -1 {
			continue
		}
		cell := make([]byte, size)
		row.cells = append(row.cells, cell)
		n1, err = io.ReadFull(r, cell)
		n += int64(n1)
		if err != nil {
			return
		}
	}
	return
}
2 个赞

:call_me_hand::call_me_hand::call_me_hand::call_me_hand::call_me_hand::call_me_hand:

:call_me_hand::call_me_hand::call_me_hand::call_me_hand::call_me_hand::call_me_hand::call_me_hand::call_me_hand::call_me_hand::call_me_hand::call_me_hand:

牛 牛 牛

这里的分析是错误的,因为rowInDisk.ReadFrom这里虽然每次一个column,但是下面tidb还是做了一层缓存的(ReaderWithCahe),因此并不是因为这里分析的IO太小导致,问题应该出在更底层机制上(的IO问题)。

太牛了,受教

大佬们别夸了,我这不是分享,只是功能增强需求。

看官方文档已经对落盘的读取进行了优化:https://docs.pingcap.com/zh/tidb/stable/release-7.1.1#:~:text=优化与落盘相关的%20chunk%20读取的性能

对应的ISSUE:Implement a fast row container reader to dump rows from disk · Issue #45125 · pingcap/tidb · GitHub

可是相同的数据量在7.1.1版本中执行发现落盘后,效率还是很低下。


mysql> set tidb_distsql_scan_concurrency=1;
Query OK, 0 rows affected (0.00 sec)

mysql> set tidb_mem_quota_query=209715200;
Query OK, 0 rows affected (0.00 sec)

mysql> explain analyze select * from customer order by C_COMMENT desc, C_ACCTBAL asc;
+-------------------------+------------+---------+-----------+----------------+-------------------------------------------------------------------------------------------------------------------------------------------------------------------------------------------------------------------------------------------------------------------------------------------------------------------------------+-----------------------------------------------------------+----------+----------+
| id                      | estRows    | actRows | task      | access object  | execution info                                                                                                                                                                                                                                                                                                                | operator info                                             | memory   | disk     |
+-------------------------+------------+---------+-----------+----------------+-------------------------------------------------------------------------------------------------------------------------------------------------------------------------------------------------------------------------------------------------------------------------------------------------------------------------------+-----------------------------------------------------------+----------+----------+
| Sort_4                  | 1500000.00 | 1500000 | root      |                | time:34.6s, loops:1466, RU:5061.368437                                                                                                                                                                                                                                                                                        | tpch10.customer.c_comment:desc, tpch10.customer.c_acctbal | 189.3 MB | 204.9 MB |
| └─TableReader_8         | 1500000.00 | 1500000 | root      |                | time:1.52s, loops:1468, cop_task: {num: 54, max: 74.9ms, min: 817µs, avg: 29.1ms, p95: 63.2ms, max_proc_keys: 50144, p95_proc_keys: 50144, tot_proc: 1.17s, tot_wait: 8.07ms, rpc_num: 54, rpc_time: 1.57s, copr_cache_hit_ratio: 0.00, build_task_duration: 13.6µs, max_distsql_concurrency: 1}                              | data:TableFullScan_7                                      | 22.5 MB  | N/A      |
|   └─TableFullScan_7     | 1500000.00 | 1500000 | cop[tikv] | table:customer | tikv_task:{proc max:39ms, min:0s, avg: 13.1ms, p80:23ms, p95:32ms, iters:1678, tasks:54}, scan_detail: {total_process_keys: 1500000, total_process_keys_size: 305225771, total_keys: 1500054, get_snapshot_time: 1.24ms, rocksdb: {delete_skipped_count: 217344, key_skipped_count: 1717344, block: {cache_hit_count: 7743}}} | keep order:false                                          | N/A      | N/A      |
+-------------------------+------------+---------+-----------+----------------+-------------------------------------------------------------------------------------------------------------------------------------------------------------------------------------------------------------------------------------------------------------------------------------------------------------------------------+-----------------------------------------------------------+----------+----------+
3 rows in set (34.58 sec)

mysql> select version();
+--------------------+
| version()          |
+--------------------+
| 5.7.25-TiDB-v7.1.1 |
+--------------------+
1 row in set (0.00 sec)

看pprof像是GC的问题:

(pprof) top
Showing nodes accounting for 5780ms, 60.97% of 9480ms total
Dropped 256 nodes (cum <= 47.40ms)
Showing top 10 nodes out of 141
      flat  flat%   sum%        cum   cum%
    2400ms 25.32% 25.32%     2400ms 25.32%  runtime.memclrNoHeapPointers
    1210ms 12.76% 38.08%     1210ms 12.76%  runtime/internal/syscall.Syscall6
     490ms  5.17% 43.25%      490ms  5.17%  runtime.(*fixalloc).alloc
     430ms  4.54% 47.78%      940ms  9.92%  runtime.sweepone
     260ms  2.74% 50.53%      280ms  2.95%  runtime.findObject
     260ms  2.74% 53.27%     4880ms 51.48%  runtime.mallocgc
     210ms  2.22% 55.49%      800ms  8.44%  runtime.scanobject
     180ms  1.90% 57.38%      200ms  2.11%  runtime.writeHeapBits.flush
     170ms  1.79% 59.18%      170ms  1.79%  hash/crc32.ieeeCLMUL
     170ms  1.79% 60.97%      170ms  1.79%  runtime.futex
(pprof) tree
Showing nodes accounting for 8.33s, 87.87% of 9.48s total
Dropped 256 nodes (cum <= 0.05s)
Showing top 80 nodes out of 141
----------------------------------------------------------+-------------
      flat  flat%   sum%        cum   cum%   calls calls% + context              
----------------------------------------------------------+-------------
                                             2.40s   100% |   runtime.mallocgc
     2.40s 25.32% 25.32%      2.40s 25.32%                | runtime.memclrNoHeapPointers
----------------------------------------------------------+-------------
                                             1.18s 97.52% |   syscall.RawSyscall6
     1.21s 12.76% 38.08%      1.21s 12.76%                | runtime/internal/syscall.Syscall6
----------------------------------------------------------+-------------
                                             0.46s 93.88% |   runtime.(*mheap).allocSpan
                                             0.03s  6.12% |   runtime.systemstack
     0.49s  5.17% 43.25%      0.49s  5.17%                | runtime.(*fixalloc).alloc
----------------------------------------------------------+-------------
                                             0.94s   100% |   runtime.bgsweep
     0.43s  4.54% 47.78%      0.94s  9.92%                | runtime.sweepone
                                             0.41s 43.62% |   runtime.(*sweepLocked).sweep
                                             0.03s  3.19% |   runtime.(*spanSet).pop
                                             0.03s  3.19% |   runtime.(*sweepLocker).tryAcquire
----------------------------------------------------------+-------------
                                             0.28s   100% |   runtime.scanobject
     0.26s  2.74% 50.53%      0.28s  2.95%                | runtime.findObject
----------------------------------------------------------+-------------
                                             4.54s 93.03% |   runtime.makeslice
                                             0.27s  5.53% |   runtime.newobject
                                             0.07s  1.43% |   github.com/pingcap/tidb/util/checksum.(*Reader).ReadAt
     0.26s  2.74% 53.27%      4.88s 51.48%                | runtime.mallocgc
                                             2.40s 49.18% |   runtime.memclrNoHeapPointers
                                             1.19s 24.39% |   runtime.(*mcache).nextFree
                                             0.43s  8.81% |   runtime.mProf_Malloc
                                             0.28s  5.74% |   runtime.(*mcache).allocLarge
                                             0.10s  2.05% |   runtime.heapBitsSetType
                                             0.10s  2.05% |   runtime.nextFreeFast (inline)
                                             0.03s  0.61% |   runtime.systemstack
----------------------------------------------------------+-------------
                                             0.79s 98.75% |   runtime.gcDrain
                                             0.01s  1.25% |   runtime.systemstack
     0.21s  2.22% 55.49%      0.80s  8.44%                | runtime.scanobject
                                             0.28s 35.00% |   runtime.findObject
                                             0.19s 23.75% |   runtime.greyobject
                                             0.08s 10.00% |   runtime.heapBitsForAddr
----------------------------------------------------------+-------------
                                             0.11s 55.00% |   runtime.(*mcentral).cacheSpan
                                             0.06s 30.00% |   runtime.(*mcache).allocLarge
                                             0.03s 15.00% |   runtime.heapBitsSetType
     0.18s  1.90% 57.38%      0.20s  2.11%                | runtime.writeHeapBits.flush
----------------------------------------------------------+-------------
                                             0.17s   100% |   hash/crc32.archUpdateIEEE
     0.17s  1.79% 59.18%      0.17s  1.79%                | hash/crc32.ieeeCLMUL
----------------------------------------------------------+-------------
                                             0.11s 64.71% |   runtime.unlock2
                                             0.04s 23.53% |   runtime.systemstack
     0.17s  1.79% 60.97%      0.17s  1.79%                | runtime.futex
----------------------------------------------------------+-------------
                                             0.12s 92.31% |   github.com/pingcap/tidb/util/chunk.appendCellByCell
                                             0.01s  7.69% |   github.com/pingcap/tidb/util/checksum.(*Reader).ReadAt
     0.13s  1.37% 62.34%      0.13s  1.37%                | runtime.memmove
----------------------------------------------------------+-------------
                                             0.05s 41.67% |   runtime.(*consistentHeapStats).acquire (inline)
                                             0.05s 41.67% |   runtime.(*consistentHeapStats).release (inline)
                                             0.02s 16.67% |   runtime.(*spanSet).pop (inline)
     0.12s  1.27% 63.61%      0.12s  1.27%                | runtime/internal/atomic.(*Uint32).Add
----------------------------------------------------------+-------------
                                             0.10s   100% |   github.com/pingcap/tidb/util/chunk.genCmpStringFunc.func1 (inline)
     0.10s  1.05% 64.66%      0.10s  1.05%                | github.com/pingcap/tidb/util/chunk.(*Column).IsNull
----------------------------------------------------------+-------------
                                             0.22s   100% |   github.com/pingcap/tidb/util/chunk.(*Chunk).AppendPartialRow
     0.10s  1.05% 65.72%      0.22s  2.32%                | github.com/pingcap/tidb/util/chunk.appendCellByCell
                                             0.12s 54.55% |   runtime.memmove
----------------------------------------------------------+-------------
                                             0.41s 97.62% |   runtime.sweepone
                                             0.01s  2.38% |   runtime.(*mcentral).cacheSpan
     0.10s  1.05% 66.77%      0.42s  4.43%                | runtime.(*sweepLocked).sweep
                                             0.24s 57.14% |   runtime.systemstack
                                             0.02s  4.76% |   runtime.unlock2
                                             0.01s  2.38% |   runtime.(*consistentHeapStats).acquire
                                             0.01s  2.38% |   runtime.(*consistentHeapStats).release
----------------------------------------------------------+-------------
                                             0.10s   100% |   runtime.mallocgc (inline)
     0.10s  1.05% 67.83%      0.10s  1.05%                | runtime.nextFreeFast
----------------------------------------------------------+-------------
                                             0.15s 57.69% |   runtime.pcdatavalue
                                             0.11s 42.31% |   runtime.gentraceback
     0.10s  1.05% 68.88%      0.26s  2.74%                | runtime.pcvalue
                                             0.12s 46.15% |   runtime.step
----------------------------------------------------------+-------------
                                             0.12s   100% |   runtime.pcvalue
     0.10s  1.05% 69.94%      0.12s  1.27%                | runtime.step
----------------------------------------------------------+-------------
                                             0.07s 87.50% |   runtime.(*mheap).freeSpanLocked
                                             0.01s 12.50% |   runtime.(*mheap).allocSpan
     0.08s  0.84% 70.78%      0.08s  0.84%                | runtime.(*pallocBits).summarize
----------------------------------------------------------+-------------
                                             0.07s   100% |   github.com/pingcap/tidb/types.CompareString (inline)
     0.07s  0.74% 71.52%      0.07s  0.74%                | github.com/pingcap/tidb/util/collate.truncateTailingSpace
----------------------------------------------------------+-------------
                                             0.09s   100% |   runtime.(*mcache).refill
     0.07s  0.74% 72.26%      0.09s  0.95%                | runtime.(*spanSet).push
----------------------------------------------------------+-------------
                                             0.04s 57.14% |   runtime.(*mcentral).cacheSpan
                                             0.03s 42.86% |   runtime.sweepone
     0.07s  0.74% 73.00%      0.07s  0.74%                | runtime.(*sweepLocker).tryAcquire
----------------------------------------------------------+-------------
                                             0.08s   100% |   runtime.scanobject
     0.07s  0.74% 73.73%      0.08s  0.84%                | runtime.heapBitsForAddr
----------------------------------------------------------+-------------
                                             0.07s 87.50% |   runtime.greyobject (inline)
                                             0.01s 12.50% |   runtime.(*mheap).freeSpanLocked (inline)
     0.07s  0.74% 74.47%      0.08s  0.84%                | runtime.pageIndexOf
----------------------------------------------------------+-------------
                                             0.06s   100% |   runtime.(*mcache).refill (inline)
     0.06s  0.63% 75.11%      0.06s  0.63%                | runtime.(*mcentral).partialSwept
----------------------------------------------------------+-------------
                                             0.06s   100% |   runtime.(*mheap).initSpan
     0.06s  0.63% 75.74%      0.06s  0.63%                | runtime.(*mspan).init
----------------------------------------------------------+-------------
                                             0.19s   100% |   runtime.scanobject
     0.06s  0.63% 76.37%      0.19s  2.00%                | runtime.greyobject
                                             0.07s 36.84% |   runtime.pageIndexOf (inline)
                                             0.05s 26.32% |   runtime.(*gcWork).putFast (inline)
----------------------------------------------------------+-------------
                                             1.92s   100% |   io.(*SectionReader).Read
     0.05s  0.53% 76.90%      1.92s 20.25%                | github.com/pingcap/tidb/util/checksum.(*Reader).ReadAt
                                             1.49s 77.60% |   os.(*File).ReadAt
                                             0.26s 13.54% |   hash/crc32.update
                                             0.07s  3.65% |   runtime.mallocgc
                                             0.01s  0.52% |   runtime.memmove
----------------------------------------------------------+-------------
                                             0.05s   100% |   hash/crc32.archUpdateIEEE (inline)
     0.05s  0.53% 77.43%      0.05s  0.53%                | hash/crc32.simpleUpdate
----------------------------------------------------------+-------------
                                             0.05s   100% |   runtime.greyobject (inline)
     0.05s  0.53% 77.95%      0.05s  0.53%                | runtime.(*gcWork).putFast
----------------------------------------------------------+-------------
                                             1.15s   100% |   runtime.(*mcache).nextFree
     0.05s  0.53% 78.48%      1.15s 12.13%                | runtime.(*mcache).refill
                                             0.87s 75.65% |   runtime.(*mcentral).cacheSpan
                                             0.09s  7.83% |   runtime.(*spanSet).push
                                             0.06s  5.22% |   runtime.(*mcentral).partialSwept (inline)
                                             0.03s  2.61% |   runtime.(*consistentHeapStats).release
                                             0.01s  0.87% |   runtime.(*consistentHeapStats).acquire
----------------------------------------------------------+-------------
                                             0.21s   100% |   runtime.systemstack
     0.05s  0.53% 79.01%      0.21s  2.22%                | runtime.(*mheap).freeSpanLocked
                                             0.07s 33.33% |   runtime.(*pallocBits).summarize
                                             0.02s  9.52% |   runtime.(*consistentHeapStats).acquire
                                             0.02s  9.52% |   runtime.(*consistentHeapStats).release
                                             0.01s  4.76% |   runtime.pageIndexOf (inline)
----------------------------------------------------------+-------------
                                             0.16s   100% |   runtime.(*mheap).allocSpan
     0.05s  0.53% 79.54%      0.16s  1.69%                | runtime.(*mheap).initSpan
                                             0.06s 37.50% |   runtime.(*mspan).init
----------------------------------------------------------+-------------
                                             1.96s   100% |   io.ReadAtLeast
     0.04s  0.42% 79.96%      1.96s 20.68%                | io.(*SectionReader).Read
                                             1.92s 97.96% |   github.com/pingcap/tidb/util/checksum.(*Reader).ReadAt
----------------------------------------------------------+-------------
                                             1.49s   100% |   github.com/pingcap/tidb/util/checksum.(*Reader).ReadAt
     0.04s  0.42% 80.38%      1.49s 15.72%                | os.(*File).ReadAt
                                             1.45s 97.32% |   os.(*File).pread (inline)
----------------------------------------------------------+-------------
                                             0.87s   100% |   runtime.(*mcache).refill
     0.04s  0.42% 80.80%      0.87s  9.18%                | runtime.(*mcentral).cacheSpan
                                             0.63s 72.41% |   runtime.(*mheap).alloc
                                             0.11s 12.64% |   runtime.writeHeapBits.flush
                                             0.04s  4.60% |   runtime.(*sweepLocker).tryAcquire
                                             0.02s  2.30% |   runtime.(*spanSet).pop
                                             0.01s  1.15% |   runtime.(*sweepLocked).sweep
----------------------------------------------------------+-------------
                                             0.80s   100% |   runtime.(*mheap).alloc.func1
     0.04s  0.42% 81.22%      0.80s  8.44%                | runtime.(*mheap).allocSpan
                                             0.46s 57.50% |   runtime.(*fixalloc).alloc
                                             0.16s 20.00% |   runtime.(*mheap).initSpan
                                             0.09s 11.25% |   runtime.unlock2
                                             0.01s  1.25% |   runtime.(*pallocBits).summarize
----------------------------------------------------------+-------------
                                             0.09s   100% |   syscall.Syscall6
     0.04s  0.42% 81.65%      0.09s  0.95%                | runtime.exitsyscall
----------------------------------------------------------+-------------
                                             0.36s   100% |   runtime.systemstack
     0.04s  0.42% 82.07%      0.36s  3.80%                | runtime.gentraceback
                                             0.17s 47.22% |   runtime.pcdatavalue
                                             0.11s 30.56% |   runtime.pcvalue
----------------------------------------------------------+-------------
                                             0.10s   100% |   runtime.mallocgc
     0.04s  0.42% 82.49%      0.10s  1.05%                | runtime.heapBitsSetType
                                             0.03s 30.00% |   runtime.writeHeapBits.flush
----------------------------------------------------------+-------------
                                             0.04s 50.00% |   runtime.systemstack
                                             0.01s 12.50% |   runtime.gcDrain
     0.04s  0.42% 82.91%      0.08s  0.84%                | runtime.lock2
----------------------------------------------------------+-------------
                                             4.70s   100% |   github.com/pingcap/tidb/executor.(*ExplainExec).executeAnalyzeExec
     0.03s  0.32% 83.23%      4.70s 49.58%                | github.com/pingcap/tidb/util/chunk.(*diskFormatRow).toRow
                                             2.72s 57.87% |   runtime.makeslice
                                             1.80s 38.30% |   github.com/pingcap/tidb/util/chunk.newFixedLenColumn (inline)
                                             0.14s  2.98% |   runtime.newobject
----------------------------------------------------------+-------------
                                             0.25s   100% |   hash/crc32.update
     0.03s  0.32% 83.54%      0.25s  2.64%                | hash/crc32.archUpdateIEEE
                                             0.17s 68.00% |   hash/crc32.ieeeCLMUL
                                             0.05s 20.00% |   hash/crc32.simpleUpdate (inline)
----------------------------------------------------------+-------------
                                             1.19s   100% |   runtime.mallocgc
     0.03s  0.32% 83.86%      1.19s 12.55%                | runtime.(*mcache).nextFree
                                             1.15s 96.64% |   runtime.(*mcache).refill
----------------------------------------------------------+-------------
                                             2.72s 59.52% |   github.com/pingcap/tidb/util/chunk.(*diskFormatRow).toRow
                                             1.72s 37.64% |   github.com/pingcap/tidb/util/chunk.newFixedLenColumn
                                             0.13s  2.84% |   github.com/pingcap/tidb/util/chunk.(*rowInDisk).ReadFrom
     0.03s  0.32% 84.18%      4.57s 48.21%                | runtime.makeslice
                                             4.54s 99.34% |   runtime.mallocgc
----------------------------------------------------------+-------------
                                             0.25s   100% |   github.com/pingcap/tidb/executor.(*multiWayMerge).Less
     0.02s  0.21% 84.39%      0.25s  2.64%                | github.com/pingcap/tidb/executor.(*SortExec).lessRow
                                             0.23s 92.00% |   github.com/pingcap/tidb/util/chunk.genCmpStringFunc.func1
----------------------------------------------------------+-------------
                                             0.03s 60.00% |   runtime.sweepone
                                             0.02s 40.00% |   runtime.(*mcentral).cacheSpan
     0.02s  0.21% 84.60%      0.05s  0.53%                | runtime.(*spanSet).pop
                                             0.02s 40.00% |   runtime/internal/atomic.(*Uint32).Add (inline)
----------------------------------------------------------+-------------
                                             0.17s   100% |   runtime.gentraceback
     0.02s  0.21% 84.81%      0.17s  1.79%                | runtime.pcdatavalue
                                             0.15s 88.24% |   runtime.pcvalue
----------------------------------------------------------+-------------
                                             1.36s   100% |   syscall.pread
     0.02s  0.21% 85.02%      1.36s 14.35%                | syscall.Syscall6
                                             1.17s 86.03% |   syscall.RawSyscall6
                                             0.09s  6.62% |   runtime.exitsyscall
                                             0.08s  5.88% |   runtime.entersyscall
----------------------------------------------------------+-------------
                                             1.38s   100% |   internal/poll.(*FD).Pread
     0.02s  0.21% 85.23%      1.38s 14.56%                | syscall.pread
                                             1.36s 98.55% |   syscall.Syscall6
----------------------------------------------------------+-------------
                                             0.27s   100% |   container/heap.Fix
     0.01s  0.11% 85.34%      0.27s  2.85%                | container/heap.down
                                             0.26s 96.30% |   github.com/pingcap/tidb/executor.(*multiWayMerge).Less
----------------------------------------------------------+-------------
                                             0.26s   100% |   container/heap.down
     0.01s  0.11% 85.44%      0.26s  2.74%                | github.com/pingcap/tidb/executor.(*multiWayMerge).Less
                                             0.25s 96.15% |   github.com/pingcap/tidb/executor.(*SortExec).lessRow
----------------------------------------------------------+-------------
                                             0.08s   100% |   github.com/pingcap/tidb/util/chunk.genCmpStringFunc.func1
     0.01s  0.11% 85.55%      0.08s  0.84%                | github.com/pingcap/tidb/types.CompareString
                                             0.07s 87.50% |   github.com/pingcap/tidb/util/collate.truncateTailingSpace (inline)
----------------------------------------------------------+-------------
                                             0.23s   100% |   github.com/pingcap/tidb/executor.(*ExplainExec).executeAnalyzeExec
     0.01s  0.11% 85.65%      0.23s  2.43%                | github.com/pingcap/tidb/util/chunk.(*Chunk).AppendPartialRow
                                             0.22s 95.65% |   github.com/pingcap/tidb/util/chunk.appendCellByCell
----------------------------------------------------------+-------------
                                             0.44s   100% |   github.com/pingcap/tidb/executor.(*ExplainExec).executeAnalyzeExec
     0.01s  0.11% 85.76%      0.44s  4.64%                | github.com/pingcap/tidb/util/chunk.(*ListInDisk).getOffset
                                             0.39s 88.64% |   io.ReadAtLeast
                                             0.04s  9.09% |   runtime.newobject
----------------------------------------------------------+-------------
                                             1.72s   100% |   github.com/pingcap/tidb/executor.(*ExplainExec).executeAnalyzeExec
     0.01s  0.11% 85.86%      1.72s 18.14%                | github.com/pingcap/tidb/util/chunk.(*rowInDisk).ReadFrom
                                             1.58s 91.86% |   io.ReadAtLeast
                                             0.13s  7.56% |   runtime.makeslice
----------------------------------------------------------+-------------
                                             0.23s   100% |   github.com/pingcap/tidb/executor.(*SortExec).lessRow
     0.01s  0.11% 85.97%      0.23s  2.43%                | github.com/pingcap/tidb/util/chunk.genCmpStringFunc.func1
                                             0.10s 43.48% |   github.com/pingcap/tidb/util/chunk.(*Column).IsNull (inline)
                                             0.08s 34.78% |   github.com/pingcap/tidb/types.CompareString
----------------------------------------------------------+-------------
                                             1.80s   100% |   github.com/pingcap/tidb/util/chunk.(*diskFormatRow).toRow (inline)
     0.01s  0.11% 86.08%      1.80s 18.99%                | github.com/pingcap/tidb/util/chunk.newFixedLenColumn
                                             1.72s 95.56% |   runtime.makeslice
                                             0.07s  3.89% |   runtime.newobject
----------------------------------------------------------+-------------
                                             0.26s   100% |   github.com/pingcap/tidb/util/checksum.(*Reader).ReadAt
     0.01s  0.11% 86.18%      0.26s  2.74%                | hash/crc32.update
                                             0.25s 96.15% |   hash/crc32.archUpdateIEEE
----------------------------------------------------------+-------------
                                             1.44s   100% |   os.(*File).pread
     0.01s  0.11% 86.29%      1.44s 15.19%                | internal/poll.(*FD).Pread
                                             1.38s 95.83% |   syscall.pread
----------------------------------------------------------+-------------
                                             1.58s 80.20% |   github.com/pingcap/tidb/util/chunk.(*rowInDisk).ReadFrom
                                             0.39s 19.80% |   github.com/pingcap/tidb/util/chunk.(*ListInDisk).getOffset
     0.01s  0.11% 86.39%      1.97s 20.78%                | io.ReadAtLeast
                                             1.96s 99.49% |   io.(*SectionReader).Read
----------------------------------------------------------+-------------
                                             1.45s   100% |   os.(*File).ReadAt (inline)
     0.01s  0.11% 86.50%      1.45s 15.30%                | os.(*File).pread
                                             1.44s 99.31% |   internal/poll.(*FD).Pread
----------------------------------------------------------+-------------
                                             0.02s 33.33% |   runtime.(*mcache).allocLarge
                                             0.02s 33.33% |   runtime.(*mheap).freeSpanLocked
                                             0.01s 16.67% |   runtime.(*mcache).refill
                                             0.01s 16.67% |   runtime.(*sweepLocked).sweep
     0.01s  0.11% 86.60%      0.06s  0.63%                | runtime.(*consistentHeapStats).acquire
                                             0.05s 83.33% |   runtime/internal/atomic.(*Uint32).Add (inline)
----------------------------------------------------------+-------------
                                             0.03s 50.00% |   runtime.(*mcache).refill
                                             0.02s 33.33% |   runtime.(*mheap).freeSpanLocked
                                             0.01s 16.67% |   runtime.(*sweepLocked).sweep
     0.01s  0.11% 86.71%      0.06s  0.63%                | runtime.(*consistentHeapStats).release
                                             0.05s 83.33% |   runtime/internal/atomic.(*Uint32).Add (inline)
----------------------------------------------------------+-------------
                                             0.28s   100% |   runtime.mallocgc
     0.01s  0.11% 86.81%      0.28s  2.95%                | runtime.(*mcache).allocLarge
                                             0.19s 67.86% |   runtime.(*mheap).alloc
                                             0.06s 21.43% |   runtime.writeHeapBits.flush
                                             0.02s  7.14% |   runtime.(*consistentHeapStats).acquire
----------------------------------------------------------+-------------
                                             0.63s 76.83% |   runtime.(*mcentral).cacheSpan
                                             0.19s 23.17% |   runtime.(*mcache).allocLarge
     0.01s  0.11% 86.92%      0.82s  8.65%                | runtime.(*mheap).alloc
                                             0.81s 98.78% |   runtime.systemstack
----------------------------------------------------------+-------------
                                             0.81s   100% |   runtime.systemstack
     0.01s  0.11% 87.03%      0.81s  8.54%                | runtime.(*mheap).alloc.func1
                                             0.80s 98.77% |   runtime.(*mheap).allocSpan
----------------------------------------------------------+-------------
     0.01s  0.11% 87.13%      0.95s 10.02%                | runtime.bgsweep
                                             0.94s 98.95% |   runtime.sweepone
----------------------------------------------------------+-------------
                                             0.08s   100% |   syscall.Syscall6
     0.01s  0.11% 87.24%      0.08s  0.84%                | runtime.entersyscall
                                             0.01s 12.50% |   runtime.systemstack
----------------------------------------------------------+-------------
                                             0.87s   100% |   runtime.systemstack
     0.01s  0.11% 87.34%      0.87s  9.18%                | runtime.gcDrain
                                             0.79s 90.80% |   runtime.scanobject
                                             0.01s  1.15% |   runtime.lock2
----------------------------------------------------------+-------------
                                             0.43s   100% |   runtime.mallocgc
     0.01s  0.11% 87.45%      0.43s  4.54%                | runtime.mProf_Malloc
                                             0.41s 95.35% |   runtime.systemstack
----------------------------------------------------------+-------------
                                             0.14s 50.00% |   github.com/pingcap/tidb/util/chunk.(*diskFormatRow).toRow
                                             0.07s 25.00% |   github.com/pingcap/tidb/util/chunk.newFixedLenColumn
                                             0.04s 14.29% |   github.com/pingcap/tidb/util/chunk.(*ListInDisk).getOffset
                                             0.02s  7.14% |   github.com/pingcap/tidb/executor.(*ExplainExec).executeAnalyzeExec
     0.01s  0.11% 87.55%      0.28s  2.95%                | runtime.newobject
                                             0.27s 96.43% |   runtime.mallocgc
----------------------------------------------------------+-------------
                                             0.81s 33.33% |   runtime.(*mheap).alloc
                                             0.41s 16.87% |   runtime.mProf_Malloc
                                             0.24s  9.88% |   runtime.(*sweepLocked).sweep
                                             0.03s  1.23% |   runtime.mallocgc
                                             0.01s  0.41% |   github.com/pingcap/tidb/executor.(*ExecStmt).next
                                             0.01s  0.41% |   runtime.entersyscall
     0.01s  0.11% 87.66%      2.43s 25.63%                | runtime.systemstack
                                             0.87s 35.80% |   runtime.gcDrain
                                             0.81s 33.33% |   runtime.(*mheap).alloc.func1
                                             0.36s 14.81% |   runtime.gentraceback
                                             0.21s  8.64% |   runtime.(*mheap).freeSpanLocked
                                             0.04s  1.65% |   runtime.futex
                                             0.04s  1.65% |   runtime.lock2
                                             0.03s  1.23% |   runtime.(*fixalloc).alloc
                                             0.01s  0.41% |   runtime.scanobject
                                             0.01s  0.41% |   runtime.unlock2
----------------------------------------------------------+-------------
                                             0.09s 75.00% |   runtime.(*mheap).allocSpan
                                             0.02s 16.67% |   runtime.(*sweepLocked).sweep
                                             0.01s  8.33% |   runtime.systemstack
     0.01s  0.11% 87.76%      0.12s  1.27%                | runtime.unlock2
                                             0.11s 91.67% |   runtime.futex
----------------------------------------------------------+-------------
                                             1.17s 98.32% |   syscall.Syscall6
     0.01s  0.11% 87.87%      1.19s 12.55%                | syscall.RawSyscall6
                                             1.18s 99.16% |   runtime/internal/syscall.Syscall6
----------------------------------------------------------+-------------
                                             0.27s   100% |   github.com/pingcap/tidb/executor.(*ExplainExec).executeAnalyzeExec
         0     0% 87.87%      0.27s  2.85%                | container/heap.Fix
                                             0.27s   100% |   container/heap.down
----------------------------------------------------------+-------------
         0     0% 87.87%      7.45s 78.59%                | github.com/pingcap/tidb/executor.(*ExecStmt).next
                                             7.44s 99.87% |   github.com/pingcap/tidb/executor.(*ExplainExec).Next
                                             0.01s  0.13% |   runtime.systemstack
----------------------------------------------------------+-------------
                                             7.44s   100% |   github.com/pingcap/tidb/executor.(*ExecStmt).next
         0     0% 87.87%      7.44s 78.48%                | github.com/pingcap/tidb/executor.(*ExplainExec).Next
                                             7.44s   100% |   github.com/pingcap/tidb/executor.(*ExplainExec).generateExplainInfo
----------------------------------------------------------+-------------
                                             7.44s   100% |   github.com/pingcap/tidb/executor.(*ExplainExec).generateExplainInfo
         0     0% 87.87%      7.44s 78.48%                | github.com/pingcap/tidb/executor.(*ExplainExec).executeAnalyzeExec
                                             4.70s 63.17% |   github.com/pingcap/tidb/util/chunk.(*diskFormatRow).toRow
                                             1.72s 23.12% |   github.com/pingcap/tidb/util/chunk.(*rowInDisk).ReadFrom
                                             0.44s  5.91% |   github.com/pingcap/tidb/util/chunk.(*ListInDisk).getOffset
                                             0.27s  3.63% |   container/heap.Fix
                                             0.23s  3.09% |   github.com/pingcap/tidb/util/chunk.(*Chunk).AppendPartialRow
                                             0.02s  0.27% |   runtime.newobject
----------------------------------------------------------+-------------
                                             7.44s   100% |   github.com/pingcap/tidb/executor.(*ExplainExec).Next
         0     0% 87.87%      7.44s 78.48%                | github.com/pingcap/tidb/executor.(*ExplainExec).generateExplainInfo
                                             7.44s   100% |   github.com/pingcap/tidb/executor.(*ExplainExec).executeAnalyzeExec

:call_me_hand::call_me_hand::call_me_hand:

在 7.1.1 当中对落盘进行的优化只优化了 GetChunk 这一个函数(在连续读数据的时候会用到它)。Sort 算子落盘确实不会有明显提升,因为 Sort 落在盘上是随机的,不会使用 GetChunk 来读。

不过 SortExec 里面的 Chunk 分配确实有很大的优化空间。有一个 PR 在尝试优化它:https://github.com/pingcap/tidb/pull/46483 :saluting_face:

1 个赞

:+1: :+1: 大佬可以直接提交优化后代码

这个能否结合hashagg的落盘一起优化呢,hashagg落盘后也是慢并且空间放大很明显,参考这个帖子:对于hashAgg算子非并行模式下还是发生OOM , 其中一个问题是:3、对于问题3 ,多次落盘操作不但放大了问题1,而且还导致磁盘空间急剧膨胀,能否设计成多个“段”,及时回收无用空间呢? 。
请大佬结合多个算子落盘行为通盘考虑,尽量做到复用对象(避免过多GC)的情况下,一次读写IO尽可能的高效(一个或多个chunk,我想也要同时考虑大字段情况,避免一次IO过大占用较多内存),数据落盘后尽可能紧凑(避免浪费空间),来统一设计一个落盘机制。非常感谢!

多次落盘空间放大的问题我还没怎么考虑 :man_facepalming: 学习了。

不过至少在效率上,7.1.1 上的这个优化应该对 HashAgg 已经有一些效果了。我们在自己的一些负载上已经能看到 HashAgg 落盘的性能有比较明显的提升:单看 HashAgg 变快了 30%+(这个数字只代表特定 Query 在特定环境下运行的结果)。

收到,谢谢大佬。
我简单做了下测试,在重复度较低的情况下,落盘较少情况下效率提升一倍不止,如下:
tpch100,select c_phone,count() from customer group by c_phone order by count() desc limit 10;
6.5.0版本:
落盘700MB,整体耗时2m56s。
6.5.4版本:
落盘700MB,整体耗时1m12s。
在较大数据量落盘情况下,我估计会更可观,这对于hashAGG的落盘效率有相当大提升 :pray:

2 个赞

等大佬的sort落盘效率提升发版后我就关贴 :smiley:

这个PR已经实现了并行落盘能力:https://github.com/pingcap/tidb/pull/50747

mark一下

支持一下