【 TiDB 使用环境】测试
【 TiDB 版本】v7.0.0
因为hashAgg算子在开启并行时候不能落盘导致内存不可控或容易被oom,在实际生产中需要尽可能的避免中断,因此会采用单线程做hashAgg让其尽量落盘,减少内存的使用。但是在实际使用中经常遇到使用了非并行模式的hashAgg还是会发生语句oom的问题。
对于非并行hashAgg算子的大体执行逻辑如下:
select col1,count(*) from a group by col1,优先将col1(去重复得到key)放到一个map中,对于子算子流入的chunk(多行记录)逐行计算,如果col1已经存在map中则进行函数计算(这里是count),如果不存在那么就进行判断是否已经开始落盘。假设发生了落盘行为,那么对于后续的chunk中的行只要不存在map中那么就进行一行一行的落盘操作。如此以来可以得到第一批在发生落盘之前就存在map中的key以及聚合记录,然后返回给父算子。接下来在磁盘中一行一行的(导致性能慢,问题1)读取之前未处理的记录,重复之前的步骤,如果内存还是不足则进行二次落盘(此时有一个落盘计数器spillTimes),但最多不能超过maxSpillTimes=10次(为何限制最大落盘次数,问题2),并且二次落盘会在落盘临时文件中继续追加,之前记录并没有清空,可能会导致磁盘空间占用很大(问题3)。
参数设置如下:
mysql> show variables like 'tidb_hashagg%';
+----------------------------------+-------+
| Variable_name                    | Value |
+----------------------------------+-------+
| tidb_hashagg_final_concurrency   | 1     |
| tidb_hashagg_partial_concurrency | 1     |
+----------------------------------+-------+
2 rows in set (0.00 sec)

mysql> show variables like 'tidb_mem_quota_query';
+----------------------+------------+
| Variable_name        | Value      |
+----------------------+------------+
| tidb_mem_quota_query | 1073741824 |
+----------------------+------------+
1 row in set (0.00 sec)

mysql> show variables like 'tidb_enable_rate_limit_action';
+-------------------------------+-------+
| Variable_name                 | Value |
+-------------------------------+-------+
| tidb_enable_rate_limit_action | OFF   |
+-------------------------------+-------+
1 row in set (0.01 sec)
mysql> show variables like '%oom%';
+--------------------------------+--------+
| Variable_name                  | Value  |
+--------------------------------+--------+
| tidb_enable_tmp_storage_on_oom | ON     |
| tidb_mem_oom_action            | CANCEL |
+--------------------------------+--------+
2 rows in set (0.00 sec)
测试如下:
mysql> explain analyze  select C_NAME,count(C_PHONE) from customer group by c_name;
+----------------------------+-------------+----------+-----------+----------------+----------------------------------------------------------------------------------------------------------------------------------------------------------------------------------------------------------------------------------------------------------------------------------------------------------+-----------------------------------------------------------------------------------------------------------------------------------------------------+----------+---------+
| id                         | estRows     | actRows  | task      | access object  | execution info                                                                                                                                                                                                                                                                                           | operator info                                                                                                                                       | memory   | disk    |
+----------------------------+-------------+----------+-----------+----------------+----------------------------------------------------------------------------------------------------------------------------------------------------------------------------------------------------------------------------------------------------------------------------------------------------------+-----------------------------------------------------------------------------------------------------------------------------------------------------+----------+---------+
| Projection_4               | 15000000.00 | 15000000 | root      |                | time:2m6s, loops:14650, RRU:48513.136572, WRU:0.000000, Concurrency:5                                                                                                                                                                                                                                    | tpch100.customer.c_name, Column#9                                                                                                                   | 427.8 KB | N/A     |
| └─HashAgg_7                | 15000000.00 | 15000000 | root      |                | time:2m5.9s, loops:14650                                                                                                                                                                                                                                                                                 | group by:tpch100.customer.c_name, funcs:count(tpch100.customer.c_phone)->Column#9, funcs:firstrow(tpch100.customer.c_name)->tpch100.customer.c_name | 971.6 MB | 1.38 GB |
|   └─TableReader_12         | 15000000.00 | 15000000 | root      |                | time:146.5ms, loops:14675, cop_task: {num: 565, max: 58.6ms, min: 393µs, avg: 12.5ms, p95: 26.4ms, max_proc_keys: 50144, p95_proc_keys: 50144, tot_proc: 5.39s, tot_wait: 65.6ms, rpc_num: 565, rpc_time: 7.04s, copr_cache_hit_ratio: 0.00, build_task_duration: 37.6µs, max_distsql_concurrency: 15}   | data:TableFullScan_11                                                                                                                               | 37.5 MB  | N/A     |
|     └─TableFullScan_11     | 15000000.00 | 15000000 | cop[tikv] | table:customer | tikv_task:{proc max:38ms, min:0s, avg: 8.29ms, p80:15ms, p95:20ms, iters:16879, tasks:565}, scan_detail: {total_process_keys: 15000000, total_process_keys_size: 3052270577, total_keys: 15000565, get_snapshot_time: 22.2ms, rocksdb: {key_skipped_count: 15000000, block: {cache_hit_count: 103777}}}  | keep order:false                                                                                                                                    | N/A      | N/A     |
+----------------------------+-------------+----------+-----------+----------------+----------------------------------------------------------------------------------------------------------------------------------------------------------------------------------------------------------------------------------------------------------------------------------------------------------+-----------------------------------------------------------------------------------------------------------------------------------------------------+----------+---------+
4 rows in set (2 min 6.19 sec)

mysql> explain analyze  select C_NAME,count(C_PHONE),count(C_ADDRESS) from customer group by c_name;
ERROR 1105 (HY000): Out Of Memory Quota![conn=3978033069293983]
观察其执行过程中的tidb日志如下:
[2023/05/03 23:17:15.596 +08:00] [INFO] [controller.go:282] ["[resource group controller] create resource group cost controller"] [name=default]
[2023/05/03 23:17:16.310 +08:00] [INFO] [aggregate.go:1949] ["memory exceeds quota, set aggregate mode to spill-mode"] [spillTimes=1] [consumed=165914156] [quota=207374182]
[2023/05/03 23:17:28.915 +08:00] [WARN] [expensivequery.go:118] ["memory exceeds quota"] [cost_time=13.329033457s] [cop_time=0.015257304s] [process_time=6.481480135s] [wait_time=0.047572265s] [request_count=565] [total_keys=14977315] [process_keys=14976768] [num_cop_tasks=565] [process_avg_time=0.011471646s] [process_p90_time=0.024542849s] [process_max_time=0.035438311s] [process_max_addr=192.168.31.201:20160] [wait_avg_time=0.000084198s] [wait_p90_time=0.000135554s] [wait_max_time=0.000884638s] [wait_max_addr=192.168.31.201:20160] [stats=customer:441211688017461249] [conn=3978033069293983] [user=root] [database=tpch100] [table_ids="[369]"] [txn_start_ts=441221653614297089] [mem_max="232134581 Bytes (221.4 MB)"] [sql="explain analyze  select C_NAME,count(C_PHONE),count(C_ADDRESS) from customer group by c_name"]
[2023/05/03 23:17:28.915 +08:00] [ERROR] [projection.go:466] ["projection executor panicked"] [error="Out Of Memory Quota![conn=3978033069293983]"] [stack="github.com/pingcap/tidb/executor.recoveryProjection\n\t/home/jenkins/agent/workspace/build-common/go/src/github.com/pingcap/tidb/executor/projection.go:466\ngithub.com/pingcap/tidb/executor.(*projectionInputFetcher).run.func1\n\t/home/jenkins/agent/workspace/build-common/go/src/github.com/pingcap/tidb/executor/projection.go:364\nruntime.gopanic\n\t/usr/local/go/src/runtime/panic.go:884\ngithub.com/pingcap/tidb/util/memory.(*PanicOnExceed).Action\n\t/home/jenkins/agent/workspace/build-common/go/src/github.com/pingcap/tidb/util/memory/action.go:148\ngithub.com/pingcap/tidb/util/memory.(*Tracker).Consume.func1\n\t/home/jenkins/agent/workspace/build-common/go/src/github.com/pingcap/tidb/util/memory/tracker.go:437\ngithub.com/pingcap/tidb/util/memory.(*Tracker).Consume\n\t/home/jenkins/agent/workspace/build-common/go/src/github.com/pingcap/tidb/util/memory/tracker.go:478\ngithub.com/pingcap/tidb/executor.(*HashAggExec).getPartialResults\n\t/home/jenkins/agent/workspace/build-common/go/src/github.com/pingcap/tidb/executor/aggregate.go:1121\ngithub.com/pingcap/tidb/executor.(*HashAggExec).execute\n\t/home/jenkins/agent/workspace/build-common/go/src/github.com/pingcap/tidb/executor/aggregate.go:1045\ngithub.com/pingcap/tidb/executor.(*HashAggExec).unparallelExec\n\t/home/jenkins/agent/workspace/build-common/go/src/github.com/pingcap/tidb/executor/aggregate.go:970\ngithub.com/pingcap/tidb/executor.(*HashAggExec).Next\n\t/home/jenkins/agent/workspace/build-common/go/src/github.com/pingcap/tidb/executor/aggregate.go:789\ngithub.com/pingcap/tidb/executor.Next\n\t/home/jenkins/agent/workspace/build-common/go/src/github.com/pingcap/tidb/executor/executor.go:326\ngithub.com/pingcap/tidb/executor.(*projectionInputFetcher).run\n\t/home/jenkins/agent/workspace/build-common/go/src/github.com/pingcap/tidb/executor/projection.go:388"]
[2023/05/03 23:17:29.098 +08:00] [INFO] [conn.go:1151] ["command dispatched failed"] [conn=3978033069293983] [connInfo="id:3978033069293983, addr:192.168.31.200:37786 status:10, collation:utf8mb4_0900_ai_ci, user:root"] [command=Query] [status="inTxn:0, autocommit:1"] [sql="explain analyze  select C_NAME,count(C_PHONE),count(C_ADDRESS) from customer group by c_name"] [txn_mode=PESSIMISTIC] [timestamp=441221653614297089] [err="Out Of Memory Quota![conn=3978033069293983]\ngithub.com/pingcap/tidb/executor.recoveryProjection\n\t/home/jenkins/agent/workspace/build-common/go/src/github.com/pingcap/tidb/executor/projection.go:464\ngithub.com/pingcap/tidb/executor.(*projectionInputFetcher).run.func1\n\t/home/jenkins/agent/workspace/build-common/go/src/github.com/pingcap/tidb/executor/projection.go:364\nruntime.gopanic\n\t/usr/local/go/src/runtime/panic.go:884\ngithub.com/pingcap/tidb/util/memory.(*PanicOnExceed).Action\n\t/home/jenkins/agent/workspace/build-common/go/src/github.com/pingcap/tidb/util/memory/action.go:148\ngithub.com/pingcap/tidb/util/memory.(*Tracker).Consume.func1\n\t/home/jenkins/agent/workspace/build-common/go/src/github.com/pingcap/tidb/util/memory/tracker.go:437\ngithub.com/pingcap/tidb/util/memory.(*Tracker).Consume\n\t/home/jenkins/agent/workspace/build-common/go/src/github.com/pingcap/tidb/util/memory/tracker.go:478\ngithub.com/pingcap/tidb/executor.(*HashAggExec).getPartialResults\n\t/home/jenkins/agent/workspace/build-common/go/src/github.com/pingcap/tidb/executor/aggregate.go:1121\ngithub.com/pingcap/tidb/executor.(*HashAggExec).execute\n\t/home/jenkins/agent/workspace/build-common/go/src/github.com/pingcap/tidb/executor/aggregate.go:1045\ngithub.com/pingcap/tidb/executor.(*HashAggExec).unparallelExec\n\t/home/jenkins/agent/workspace/build-common/go/src/github.com/pingcap/tidb/executor/aggregate.go:970\ngithub.com/pingcap/tidb/executor.(*HashAggExec).Next\n\t/home/jenkins/agent/workspace/build-common/go/src/github.com/pingcap/tidb/executor/aggregate.go:789\ngithub.com/pingcap/tidb/executor.Next\n\t/home/jenkins/agent/workspace/build-common/go/src/github.com/pingcap/tidb/executor/executor.go:326\ngithub.com/pingcap/tidb/executor.(*projectionInputFetcher).run\n\t/home/jenkins/agent/workspace/build-common/go/src/github.com/pingcap/tidb/executor/projection.go:388\nruntime.goexit\n\t/usr/local/go/src/runtime/asm_amd64.s:1598"]
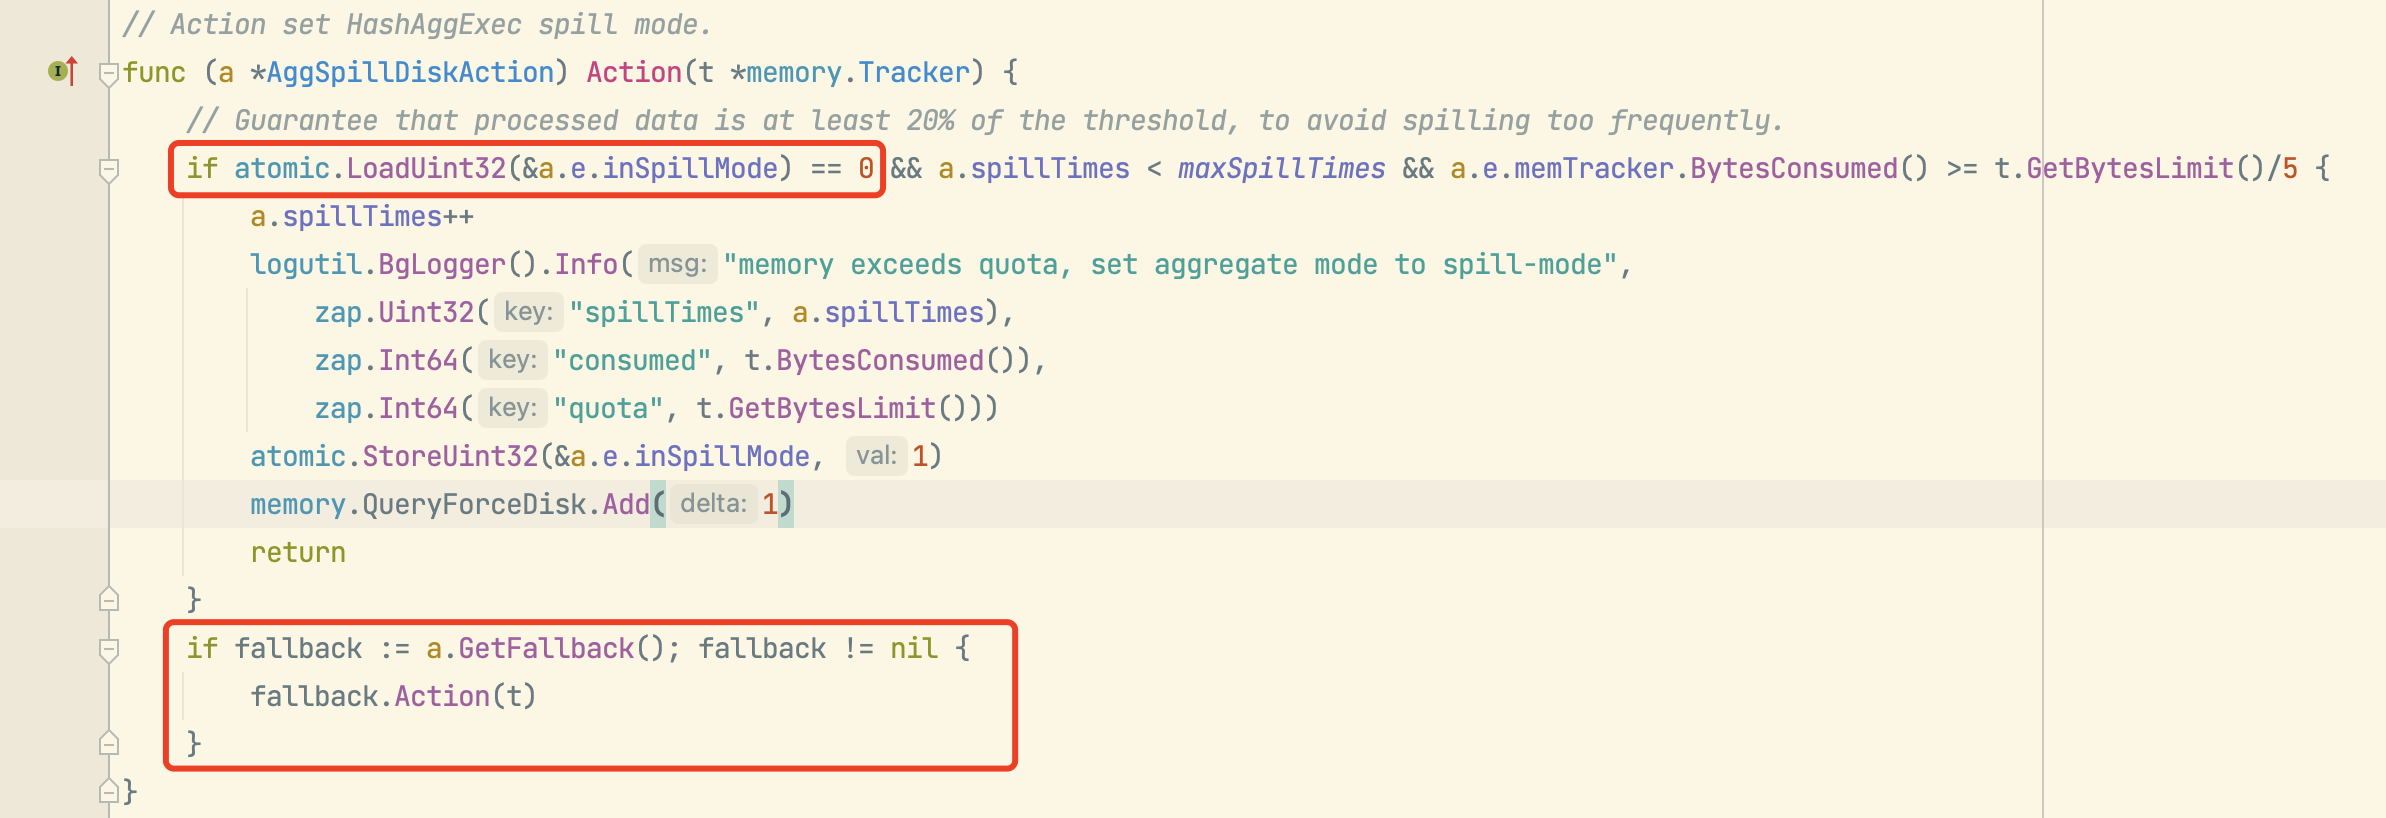
可以看到在做hashAgg时候最大溢出到磁盘的次数为:spillTimes=1,只有一次。在其落盘行为定义中需要超过10次落盘(maxSpillTimes)才会回退到oom-action=cancel(DefPanicPriority最低优先级),否则会优先进行落盘(DefSpillPriority)。相关代码:
https://github.com/pingcap/tidb/blob/7eff8ce629d00cf4ab1eeda82a1ecd5a4e394b02/executor/aggregate.go#L1945
// Action set HashAggExec spill mode.
func (a *AggSpillDiskAction) Action(t *memory.Tracker) {
	// Guarantee that processed data is at least 20% of the threshold, to avoid spilling too frequently.
	if atomic.LoadUint32(&a.e.inSpillMode) == 0 && a.spillTimes < maxSpillTimes && a.e.memTracker.BytesConsumed() >= t.GetBytesLimit()/5 {
		a.spillTimes++
		logutil.BgLogger().Info("memory exceeds quota, set aggregate mode to spill-mode",
			zap.Uint32("spillTimes", a.spillTimes),
			zap.Int64("consumed", t.BytesConsumed()),
			zap.Int64("quota", t.GetBytesLimit()))
		atomic.StoreUint32(&a.e.inSpillMode, 1)
		memory.QueryForceDisk.Add(1)
		return
	}
	if fallback := a.GetFallback(); fallback != nil {
		fallback.Action(t)
	}
}
既然只做一次落盘,为什么还是会被cancel掉呢(问题4)?
1、对于问题1,几乎所有的落盘行为都存在这种缓慢的情况,能否进行优化?
2、对于问题2,为何限制重复落盘次数maxSpillTimes=10次呢?
3、对于问题3,多次落盘操作不但放大了问题1,而且还导致磁盘空间急剧膨胀,能否设计成多个“段”,及时回收无用空间呢?
4、对于问题4,即使开启了落盘,还是会经常遇到被cancel的情况,主要是什么原因导致,可否进行优化?
5、另外,对于并行hashAgg,是否有计划添加落盘行为?