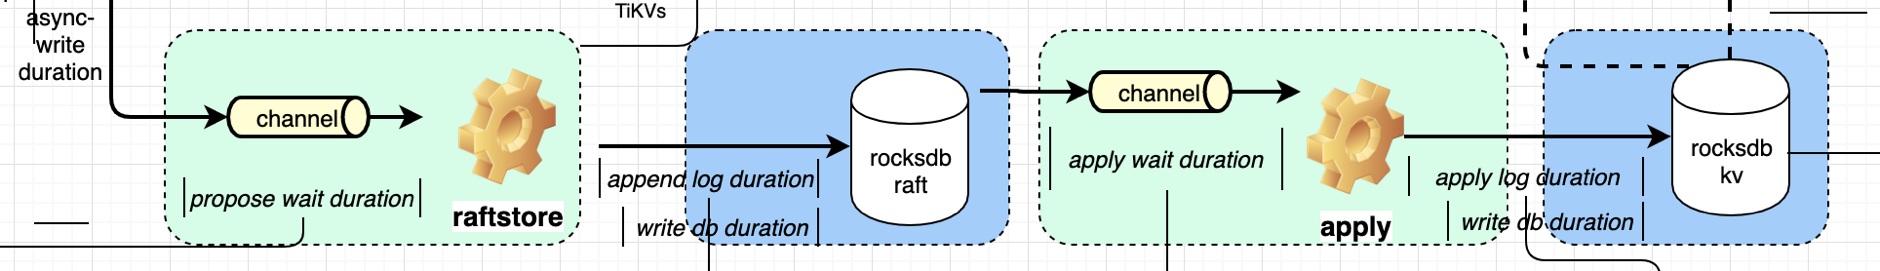
4. Raftstore
上层的请求会发送到 raft 线程池,raft 线程将 raft 日志写入到 Raft RocksDB 并同步给其他 peer,当日志提交之后,apply 线程将数据写入 RocksDB KV,整体流程如下图所示:
4.1 Storage async write duration
async write 包括 raft log 的 propose,append 以及 apply 等关键流程结点。并且 async write 的 duration 的整体耗时是下面 5 个部分的总和:
- Propose wait duration
- Append log duration
- Commit log duration
- Apply wait duration
- Apply log duration
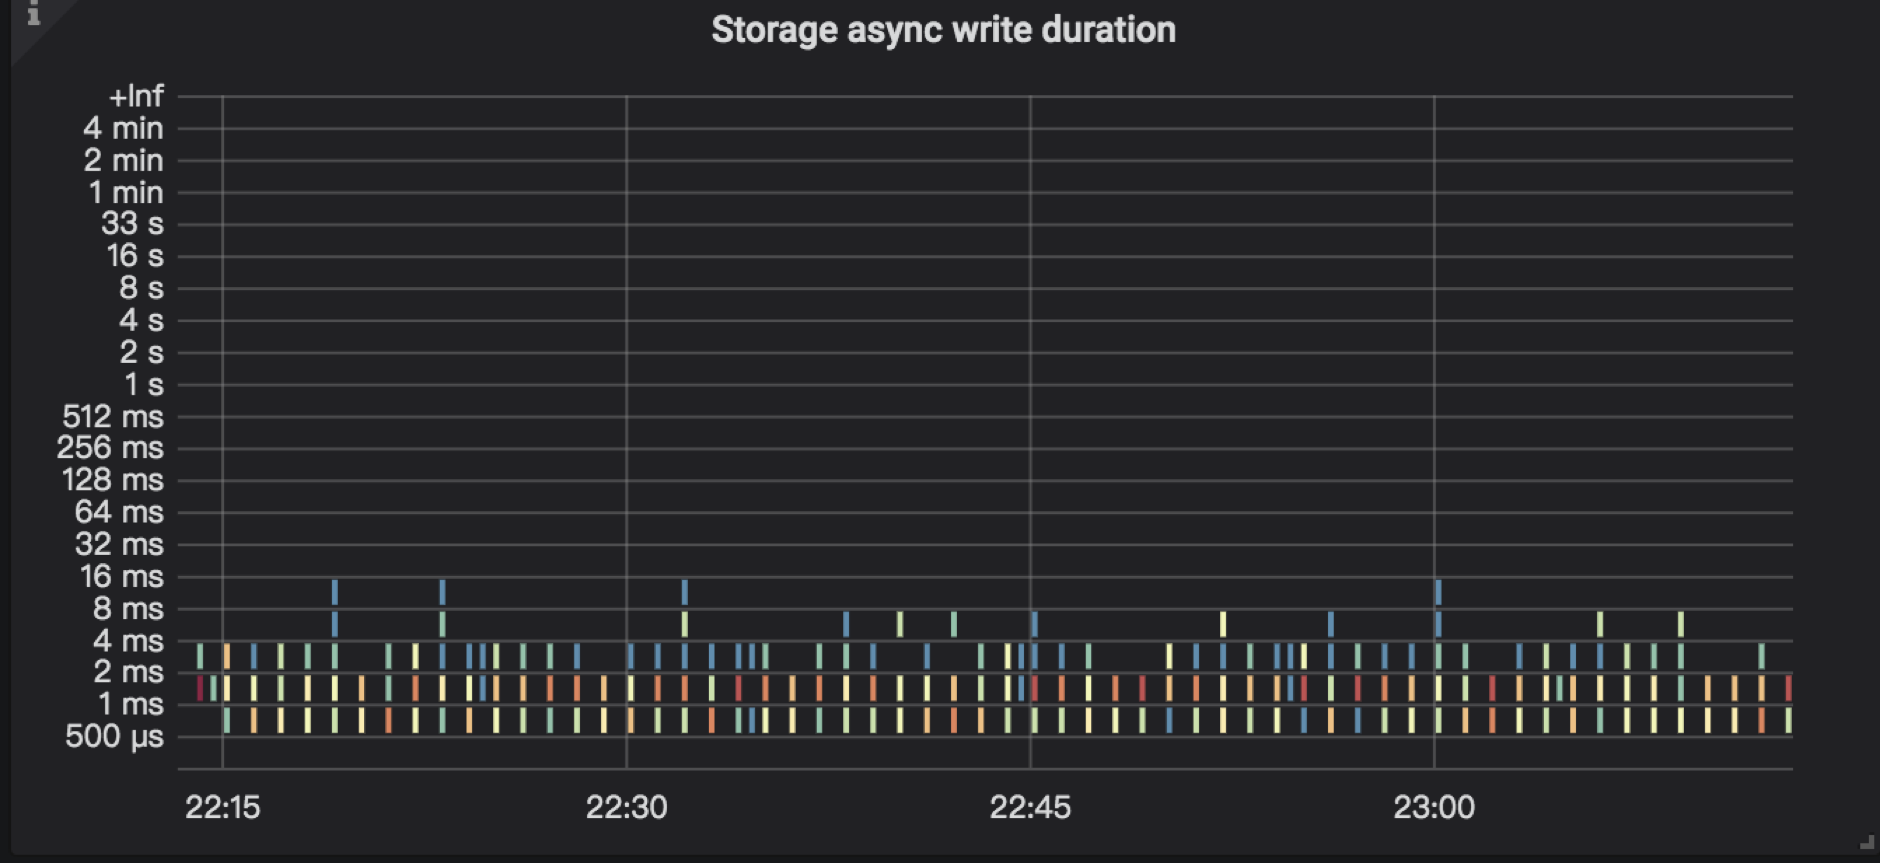
TiKV Details → Storage → Storage async write duration:表示异步写所花费的时间
4.2 Raft store CPU
raftstore 主要负责 Raft 状态机消息的处理,Region 上读写请求的处理、Raft log 的持久化和复制、Raft 的心跳处理等。
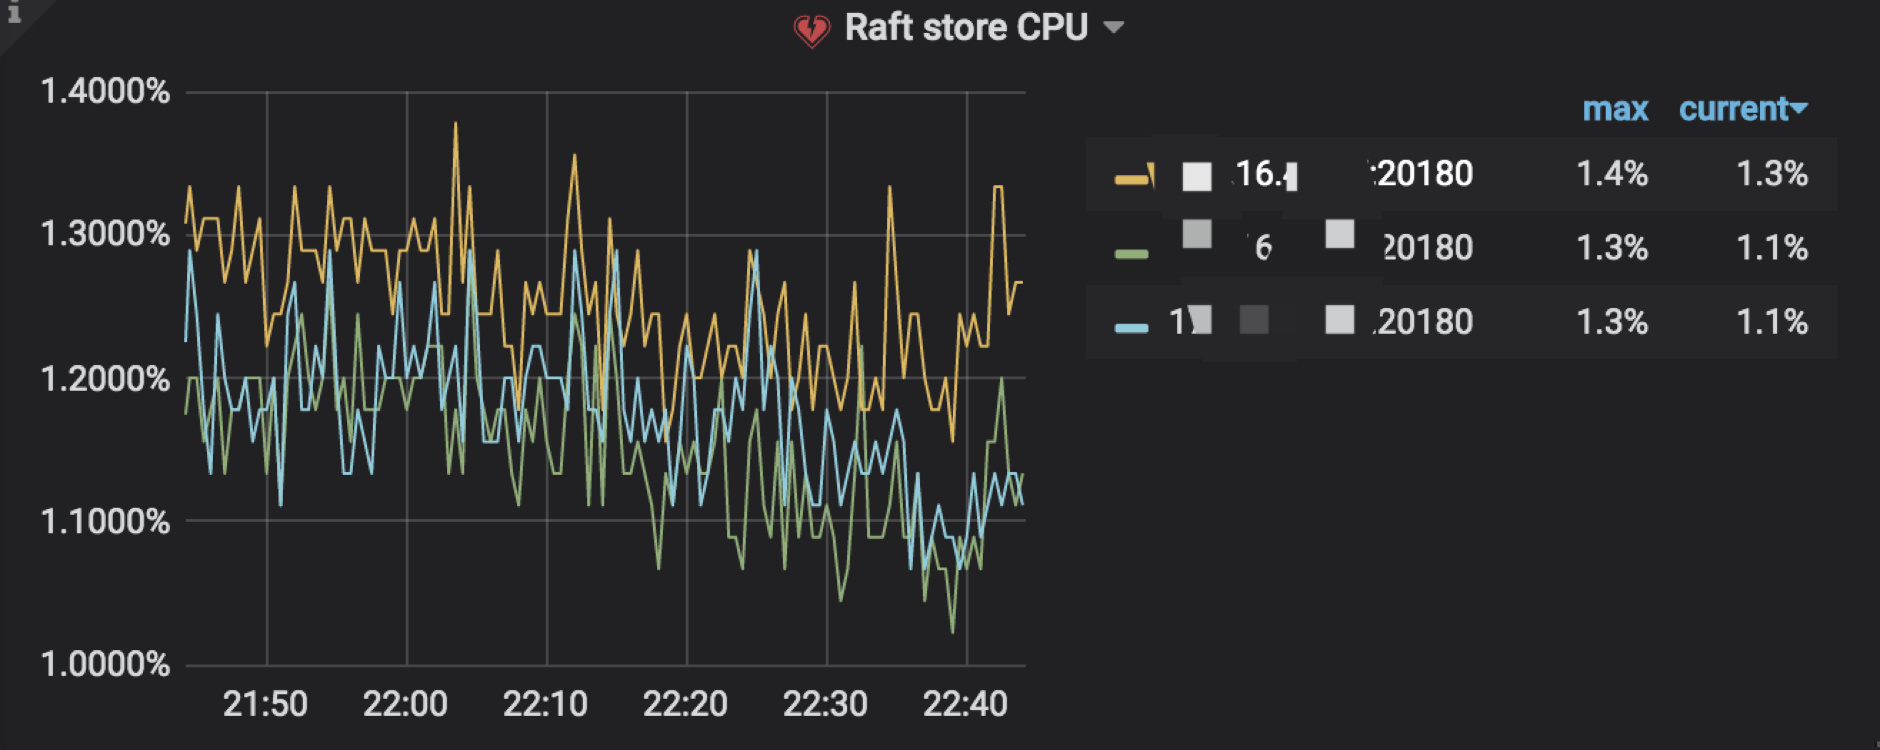
TiKV Details → Thread CPU → Raft store CPU:表示 raftstore 线程的 CPU 使用率,通常应低于 80%:
- 一般情况下,Raft store CPU 在各个 TiKV 节点之间是均衡的状态。如果出现某个 TiKV 节点的 raft CPU 某个时间点或者一个连续的时间段高于其他 TiKV 节点,建议排查热点,文档参考写热点处理文档
- 如果确认是 Raftstore CPU 达到了瓶颈,那么可以参考『海量 Region 集群调优最佳实践』文档进行相应的处理,根据当前集群环境,调整 raftstore 线程数,或开启静默 region 等。
4.3 Propose wait duration
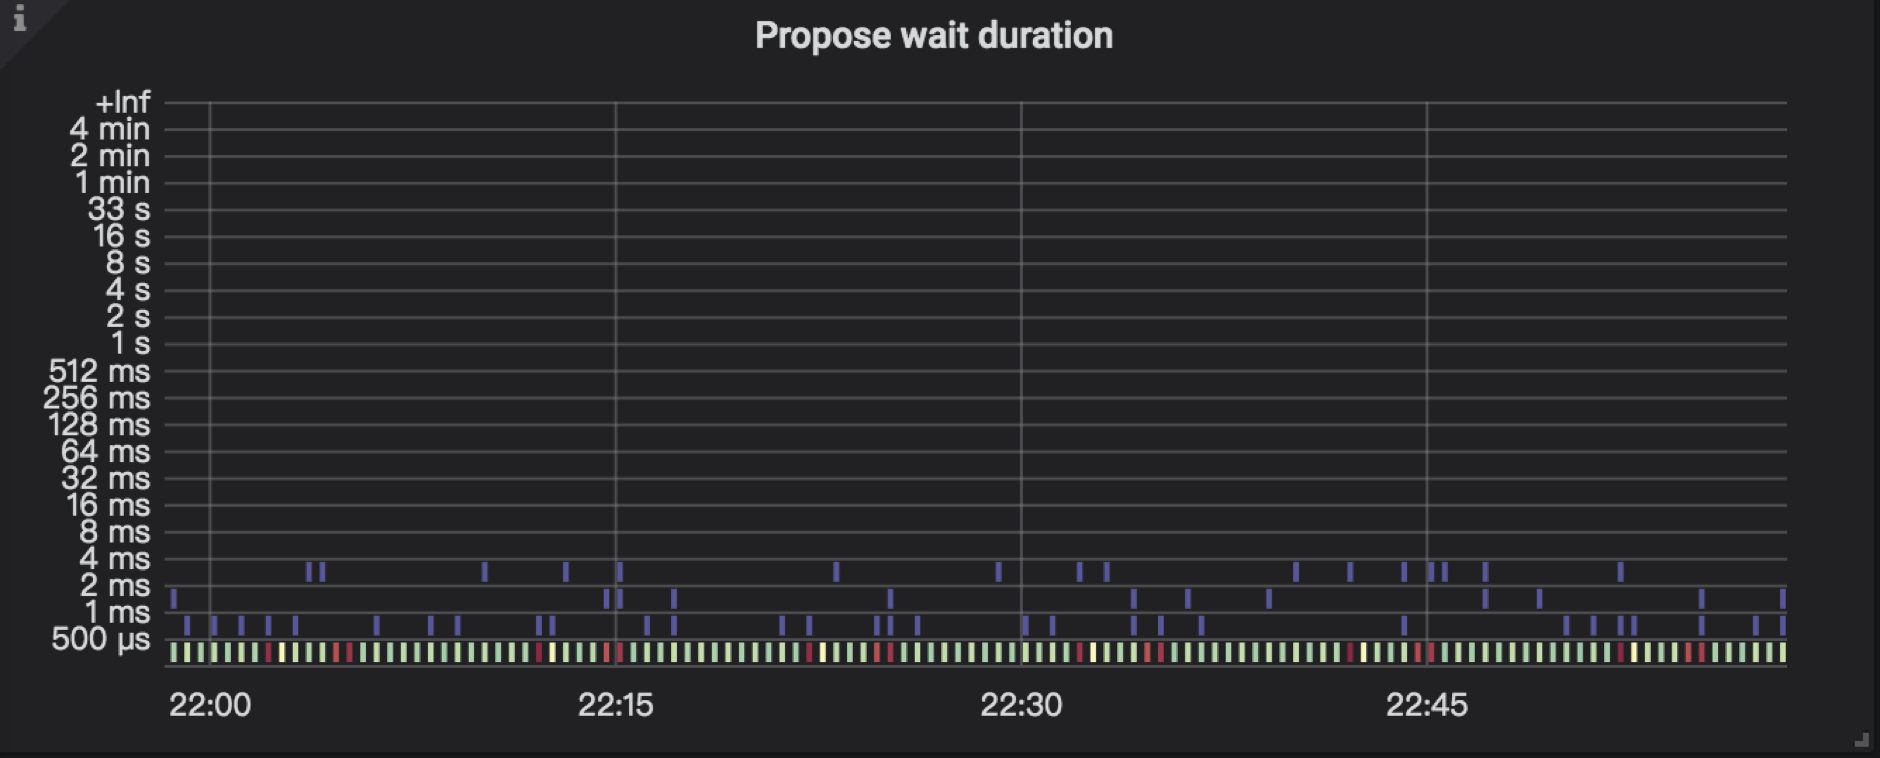
TiKV Details → Raft Propose → Propose wait duration:是从发送请求给 Raftstore,到 Raftstore 真正开始处理请求之间的延迟时间。如果该延迟时间较长:
- Raftstore 比较繁忙如 Raftstore CPU 利用率比较高
- TiKV Details → Thread CPU → Raft store CPU
- 处理 append log 比较耗时导致 Raftstore 不能及时处理请求,此时建议查看 TiKV Details → Raft IO → Append log duration 监控项的具体情况
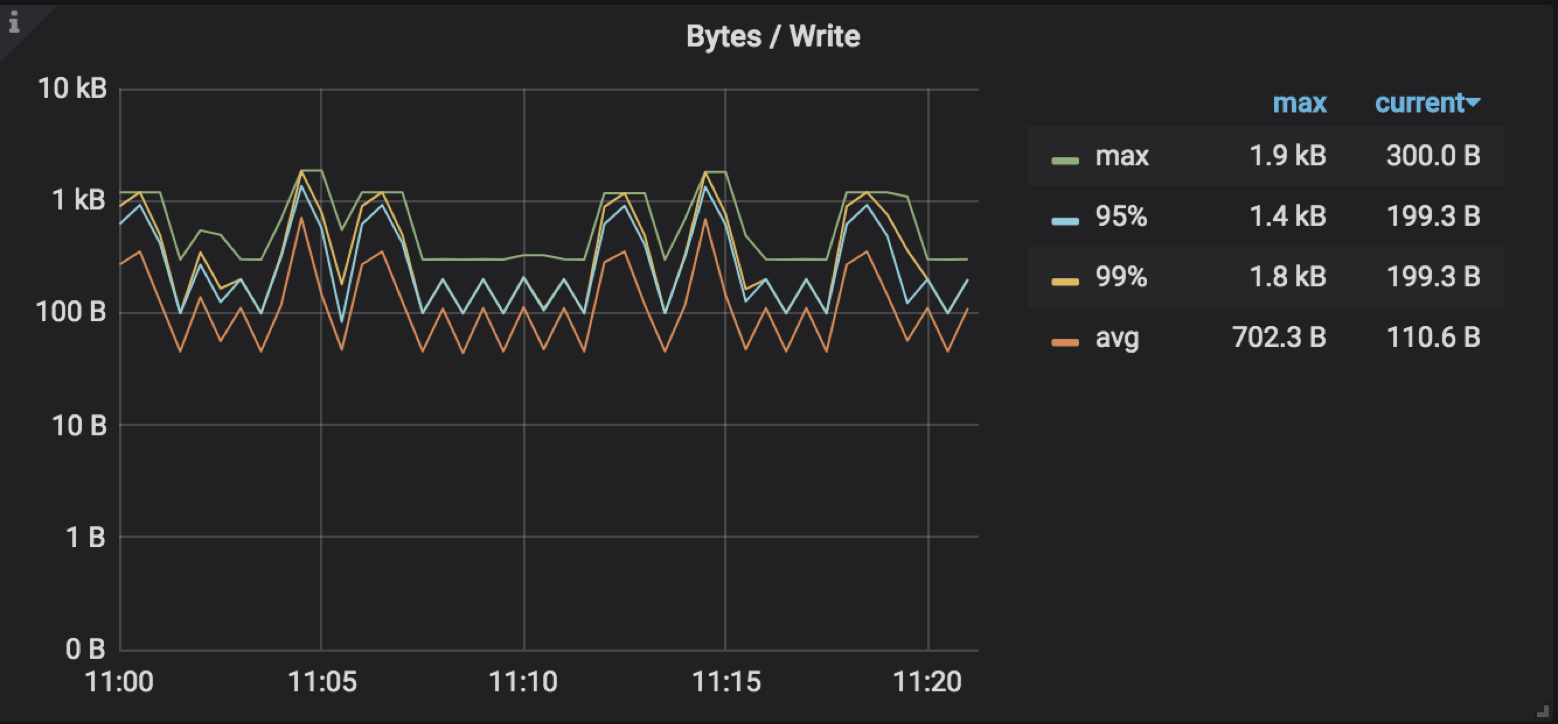
- raftstore batch 过小,也可能出现消息堆积导致线程消费过慢的现象,参数为 raftstore.store-max-batch-size ,如果 TiKV Details → RocksDB raft → Bytes / Write 显示的流量较低,并且 TiKV Details → Thread CPU → Raft store CPU不高,可尝试调大后观察 propose wait duration 是否缓解:
- TiKV Details → Raft Propose → Propose wait duration pre server:表示每个 TiKV 节点 propose 的等待耗时。
4.4 Append log duration
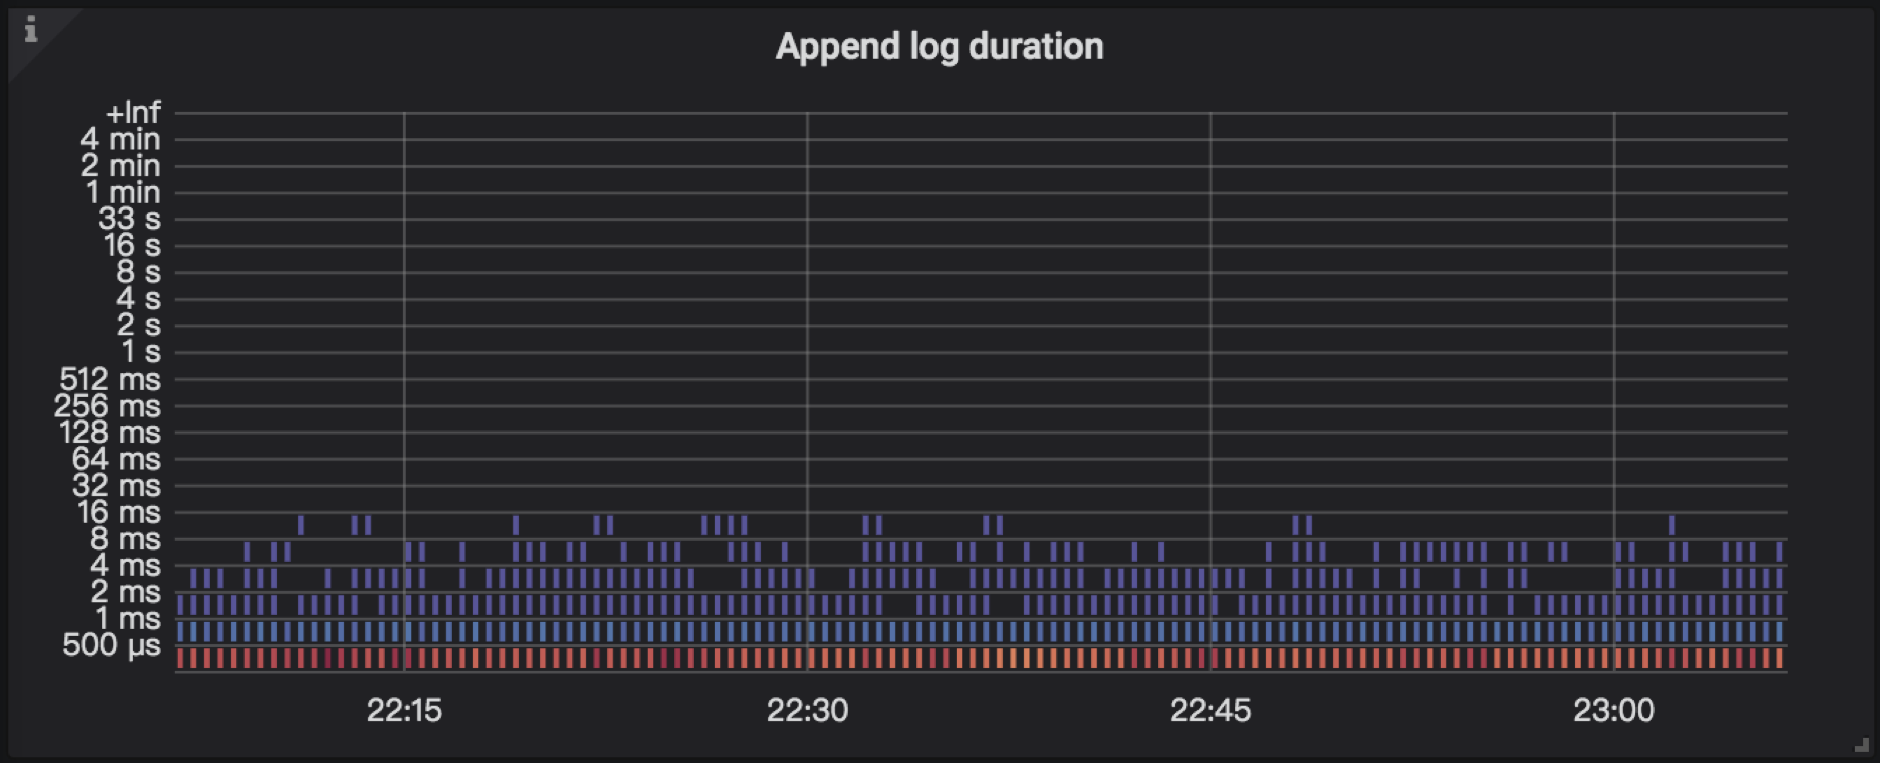
TiKV Details → Raft IO → Append log duration:表示 Raft append 日志所花费的时间,写 raft log 的耗时。如果延时比较高,建议进一步排查 Raft RocksDB 慢的问题,文档参考RocksDB 写入流程
TiKV Details → Raft IO → Append log duration per server:每个 TiKV 实例上 Raft append 日志所花费的时间。
4.5 Async apply CPU
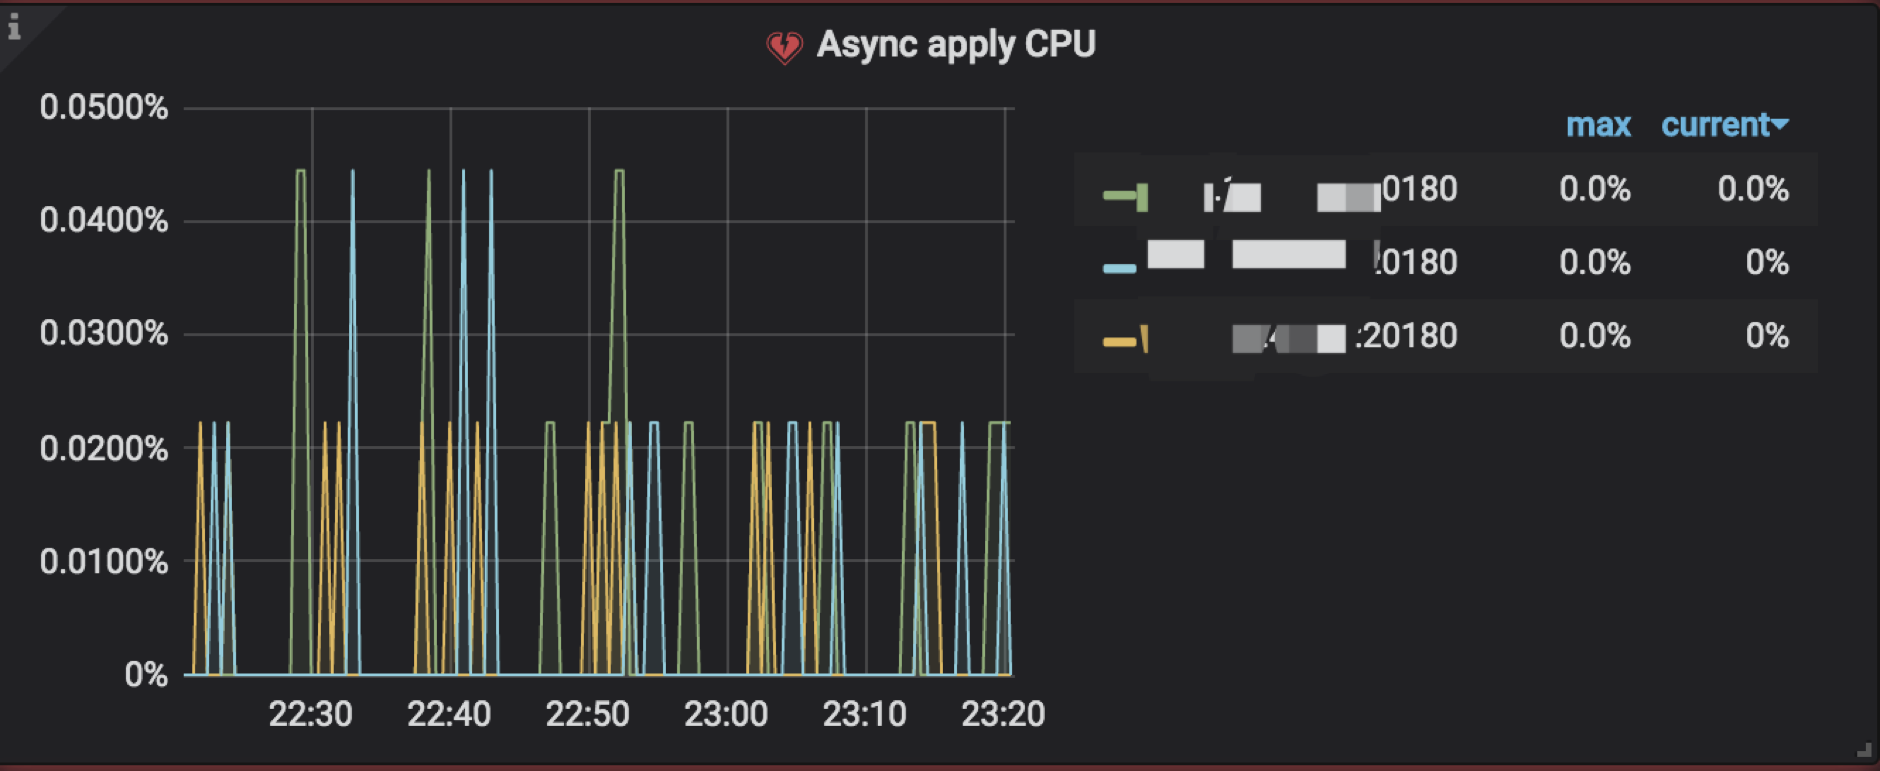
TiKV Details → Thread CPU → Async apply CPU:表示 async apply 线程的 CPU 使用率,通常应低于 90%
4.6 Commit log duration
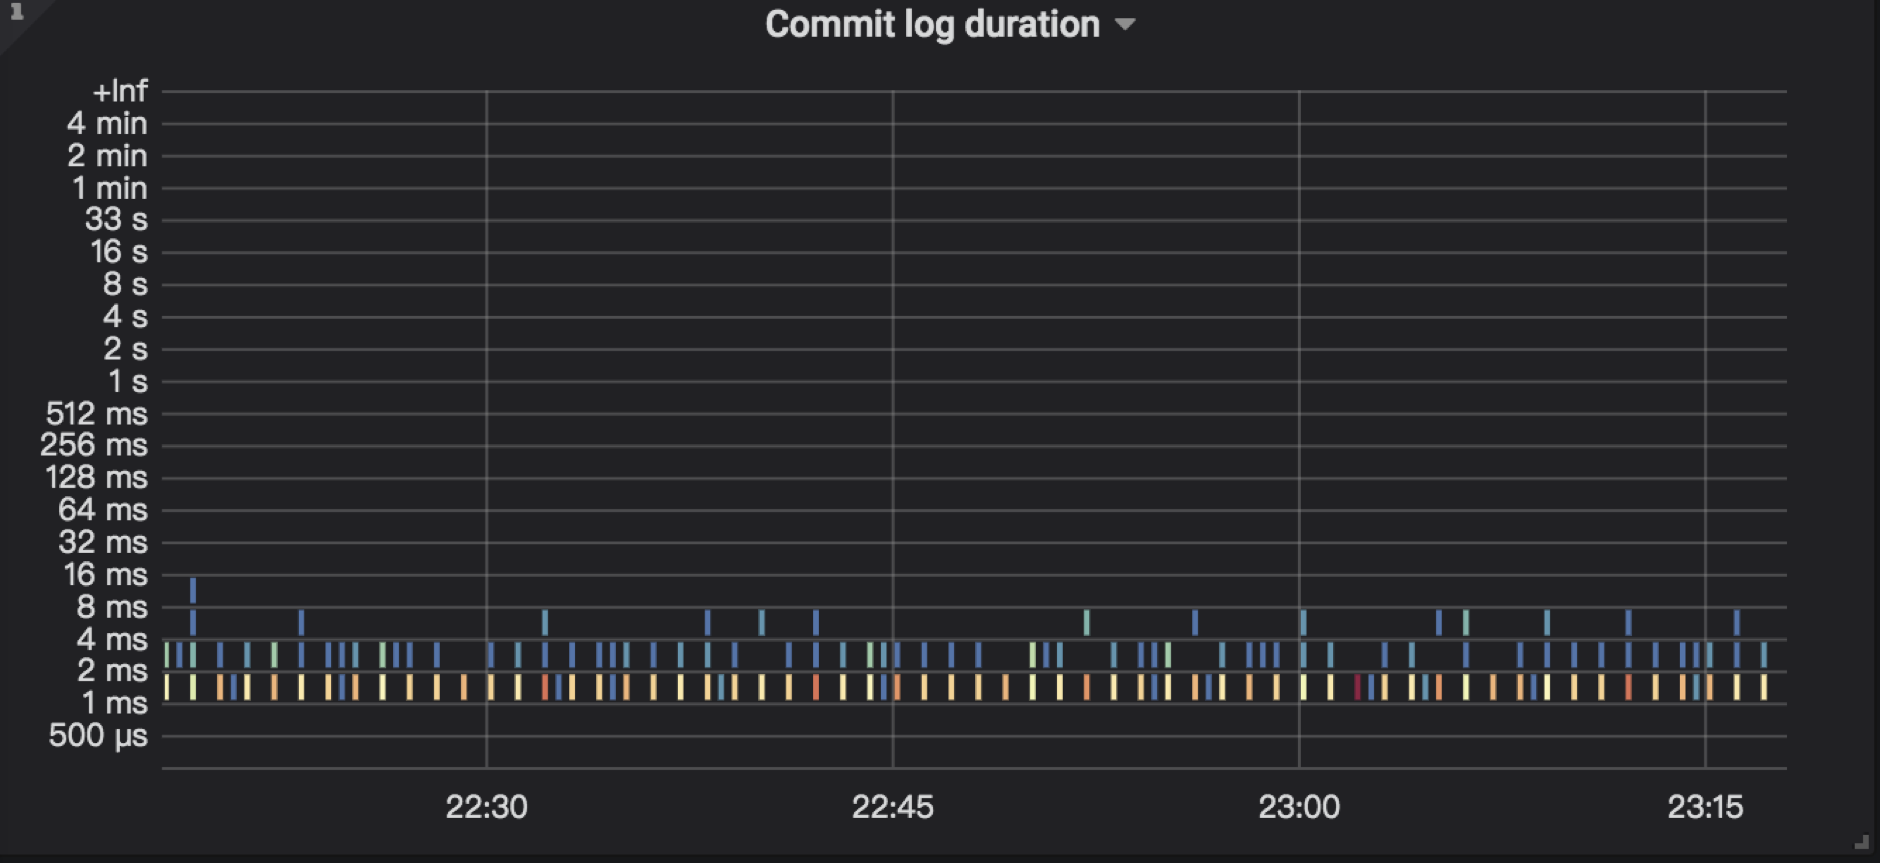
TiKV Details → Raft IO → Commit log duration:Raft commit 日志所花费的时间。
- 一般情况下如果在总的 async write duration 耗时中,commit log duration 耗时占比最高,那么可能是触发了 Raft 流控。
- 每个 Region 对应一个独立的 Raft group,Raft 本身是有流控机制的,类似 TCP 的滑动窗口机制,通过参数
raftstore.raft-max-inflight-msgs = 256 来控制滑动窗口的大小,如果 commit log duration 比较高可以适度调大该参数,比如 1024。
TiKV Details → Raft IO → Commit log duration per server:每个 TiKV 实例上 Raft commit 日志所花费的时间。
4.7 Apply wait duration
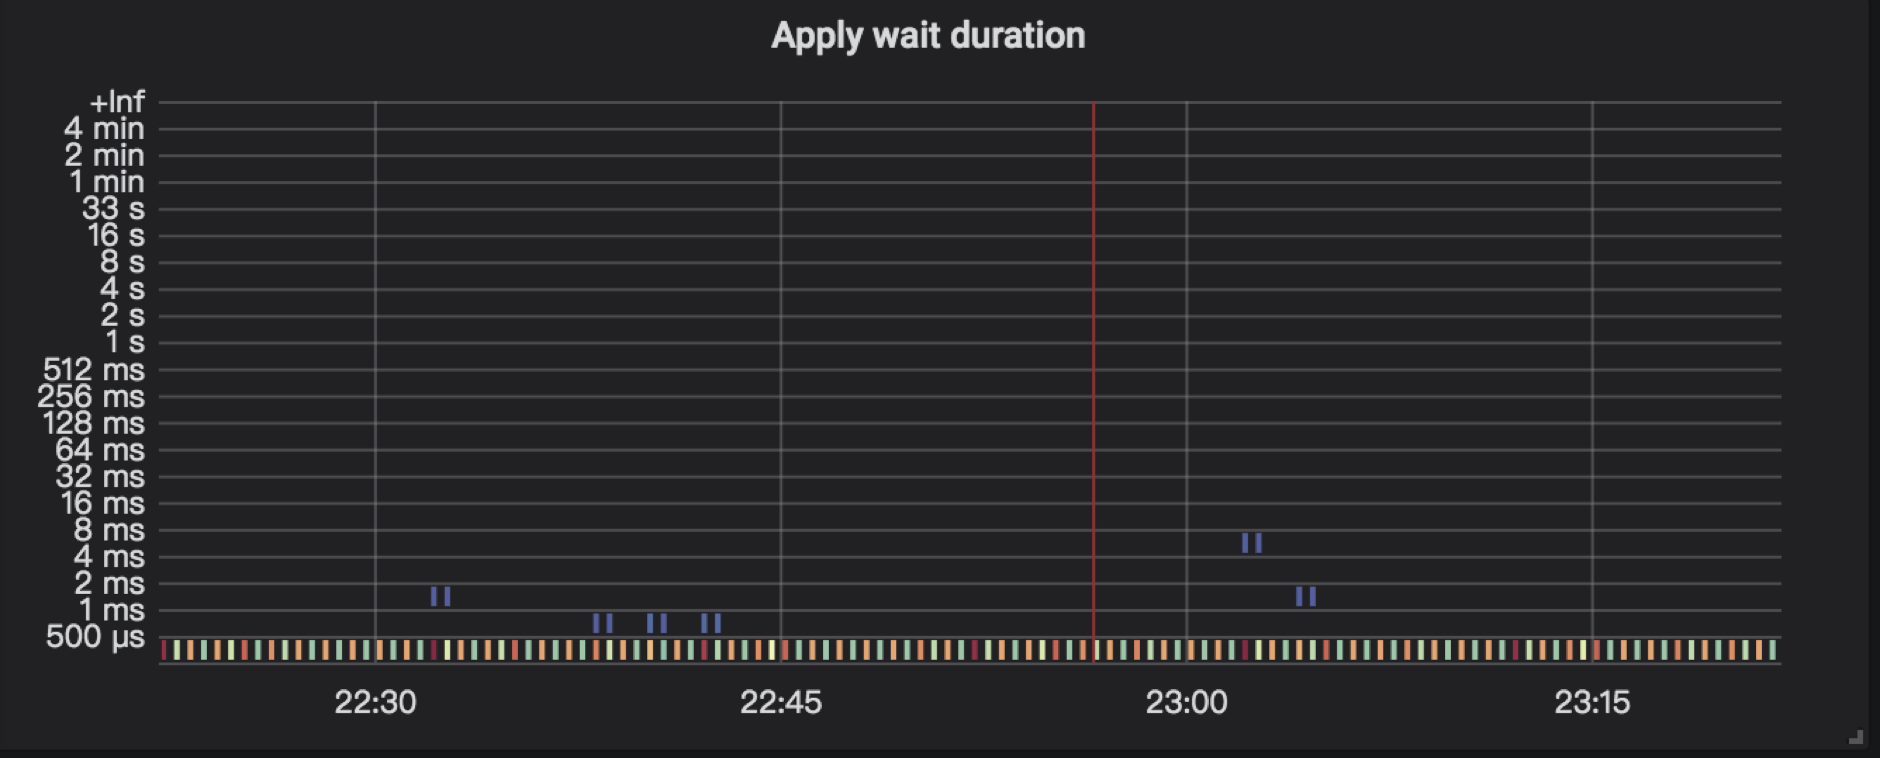
TiKV Details → Raft Propose → Apply wait duration:committed raft log 发送给 apply 线程到 apply 线程真正 apply 这些 log 之间的延迟。
如果该延迟比较高说明 apply 线程比较繁忙,建议排查下面的内容:
-
apply CPU 使用情况
TiKV Details → Thread CPU → Async apply CPU -
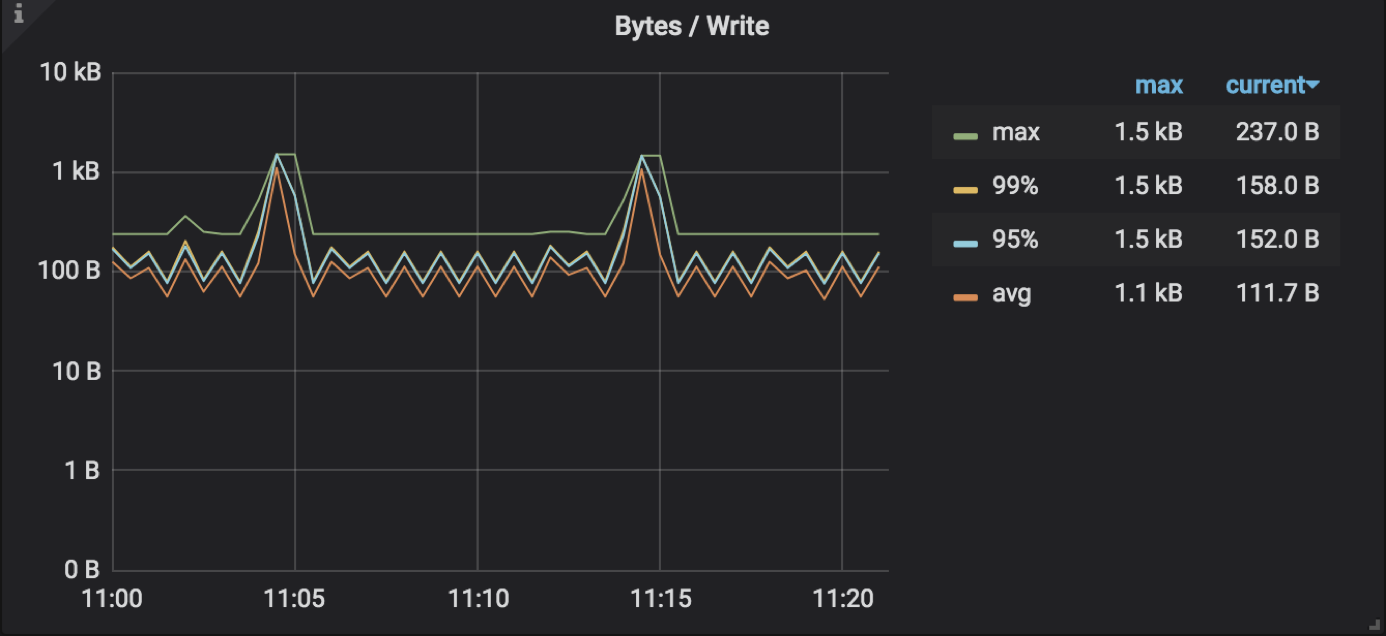
apply batch 过小,也可能出现消息堆积导致 apply 线程消费过慢的问题,对应参数为 raftstore.apply-max-batch-size ,如果 TiKV Details → RocksDB kv → Bytes / Write 显示的流量较低,并且 TiKV Details → Thread CPU → Async apply CPU 使用率也比较低,但是 apply wait duration 比较高,可尝试调大后观察 apply wait duration 是否缓解:
-
磁盘负载导致
Disk - Performance → Disk Latency → write latency ( 该 metrics 默认隐藏,需要显示后查看 )
Disk - Performance → Disk Bandwidth
Disk - Performance → Disk Load
store-pool-size 配置过大,也可能出现消息堆积导致 apply 线程消费过慢的问题。如果配置了 store-pool-size 较大值,apply pool 使用默认值,从 store pool 产生待 apply 任务速度较快,在 apply pool 侧容易堆积较多,增加了 apply 的延时。可尝试调大 apply-pool-size 。可根据以下监控判断:

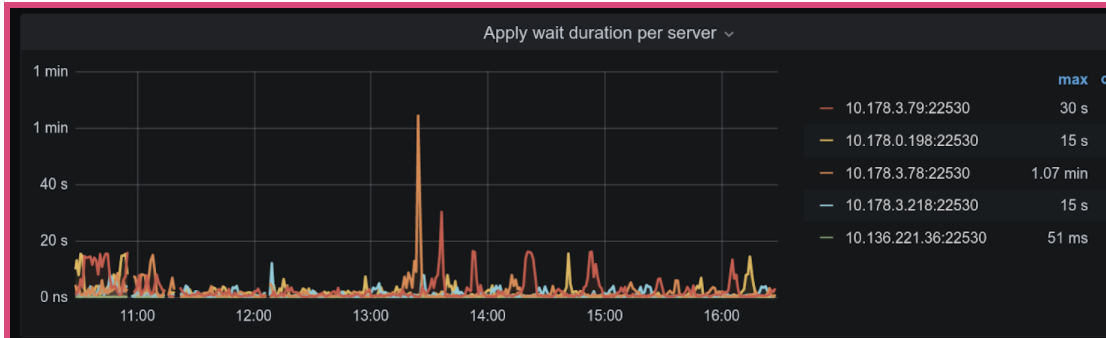
TiKV Details → Raft Propose → Apply wait duration per server:表示每个 TiKV 节点 apply wait 的耗时。
4.8 Apply log duration
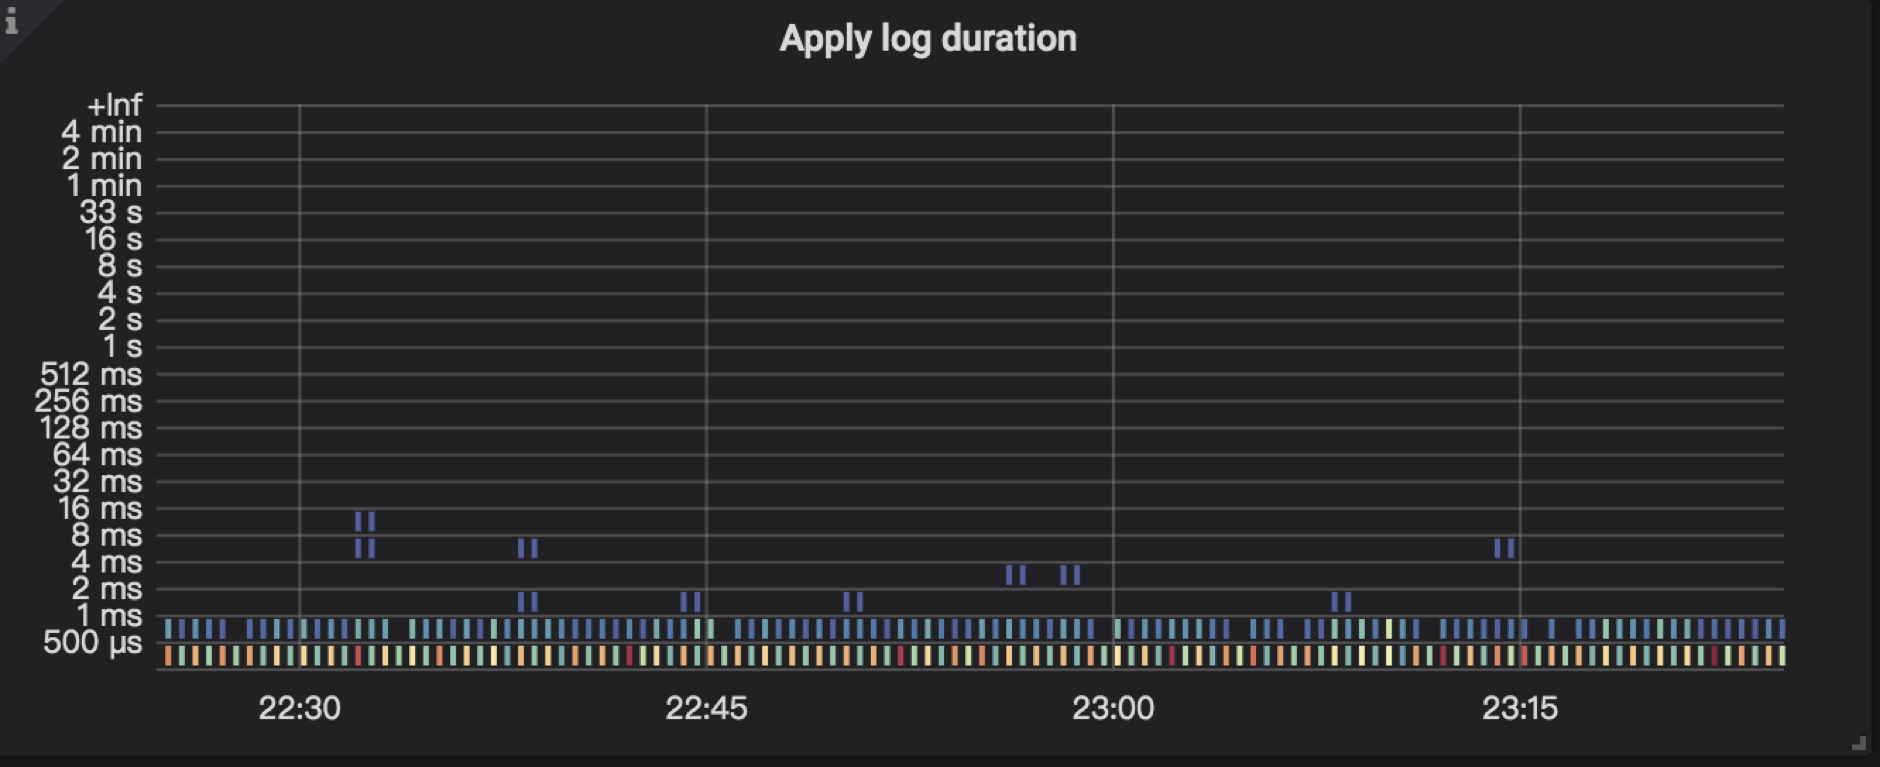
TiKV Details → Raft IO → Apply log duration:Raft apply 日志所花费的时间,执行 raft log ,把用户数据写入到 RocksDB KV 的耗时。
TiKV Details → Raft IO → Apply log duration per server:每个 TiKV 实例上 Raft apply 日志所花费的时间。