升级后,mysql同步tidb报错,Error 1105: unexpected resolve err

为提高效率,提问时请提供以下信息,问题描述清晰可优先响应。

  • 【TiDB 版本】:V4.0.1
  • 【问题描述】:3.0.8版本升级后与mysql的实时同步任务报错
    同步工具暂时还没有使用DM,目前使用的是syncer

[error]Error 1105: unexpected resolve err: abort:“Txn(Mvcc(Committed { commit_ts: TimeStamp(417774318718287874) }))” , lock: key: {tableID=203981, indexID=1, indexValues={2016072341, 878478713831435, 1076969683009595, }}, primary: {tableID=203747, indexID=1, indexValues={2016072341, 790180799627267, 1078413860306945, }}, txnStartTS: 417774318325071877, lockForUpdateTS:0, ttl: 4126, type: Put

2020/07/02 17:35:54 syncer.go:507: [fatal] [error rows event] Error 1105: unexpected resolve err: abort:“Txn(Mvcc(Committed { commit_ts: TimeStamp(417774318718287874) }))” , lock: key: {tableID=203981, indexID=1, indexValues={2016072341, 878478713831435, 1076969683009595, }}, primary: {tableID=203747, indexID=1, indexValues={2016072341, 790180799627267, 1078413860306945, }}, txnStartTS: 417774318325071877, lockForUpdateTS:0, ttl: 4126, type: Put

/home/jenkins/agent/workspace/build_tidb_enterprise_tools_master/go/src/github.com/pingcap/tidb-enterprise-tools/syncer/db.go:150:

/home/jenkins/agent/workspace/build_tidb_enterprise_tools_master/go/src/github.com/pingcap/tidb-enterprise-tools/syncer/db.go:117:

若提问为性能优化、故障排查类问题,请下载脚本运行。终端输出的打印结果,请务必全选并复制粘贴上传。

此问题,可以升级到 4.0.2 解决,多谢。

好的,一会儿再升级下,前天刚升到4.0.1,使用TiUP可以拉取4.0.2版本了么

可以拉取的

升级完成后有两个KV节点Disconnected,10.0.0.12:20160 && 10.0.0.7:20160
10.0.0.7:20160这个使用命令“tiup cluster start qingzhu-tidb-cluster -N 10.0.0.7:20160”
手动启动了一次,起来了

10.0.0.12:20160节点重试了好几次也没起来,过了一会儿才自动起来

稍后奉上三个KV节点的日志

三个KV节点日志

链接:百度网盘-链接不存在 密码:p9vn

稍等,问题已经在看。

通过扩容的方式增加了两个tiflash节点,跟其中两个kv部署在同一个节点了,结果两个都没起来,依然使用了手动启动的方式才变成UP状态

安装记录如下:
[tidb@TIDB_002-3 ~]$ tiup cluster scale-out qingzhu-tidb-cluster /home/tidb/tmp_tidb_yaml/scale-out-tiflash.yaml
Starting component cluster: /home/tidb/.tiup/components/cluster/v1.0.7/tiup-cluster scale-out qingzhu-tidb-cluster /home/tidb/tmp_tidb_yaml/scale-out-tiflash.yaml
Please confirm your topology:
TiDB Cluster: qingzhu-tidb-cluster
TiDB Version: v4.0.2
Type Host Ports OS/Arch Directories


tiflash 10.0.0.6 9000/8123/3930/20170/20292/8234 linux/x86_64 /export/tidb-deploy/tiflash-9000,/export/tidb-data/tiflash-9000
tiflash 10.0.0.12 9000/8123/3930/20170/20292/8234 linux/x86_64 /export/tidb-deploy/tiflash-9000,/export/tidb-data/tiflash-9000
Attention:
1. If the topology is not what you expected, check your yaml file.
2. Please confirm there is no port/directory conflicts in same host.
Do you want to continue? [y/N]: y

  • [ Serial ] - SSHKeySet: privateKey=/home/tidb/.tiup/storage/cluster/clusters/qingzhu-tidb-cluster/ssh/id_rsa, publicKey=/home/tidb/.tiup/storage/cluster/clusters/qingzhu-tidb-cluster/ssh/id_rsa.pub
    • Download tiflash:v4.0.2 (linux/amd64) … Done
  • [Parallel] - UserSSH: user=tidb, host=10.0.2.8
  • [Parallel] - UserSSH: user=tidb, host=10.0.2.8
  • [Parallel] - UserSSH: user=tidb, host=10.0.0.12
  • [Parallel] - UserSSH: user=tidb, host=10.0.0.14
  • [Parallel] - UserSSH: user=tidb, host=10.0.0.3
  • [Parallel] - UserSSH: user=tidb, host=10.0.0.19
  • [Parallel] - UserSSH: user=tidb, host=10.0.2.8
  • [Parallel] - UserSSH: user=tidb, host=10.0.0.19
  • [Parallel] - UserSSH: user=tidb, host=10.0.0.3
  • [Parallel] - UserSSH: user=tidb, host=10.0.0.14
  • [Parallel] - UserSSH: user=tidb, host=10.0.0.7
  • [Parallel] - UserSSH: user=tidb, host=10.0.0.6
  • [ Serial ] - UserSSH: user=tidb, host=10.0.0.12
  • [ Serial ] - Mkdir: host=10.0.0.12, directories=‘/export/tidb-deploy/tiflash-9000’,‘/export/tidb-deploy/tiflash-9000/log’,‘/export/tidb-deploy/tiflash-9000/bin’,‘/export/tidb-deploy/tiflash-9000/conf’,‘/export/tidb-deploy/tiflash-9000/scripts’
  • [ Serial ] - UserSSH: user=tidb, host=10.0.0.6
  • [ Serial ] - Mkdir: host=10.0.0.6, directories=‘/export/tidb-deploy/tiflash-9000’,‘/export/tidb-deploy/tiflash-9000/log’,‘/export/tidb-deploy/tiflash-9000/bin’,‘/export/tidb-deploy/tiflash-9000/conf’,‘/export/tidb-deploy/tiflash-9000/scripts’
  • [ Serial ] - Mkdir: host=10.0.0.12, directories=‘/export/tidb-data/tiflash-9000’
  • [ Serial ] - Mkdir: host=10.0.0.6, directories=‘/export/tidb-data/tiflash-9000’
  • [ Serial ] - CopyComponent: component=tiflash, version=v4.0.2, remote=10.0.0.12:/export/tidb-deploy/tiflash-9000 os=linux, arch=amd64
  • [ Serial ] - CopyComponent: component=tiflash, version=v4.0.2, remote=10.0.0.6:/export/tidb-deploy/tiflash-9000 os=linux, arch=amd64
  • [ Serial ] - ScaleConfig: cluster=qingzhu-tidb-cluster, user=tidb, host=10.0.0.6, service=tiflash-9000.service, deploy_dir=/export/tidb-deploy/tiflash-9000, data_dir=[/export/tidb-data/tiflash-9000], log_dir=/export/tidb-deploy/tiflash-9000/log, cache_dir=
  • [ Serial ] - ScaleConfig: cluster=qingzhu-tidb-cluster, user=tidb, host=10.0.0.12, service=tiflash-9000.service, deploy_dir=/export/tidb-deploy/tiflash-9000, data_dir=[/export/tidb-data/tiflash-9000], log_dir=/export/tidb-deploy/tiflash-9000/log, cache_dir=
  • [ Serial ] - ClusterOperate: operation=StartOperation, options={Roles:[] Nodes:[] Force:false SSHTimeout:0 OptTimeout:60 APITimeout:0 IgnoreConfigCheck:false RetainDataRoles:[] RetainDataNodes:[]}
    Starting component pd
    Starting instance pd 10.0.0.19:2379
    Starting instance pd 10.0.0.3:2379
    Starting instance pd 10.0.0.14:2379
    Start pd 10.0.0.19:2379 success
    Start pd 10.0.0.3:2379 success
    Start pd 10.0.0.14:2379 success
    Starting component node_exporter
    Starting instance 10.0.0.3
    Start 10.0.0.3 success
    Starting component blackbox_exporter
    Starting instance 10.0.0.3
    Start 10.0.0.3 success
    Starting component node_exporter
    Starting instance 10.0.0.14
    Start 10.0.0.14 success
    Starting component blackbox_exporter
    Starting instance 10.0.0.14
    Start 10.0.0.14 success
    Starting component node_exporter
    Starting instance 10.0.0.19
    Start 10.0.0.19 success
    Starting component blackbox_exporter
    Starting instance 10.0.0.19
    Start 10.0.0.19 success
    Starting component tikv
    Starting instance tikv 10.0.0.6:20160
    Starting instance tikv 10.0.0.12:20160
    Starting instance tikv 10.0.0.7:20160
    Start tikv 10.0.0.7:20160 success
    Start tikv 10.0.0.6:20160 success
    Start tikv 10.0.0.12:20160 success
    Starting component node_exporter
    Starting instance 10.0.0.12
    Start 10.0.0.12 success
    Starting component blackbox_exporter
    Starting instance 10.0.0.12
    Start 10.0.0.12 success
    Starting component node_exporter
    Starting instance 10.0.0.7
    Start 10.0.0.7 success
    Starting component blackbox_exporter
    Starting instance 10.0.0.7
    Start 10.0.0.7 success
    Starting component node_exporter
    Starting instance 10.0.0.6
    Start 10.0.0.6 success
    Starting component blackbox_exporter
    Starting instance 10.0.0.6
    Start 10.0.0.6 success
    Starting component tidb
    Starting instance tidb 10.0.0.14:4000
    Starting instance tidb 10.0.0.3:4000
    Starting instance tidb 10.0.0.19:4000
    Start tidb 10.0.0.19:4000 success
    Start tidb 10.0.0.14:4000 success
    Start tidb 10.0.0.3:4000 success
    Starting component prometheus
    Starting instance prometheus 10.0.2.8:9090
    Start prometheus 10.0.2.8:9090 success
    Starting component node_exporter
    Starting instance 10.0.2.8
    Start 10.0.2.8 success
    Starting component blackbox_exporter
    Starting instance 10.0.2.8
    Start 10.0.2.8 success
    Starting component grafana
    Starting instance grafana 10.0.2.8:3000
    Start grafana 10.0.2.8:3000 success
    Starting component alertmanager
    Starting instance alertmanager 10.0.2.8:9093
    Start alertmanager 10.0.2.8:9093 success
    Checking service state of pd
    10.0.0.19 Active: active (running) since Thu 2020-07-02 06:23:58 EDT; 1 day 1h ago
    10.0.0.3 Active: active (running) since Thu 2020-07-02 06:23:56 EDT; 1 day 1h ago
    10.0.0.14 Active: active (running) since Thu 2020-07-02 06:23:57 EDT; 1 day 1h ago
    Checking service state of tikv
    10.0.0.12 Active: active (running) since Thu 2020-07-02 06:24:14 EDT; 1 day 1h ago
    10.0.0.6 Active: active (running) since Thu 2020-07-02 06:25:36 EDT; 1 day 1h ago
    10.0.0.7 Active: active (running) since Thu 2020-07-02 06:25:03 EDT; 1 day 1h ago
    Checking service state of tidb
    10.0.0.19 Active: active (running) since Thu 2020-07-02 06:26:06 EDT; 1 day 1h ago
    10.0.0.3 Active: active (running) since Thu 2020-07-02 06:26:23 EDT; 1 day 1h ago
    10.0.0.14 Active: active (running) since Thu 2020-07-02 06:26:28 EDT; 1 day 1h ago
    Checking service state of prometheus
    10.0.2.8 Active: active (running) since Thu 2020-07-02 18:26:29 CST; 1 day 1h ago
    Checking service state of grafana
    10.0.2.8 Active: active (running) since Thu 2020-07-02 18:26:30 CST; 1 day 1h ago
    Checking service state of alertmanager
    10.0.2.8 Active: active (running) since Thu 2020-07-02 18:26:31 CST; 1 day 1h ago
  • [Parallel] - UserSSH: user=tidb, host=10.0.0.12
  • [Parallel] - UserSSH: user=tidb, host=10.0.0.6
  • [ Serial ] - save meta
  • [ Serial ] - ClusterOperate: operation=StartOperation, options={Roles:[] Nodes:[] Force:false SSHTimeout:0 OptTimeout:60 APITimeout:0 IgnoreConfigCheck:false RetainDataRoles:[] RetainDataNodes:[]}
    Starting component tiflash
    Starting instance tiflash 10.0.0.12:9000
    Starting instance tiflash 10.0.0.6:9000
    retry error: operation timed out after 1m0s
    tiflash 10.0.0.12:9000 failed to start: timed out waiting for port 9000 to be started after 1m0s, please check the log of the instance
    retry error: operation timed out after 1m0s
    tiflash 10.0.0.6:9000 failed to start: timed out waiting for port 9000 to be started after 1m0s, please check the log of the instance

Error: failed to start: failed to start tiflash: tiflash 10.0.0.12:9000 failed to start: timed out waiting for port 9000 to be started after 1m0s, please check the log of the instance: timed out waiting for port 9000 to be started after 1m0s

Verbose debug logs has been written to /home/tidb/logs/tiup-cluster-debug-2020-07-03-07-55-24.log.
Error: run /home/tidb/.tiup/components/cluster/v1.0.7/tiup-cluster (wd:/home/tidb/.tiup/data/S3g5qA1) failed: exit status 1

日志如下:
tiup-cluster-debug-2020-07-03-07-55-24.log (235.4 KB)

根据这里给出的信息:failed to start tiflash: tiflash 10.0.0.12:9000 failed to start: timed out waiting for port 9000 to be started after 1m0s 建议去 TiFlash 的部署节点看下具体的报错,具体看下 tiflash.log 信息。

因为跟TiKV部署在同一个节点以后导致kv的服务器内存打到了90%,担心会影响正常的KV业务,所以通过所容操作tiflash下线,但是下线操作也报错

然后最近通过dashboard查看KV日志,报错也挺多,是因为升级导致的么?

反馈下 pd ctl store 的信息,看下 tiflash 和 tikv 的状态。

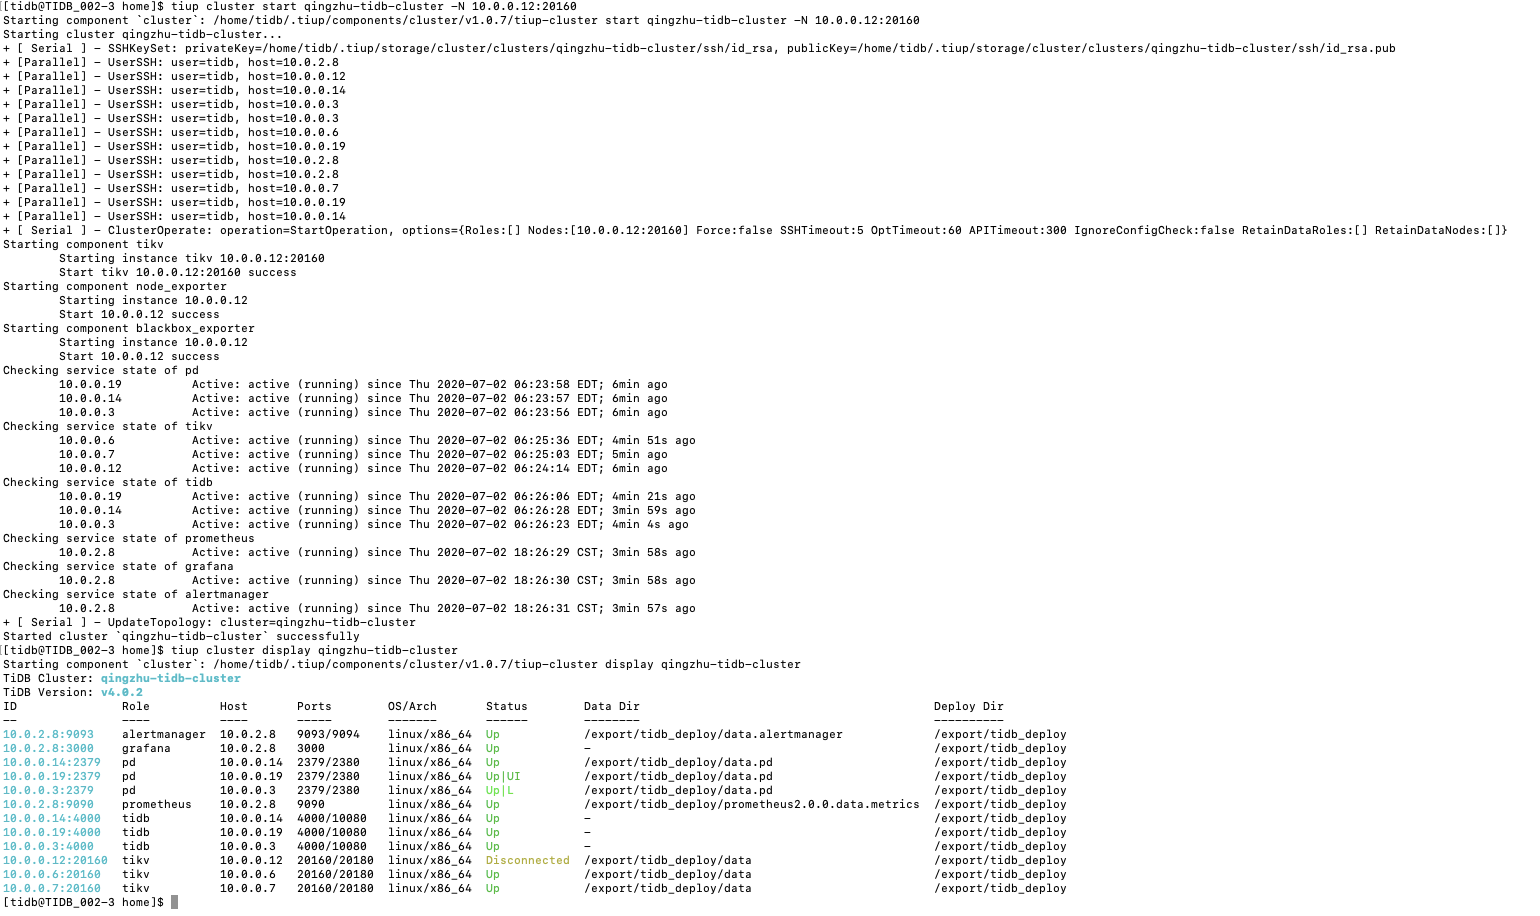
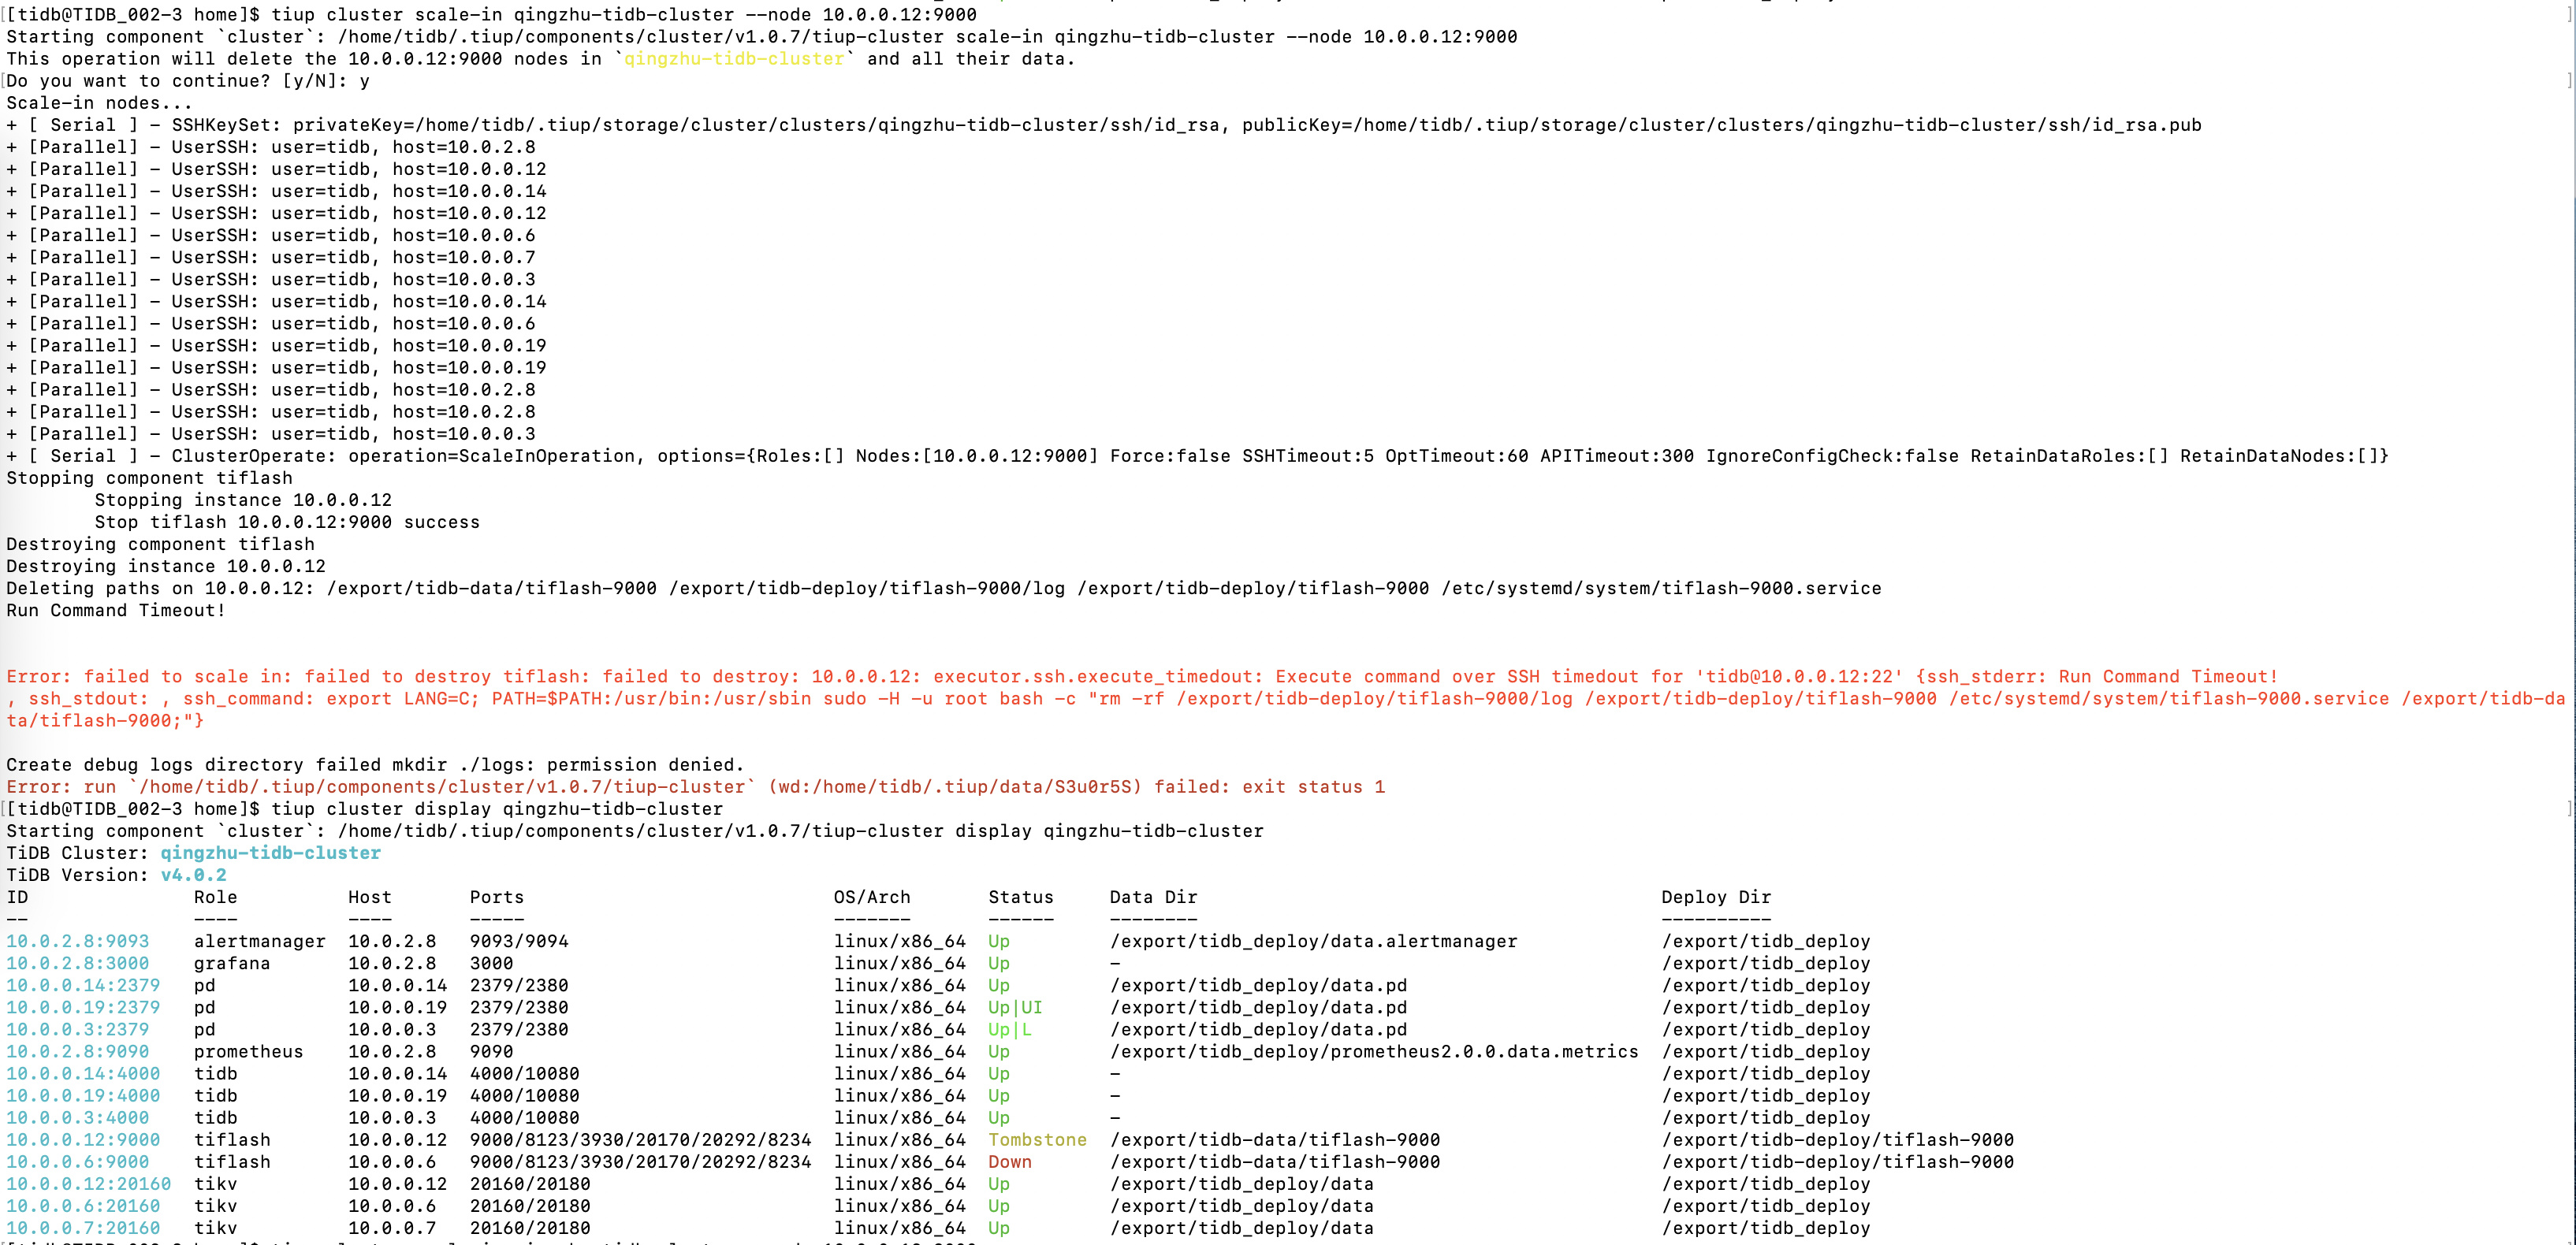
[tidb@TIDB_002-3 ~]$ tiup ctl pd -u 10.0.0.14:2379 store
The component ctl is not installed; downloading from repository.
download https://tiup-mirrors.pingcap.com/ctl-v4.0.2-linux-amd64.tar.gz 166.99 MiB / 166.99 MiB 100.00% 5.59 MiB p/s
Starting component ctl: /home/tidb/.tiup/components/ctl/v4.0.2/ctl pd -u 10.0.0.14:2379 store
{
“count”: 5,
“stores”: [
{
“store”: {
“id”: 5,
“address”: “10.0.0.12:20160”,
“version”: “4.0.2”,
“status_address”: “10.0.0.12:20180”,
“git_hash”: “98ee08c587ab47d9573628aba6da741433d8855c”,
“start_timestamp”: 1593685461,
“last_heartbeat”: 1594017836159507554,
“state_name”: “Up”
},
“status”: {
“capacity”: “5.73TiB”,
“available”: “5.163TiB”,
“used_size”: “549GiB”,
“leader_count”: 69715,
“leader_weight”: 1,
“leader_score”: 69715,
“leader_size”: 1315015,
“region_count”: 209140,
“region_weight”: 1,
“region_score”: 4048740,
“region_size”: 4048740,
“start_ts”: “2020-07-02T06:24:21-04:00”,
“last_heartbeat_ts”: “2020-07-06T02:43:56.159507554-04:00”,
“uptime”: “92h19m35.159507554s”
}
},
{
“store”: {
“id”: 1163985,
“address”: “10.0.0.14:3930”,
“labels”: [
{
“key”: “engine”,
“value”: “tiflash”
}
],
“version”: “v4.0.2”,
“peer_address”: “10.0.0.14:20170”,
“status_address”: “10.0.0.14:20292”,
“git_hash”: “8dee36744ae9ecfe9dda0522fef1634e37d23e87”,
“start_timestamp”: 1594008333,
“deploy_path”: “/export/tidb-deploy/tiflash-9000/bin/tiflash”,
“last_heartbeat”: 1594017834839864003,
“state_name”: “Up”
},
“status”: {
“capacity”: “728.6GiB”,
“available”: “656GiB”,
“used_size”: “14.94MiB”,
“leader_count”: 0,
“leader_weight”: 1,
“leader_score”: 0,
“leader_size”: 0,
“region_count”: 0,
“region_weight”: 1,
“region_score”: 0,
“region_size”: 0,
“start_ts”: “2020-07-06T00:05:33-04:00”,
“last_heartbeat_ts”: “2020-07-06T02:43:54.839864003-04:00”,
“uptime”: “2h38m21.839864003s”
}
},
{
“store”: {
“id”: 1163986,
“address”: “10.0.0.3:3930”,
“labels”: [
{
“key”: “engine”,
“value”: “tiflash”
}
],
“version”: “v4.0.2”,
“peer_address”: “10.0.0.3:20170”,
“status_address”: “10.0.0.3:20292”,
“git_hash”: “8dee36744ae9ecfe9dda0522fef1634e37d23e87”,
“start_timestamp”: 1594008335,
“deploy_path”: “/export/tidb-deploy/tiflash-9000/bin/tiflash”,
“last_heartbeat”: 1594017826791265458,
“state_name”: “Up”
},
“status”: {
“capacity”: “728.6GiB”,
“available”: “523.8GiB”,
“used_size”: “14.94MiB”,
“leader_count”: 0,
“leader_weight”: 1,
“leader_score”: 0,
“leader_size”: 0,
“region_count”: 0,
“region_weight”: 1,
“region_score”: 0,
“region_size”: 0,
“start_ts”: “2020-07-06T00:05:35-04:00”,
“last_heartbeat_ts”: “2020-07-06T02:43:46.791265458-04:00”,
“uptime”: “2h38m11.791265458s”
}
},
{
“store”: {
“id”: 1,
“address”: “10.0.0.7:20160”,
“version”: “4.0.2”,
“status_address”: “10.0.0.7:20180”,
“git_hash”: “98ee08c587ab47d9573628aba6da741433d8855c”,
“start_timestamp”: 1593685511,
“last_heartbeat”: 1594017833347284662,
“state_name”: “Up”
},
“status”: {
“capacity”: “1.791TiB”,
“available”: “1.223TiB”,
“used_size”: “550.3GiB”,
“leader_count”: 69717,
“leader_weight”: 1,
“leader_score”: 69717,
“leader_size”: 1409337,
“region_count”: 209140,
“region_weight”: 1,
“region_score”: 4048740,
“region_size”: 4048740,
“start_ts”: “2020-07-02T06:25:11-04:00”,
“last_heartbeat_ts”: “2020-07-06T02:43:53.347284662-04:00”,
“uptime”: “92h18m42.347284662s”
}
},
{
“store”: {
“id”: 4,
“address”: “10.0.0.6:20160”,
“version”: “4.0.2”,
“status_address”: “10.0.0.6:20180”,
“git_hash”: “98ee08c587ab47d9573628aba6da741433d8855c”,
“start_timestamp”: 1593685545,
“last_heartbeat”: 1594017833156484544,
“state_name”: “Up”
},
“status”: {
“capacity”: “5.73TiB”,
“available”: “5.167TiB”,
“used_size”: “545.8GiB”,
“leader_count”: 69708,
“leader_weight”: 1,
“leader_score”: 69708,
“leader_size”: 1324388,
“region_count”: 209140,
“region_weight”: 1,
“region_score”: 4048740,
“region_size”: 4048740,
“start_ts”: “2020-07-02T06:25:45-04:00”,
“last_heartbeat_ts”: “2020-07-06T02:43:53.156484544-04:00”,
“uptime”: “92h18m8.156484544s”
}
}
]
}

当前节点都是 up 的状态:

看下 grafana 监控中 overview - tikv - health region 的信息。

在pd的health region里看到许多空的统计

sorry ,更下正 overview - pd - region health

tikv 错误应该时空 region 过多导致的,在 asktug 可以搜索下 region merge 。

tiflash 下线失败的问题,调整 scale-in 参数 --ssh-timeout 和 --wait-time-out ,如果还是报错可以发一下 tiflash-deploy-dir/log/* 上传下,我们看下原因,

通过tiup cluster edit-config qingzhu-tidb-cluster命令
修改 server_configs → tikv → coprocessor.split-region-on-table: false
因为开启了tiflash 添加了server_configs → pd → replication.enable-placement-rules: true

然后根据ask帖子 [FAQ] 解决已经开启 region merge, empty-region-count 仍然很多问题
tiup ctl pd config set key-type table //默认table***(此处当时没理解,如果没有设置过txn或者raw,默认成table即可, 同时开启 tiup ctl pd config set enable-cross-table-merge true)***
tiup ctl pd config set max-merge-region-size 10 //默认20M
tiup ctl pd config set max-merge-region-keys 50000 //默认200000
tiup ctl pd config set merge-schedule-limit 32 //默认8 可以调大

tiup ctl pd config set region-schedule-limit 32 //默认是4
tiup ctl pd config set hot-region-schedule-limit 32 //默认4
tiup ctl pd config set patrol-region-interval 10ms //默认100ms
动态修改了以上7个参数,但是grafana上面显示的empty region依然没有下降

等了大概一个小时竟然降下来了,开心,感谢:sweat_smile:

日志上出了一些region消失的告警

日志为 tidb 集群的正常调度,可以先忽略,等到空 region 合并完成。

嗯嗯 感谢 empty region数量已经变成0了 还有一个问题请教
启动 tiflash 后添加了server_configs → pd → replication.enable-placement-rules: true 参数,之后 key-type应该设置成啥,看文档上有txn、raw、table三个参数,这块没理解到底是什么意思???

如果需要合并这些空 region,可以将 key-type 设为 table,同时设置 enable-cross-table-merge 为 true