TiDB 3.0.5
TiDB服务器每隔24分钟就会由于内存不够导致自已重启。但里面的数据量也不多,并且连接数也不多,只有DM做实时同步,现在还没有用户在使用。
tidb.log (2.8 MB) tidb_slow_query.log (4.0 MB)
DM原来部署4台机器7个DM worker,但最近由于总是重启,就将其余6个停止,只保留了一个,里面运行一个task。这个dm work是昨天重新部署的,看上面没有什么问题,但由于TiDB总是重启,这个状态也不对
看报错都是写入冲突. [2020/05/03 13:23:38.509 +08:00] [ERROR] [ddl_worker.go:141] ["[ddl] handle DDL job failed"] [worker=“worker 1, tp general”] [error="[kv:9007]Write conflict, txnStartTS=416411396770627655, conflictStartTS=416411396351197259, conflictCommitTS=416411397045878865, key=[]byte{0x6d, 0x44, 0x44, 0x4c, 0x4a, 0x6f, 0x62, 0x4c, 0x69, 0xff, 0x73, 0x74, 0x0, 0x0, 0x0, 0x0, 0x0, 0x0, 0xf9, 0x0, 0x0, 0x0, 0x0, 0x0, 0x0, 0x0, 0x4c} primary=[]byte{0x6d, 0x44, 0x44, 0x4c, 0x4a, 0x6f, 0x62, 0x48, 0x69, 0xff, 0x73, 0x74, 0x6f, 0x72, 0x79, 0x0, 0x0, 0x0, 0xfc, 0x0, 0x0, 0x0, 0x0, 0x0, 0x0, 0x0, 0x48} [try again later]"]
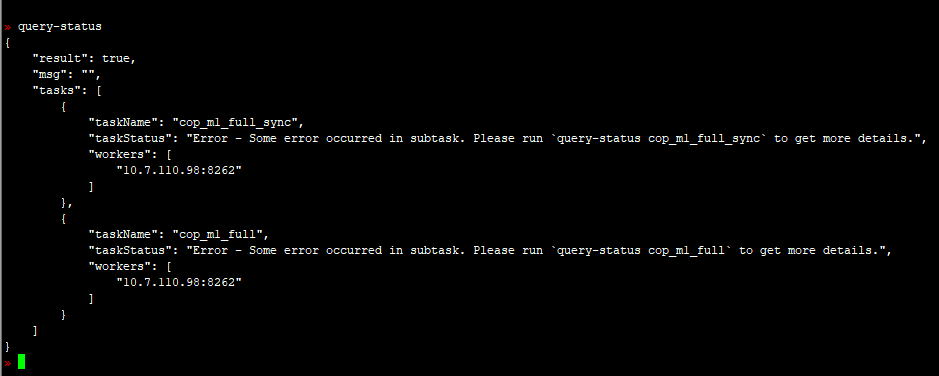
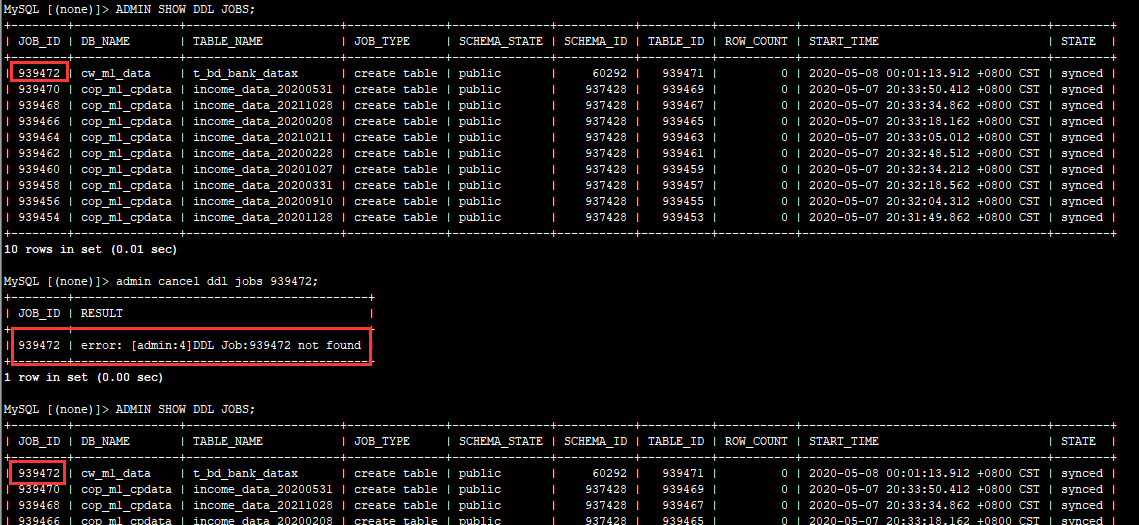
请执行下 ADMIN SHOW DDL JOBS;
这个里面的内容是采集oracle数据到tidb写的程序,通过datax实现。
第一个cw_m1_data是datax采集的。
其他的都是dm work采集的
通过admin cancel ddl jobs 939472命令取消息job,也执行不成功
这个job取消不掉的问题,能处理么?这个TiDB集群昨天重启过,所以通过重启的方法可能不行。
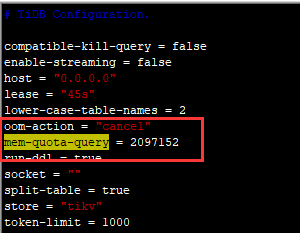
mem-quota-query 和 mem-quota-query 。 重启后, 我们看下是否有记录的 大sql,多谢。按照下面的修改了。限制为2097152=200M
tidb.log (354.3 KB)
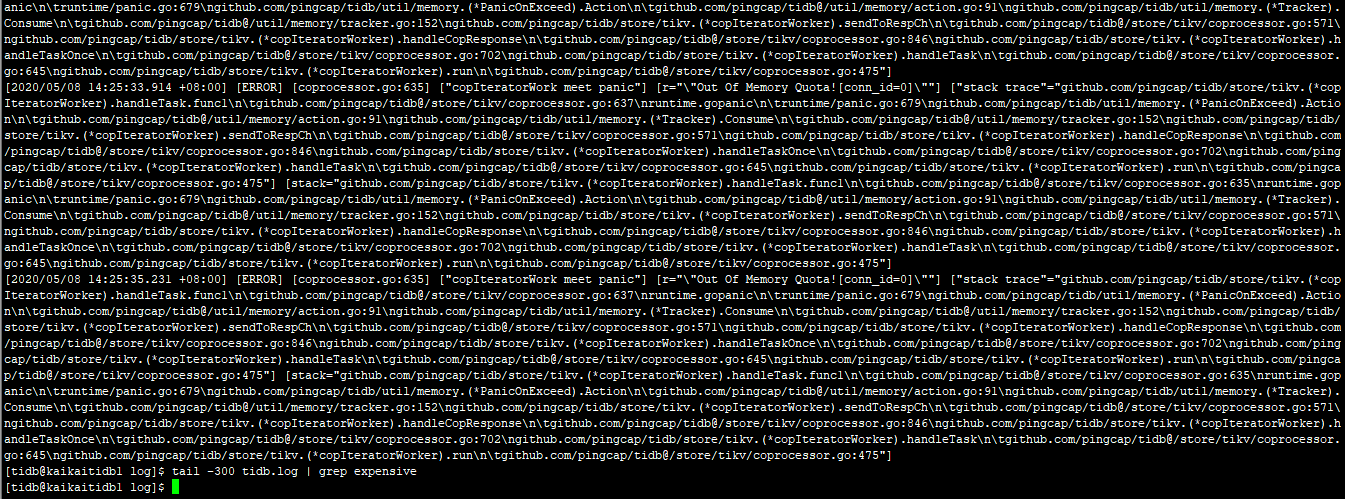
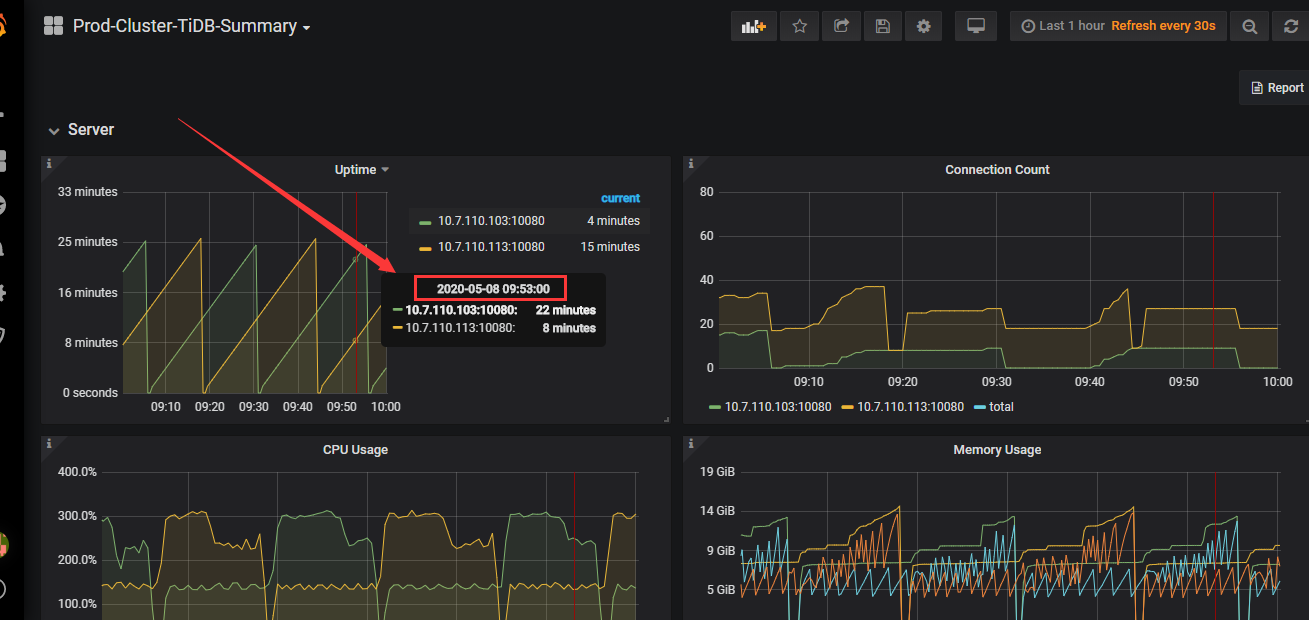
修改配置重启后,发现日志当中确实有很多oom的日志,但没有具体语句。并且观察了一段时间没有重启。(由于只修改了一个tidb,另一个没有修改,没有修改那个就重启了)
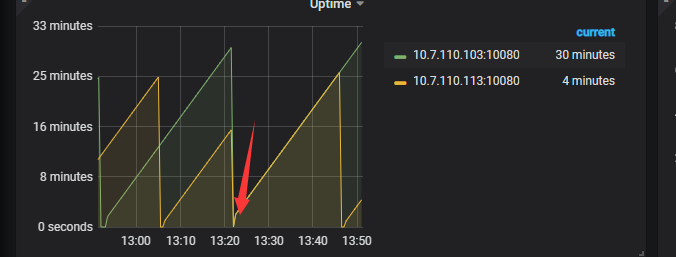
在红色箭头的时候重启的整个集群
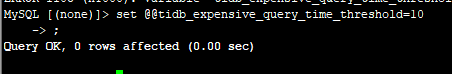
麻烦尝试配置下参数 tidb_expensive_query_time_threshold 将值设置为 10s,看下tidb日志是否有包含expensive这样的sql,如果没有,将值改为1s试试。 多谢
通过下面的语句设置的这个tidb_expensive_query_time_threshold这个参数,对么?
之后再查询tidb.log这个日志,查包含【expensive】这个关键字的sql语句,对吧?
我们在分析下,稍后答复,多谢
好的,如果需要远程操作的话,也可以。
这个 log 看起来是 cop 读数据的时候就超过内存限制了,可以把 200M 的限制放宽一点吗,机器总的内存有多少?
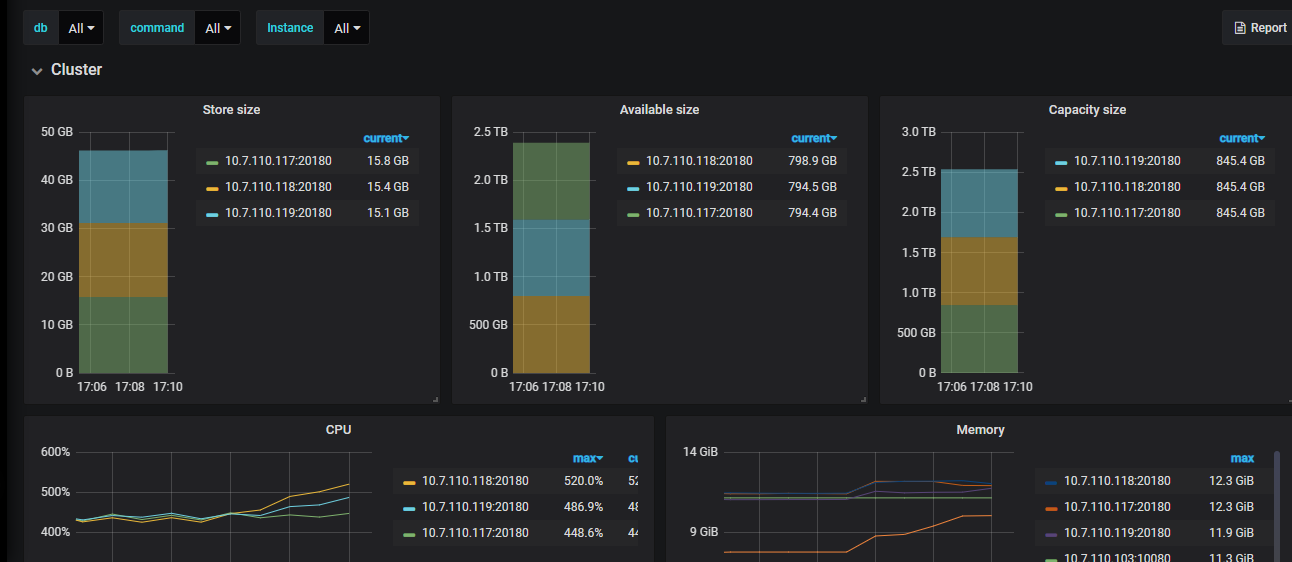
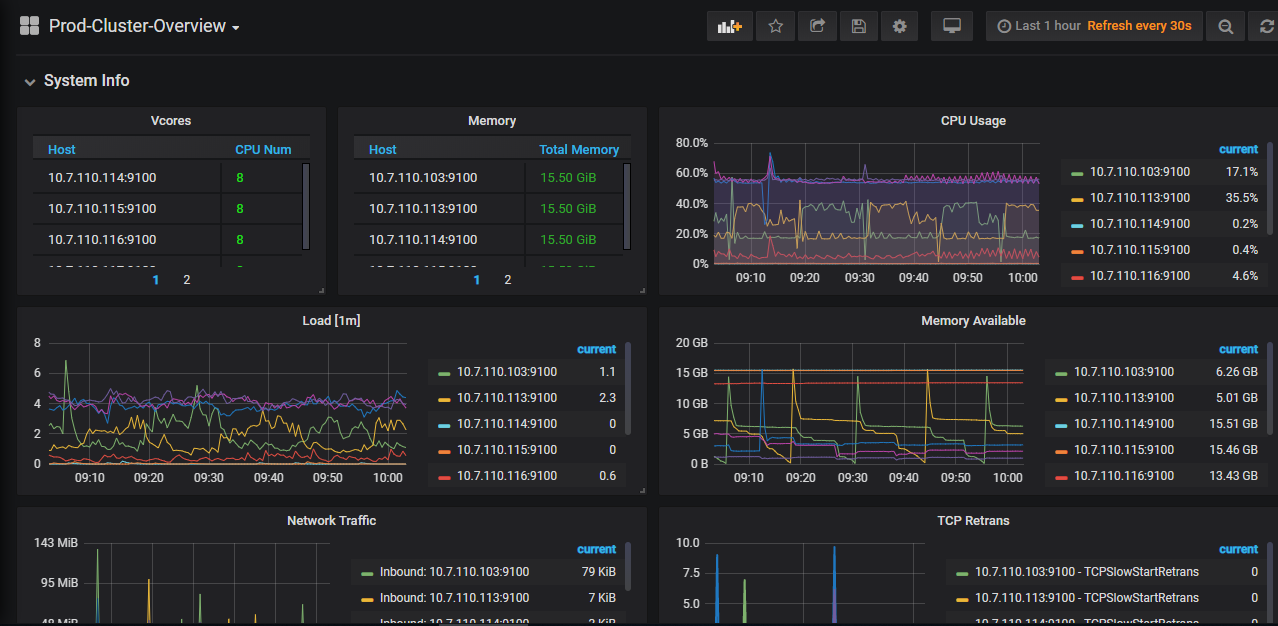
机器总内存16G。
已经调整为600m
![]()
重启后日志:
[2020/05/08 16:02:27.320 +08:00] [INFO] [printer.go:41] [“Welcome to TiDB.”] [“Release Version”=v3.0.5] [“Git Commit Hash”=c9000abdc216b6a02efbcc578af8be1f98ba280d] [“Git Branch”=HEAD] [“UTC Build Time”=“2019-10-25 03:25:32”] [GoVersion=“go version go1.13 linux/amd64”] [“Race Enabled”=false] [“Check Table Before Drop”=false] [“TiKV Min Version”=v3.0.0-60965b006877ca7234adaced7890d7b029ed1306] [2020/05/08 16:02:27.320 +08:00] [INFO] [printer.go:54] [“loaded config”] [config="{“host”:“0.0.0.0”,“advertise-address”:“10.7.110.103”,“port”:4000,“cors”:"",“store”:“tikv”,“path”:“10.7.110.114:2379,10.7.110.115:2379,10.7.110.116:2379”,“socket”:"",“lease”:“45s”,“run-ddl”:true,“split-table”:true,“token-limit”:1000,“oom-action”:“cancel”,“mem-quota-query”:6291456,“enable-streaming”:false,“txn-local-latches”:{“enabled”:true,“capacity”:2048000},“lower-case-table-names”:2,“log”:{“level”:“error”,“format”:“text”,“disable-timestamp”:false,“file”:{“filename”:"/data1/deploy/log/tidb.log",“log-rotate”:true,“max-size”:300,“max-days”:0,“max-backups”:0},“slow-query-file”:"/data1/deploy/log/tidb_slow_query.log",“slow-threshold”:300,“expensive-threshold”:10000,“query-log-max-len”:2048,“record-plan-in-slow-log”:1},“security”:{“skip-grant-table”:false,“ssl-ca”:"",“ssl-cert”:"",“ssl-key”:"",“cluster-ssl-ca”:"",“cluster-ssl-cert”:"",“cluster-ssl-key”:""},“status”:{“report-status”:true,“status-host”:“0.0.0.0”,“status-port”:10080,“metrics-addr”:"",“metrics-interval”:15,“record-db-qps”:false},“performance”:{“max-procs”:0,“max-memory”:0,“tcp-keep-alive”:true,“cross-join”:true,“stats-lease”:“3s”,“run-auto-analyze”:true,“stmt-count-limit”:5000,“feedback-probability”:0.05,“query-feedback-limit”:1024,“pseudo-estimate-ratio”:0.8,“force-priority”:“NO_PRIORITY”,“bind-info-lease”:“3s”},“prepared-plan-cache”:{“enabled”:false,“capacity”:100,“memory-guard-ratio”:0.1},“opentracing”:{“enable”:false,“sampler”:{“type”:“const”,“param”:1,“sampling-server-url”:"",“max-operations”:0,“sampling-refresh-interval”:0},“reporter”:{“queue-size”:0,“buffer-flush-interval”:0,“log-spans”:false,“local-agent-host-port”:""},“rpc-metrics”:false},“proxy-protocol”:{“networks”:"",“header-timeout”:5},“tikv-client”:{“grpc-connection-count”:16,“grpc-keepalive-time”:10,“grpc-keepalive-timeout”:3,“commit-timeout”:“41s”,“max-txn-time-use”:590,“max-batch-size”:128,“overload-threshold”:200,“max-batch-wait-time”:0,“batch-wait-size”:8,“region-cache-ttl”:600},“binlog”:{“enable”:false,“write-timeout”:“15s”,“ignore-error”:false,“binlog-socket”:"",“strategy”:“range”},“compatible-kill-query”:false,“plugin”:{“dir”:"",“load”:""},“pessimistic-txn”:{“enable”:false,“max-retry-count”:256,“ttl”:“30s”},“check-mb4-value-in-utf8”:true,“treat-old-version-utf8-as-utf8mb4”:true,“split-region-max-num”:1000,“stmt-summary”:{“max-stmt-count”:100,“max-sql-length”:4096}}"] [2020/05/08 16:03:30.995 +08:00] [ERROR] [ddl_worker.go:141] ["[ddl] handle DDL job failed"] [worker=“worker 1, tp general”] [error="[tikv:9005]Region is unavailable"] [errorVerbose="[tikv:9005]Region is unavailable\ngithub.com/pingcap/errors.AddStack\ \tgithub.com/pingcap/errors@v0.11.4/errors.go:174\ github.com/pingcap/errors.Trace\ \tgithub.com/pingcap/errors@v0.11.4/juju_adaptor.go:15\ github.com/pingcap/tidb/store/tikv.(*RegionRequestSender).onRegionError\ \tgithub.com/pingcap/tidb@/store/tikv/region_request.go:234\ github.com/pingcap/tidb/store/tikv.(*RegionRequestSender).SendReqCtx\ \tgithub.com/pingcap/tidb@/store/tikv/region_request.go:129\ github.com/pingcap/tidb/store/tikv.(*RegionRequestSender).SendReq\ \tgithub.com/pingcap/tidb@/store/tikv/region_request.go:72\ github.com/pingcap/tidb/store/tikv.(*tikvSnapshot).get\ \tgithub.com/pingcap/tidb@/store/tikv/snapshot.go:305\ github.com/pingcap/tidb/store/tikv.(*tikvSnapshot).Get\ \tgithub.com/pingcap/tidb@/store/tikv/snapshot.go:265\ github.com/pingcap/tidb/kv.(*unionStore).Get\ \tgithub.com/pingcap/tidb@/kv/union_store.go:194\ github.com/pingcap/tidb/store/tikv.(*tikvTxn).Get\ \tgithub.com/pingcap/tidb@/store/tikv/txn.go:133\ github.com/pingcap/tidb/structure.(*TxStructure).loadListMeta\ \tgithub.com/pingcap/tidb@/structure/list.go:216\ github.com/pingcap/tidb/structure.(*TxStructure).LIndex\ \tgithub.com/pingcap/tidb@/structure/list.go:162\ github.com/pingcap/tidb/meta.(*Meta).getDDLJob\ \tgithub.com/pingcap/tidb@/meta/meta.go:486\ github.com/pingcap/tidb/meta.(*Meta).GetDDLJobByIdx\ \tgithub.com/pingcap/tidb@/meta/meta.go:515\ github.com/pingcap/tidb/ddl.(*worker).getFirstDDLJob\ \tgithub.com/pingcap/tidb@/ddl/ddl_worker.go:227\ github.com/pingcap/tidb/ddl.(*worker).handleDDLJobQueue.func1\ \tgithub.com/pingcap/tidb@/ddl/ddl_worker.go:376\ github.com/pingcap/tidb/kv.RunInNewTxn\ \tgithub.com/pingcap/tidb@/kv/txn.go:50\ github.com/pingcap/tidb/ddl.(*worker).handleDDLJobQueue\ \tgithub.com/pingcap/tidb@/ddl/ddl_worker.go:367\ github.com/pingcap/tidb/ddl.(*worker).start\ \tgithub.com/pingcap/tidb@/ddl/ddl_worker.go:139\ github.com/pingcap/tidb/ddl.(*ddl).start.func1\ \tgithub.com/pingcap/tidb@/ddl/ddl.go:440\ github.com/pingcap/tidb/util.WithRecovery\ \tgithub.com/pingcap/tidb@/util/misc.go:81\ runtime.goexit\ \truntime/asm_amd64.s:1357"] [stack=“github.com/pingcap/tidb/ddl.(*worker).start\ \tgithub.com/pingcap/tidb@/ddl/ddl_worker.go:141\ github.com/pingcap/tidb/ddl.(*ddl).start.func1\ \tgithub.com/pingcap/tidb@/ddl/ddl.go:440\ github.com/pingcap/tidb/util.WithRecovery\ \tgithub.com/pingcap/tidb@/util/misc.go:81”]
你好,像这种情况还有救么?
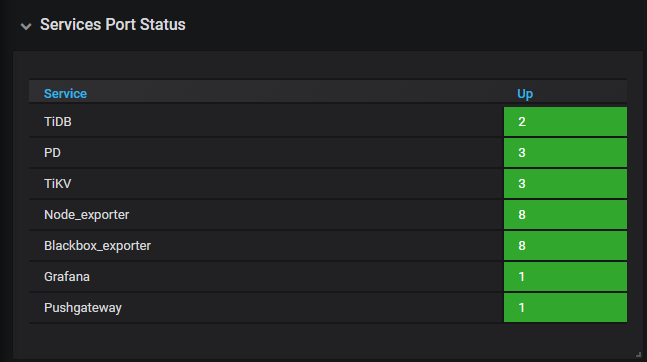
监控里 tikv 的状态正常吗,现在是 tidb 直接启动不来了吗