为提高效率,请提供以下信息,问题描述清晰能够更快得到解决:
【 TiDB 使用环境】
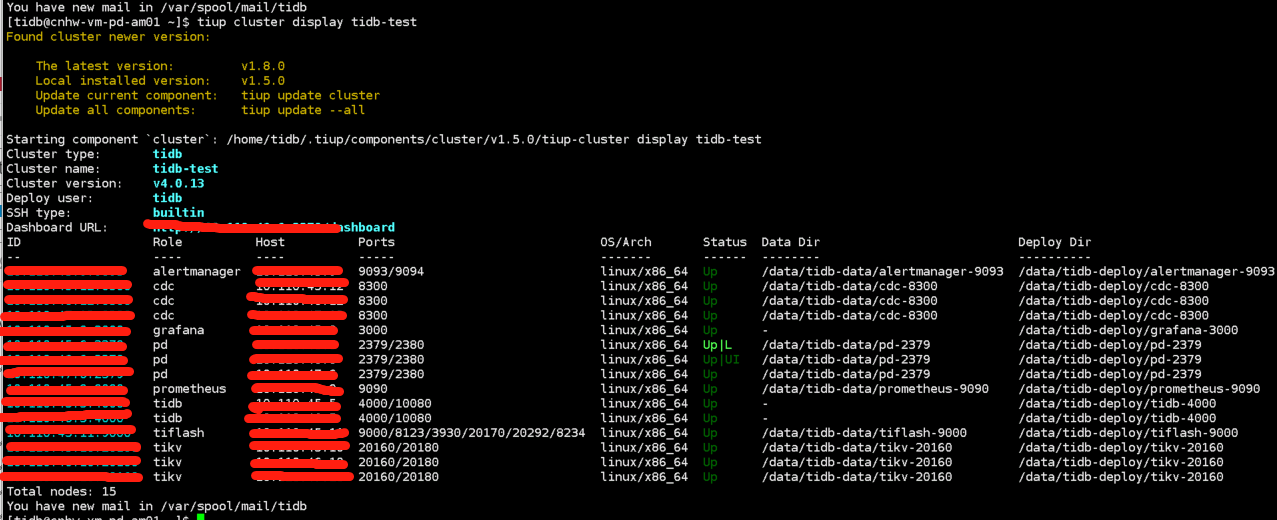
3tikv+2tidb+3pd+3ticdc+1tiflash
【概述】 场景 + 问题概述
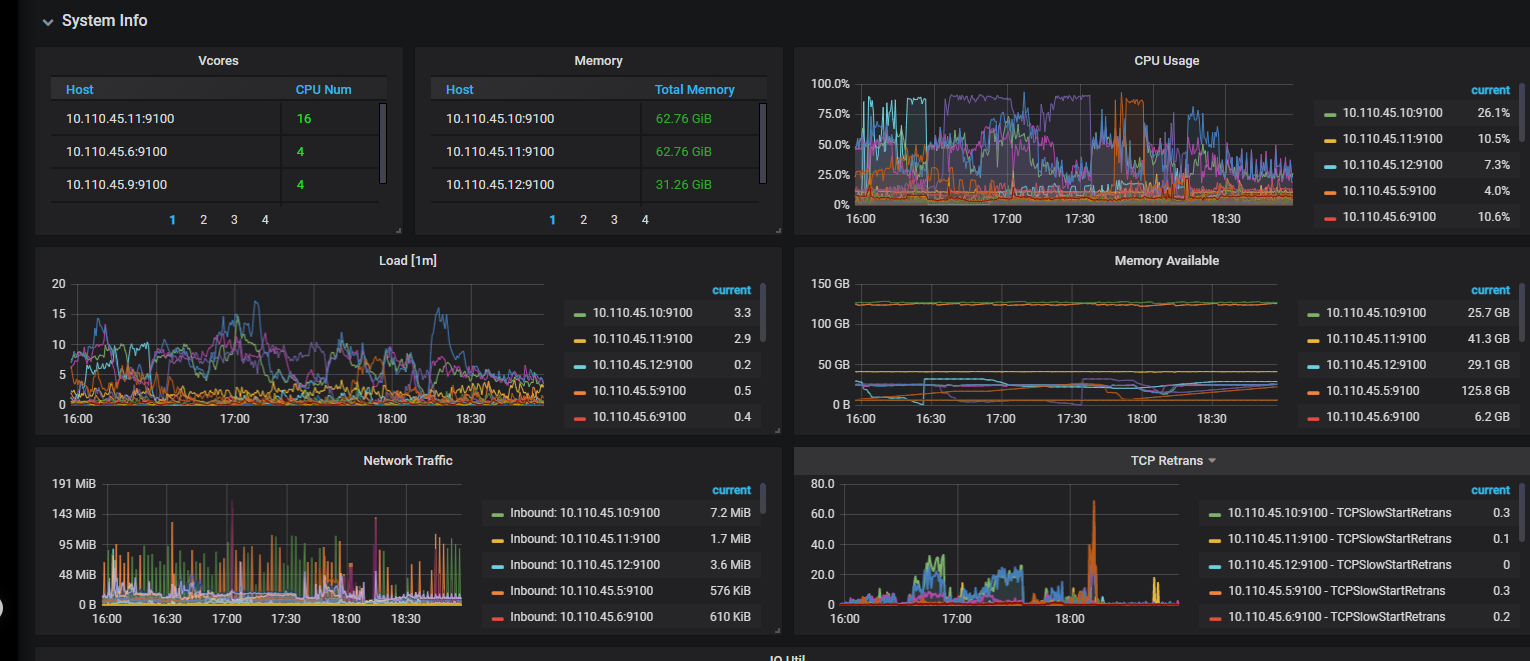
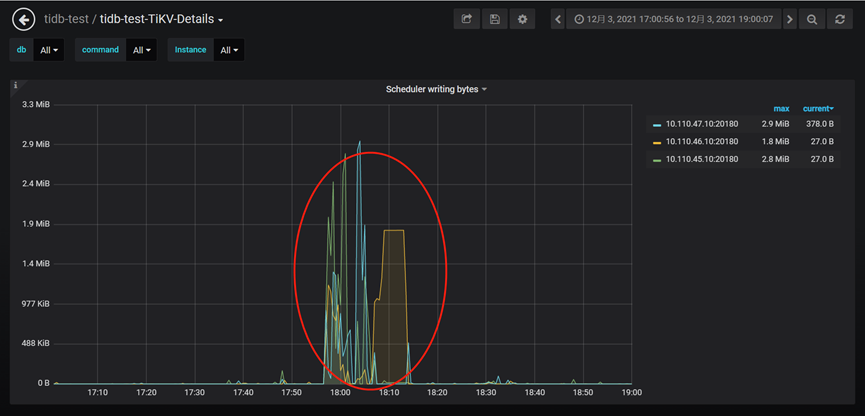
tikv节点在业务量高峰时会被异常踢掉,但tikv所在服务器的网络,磁盘和cpu虽有上升,但并未达到使用上限。
【背景】 做过哪些操作
【现象】 业务和数据库现象
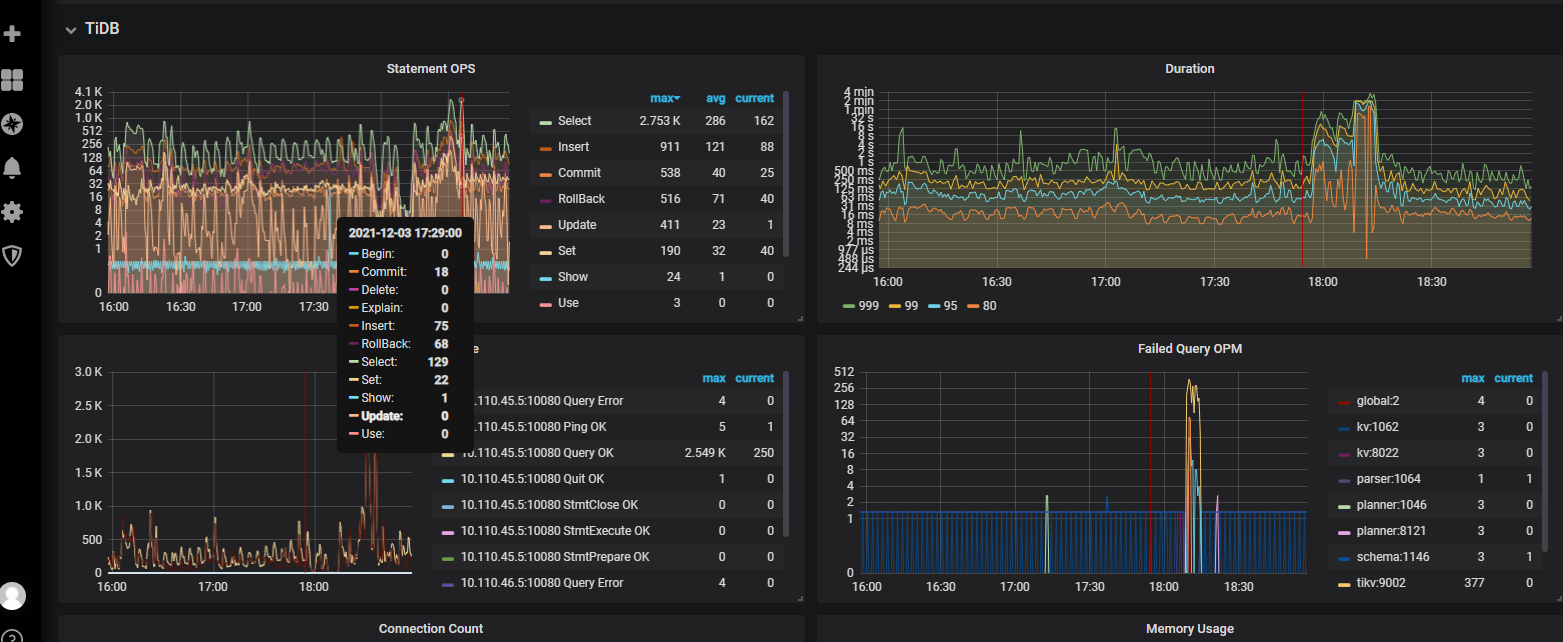
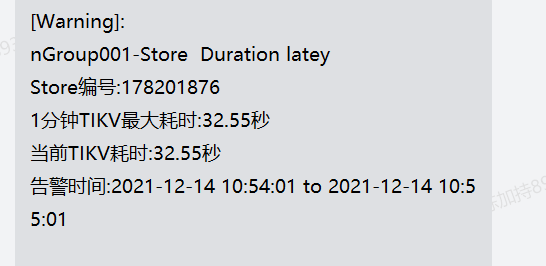
数据库突然响应慢,单个tikv节点被踢掉,应用程序中正在执行的事务报错。
【问题】 当前遇到的问题,参考 AskTUG 的 Troubleshooting https://asktug.com/t/topic/68049
【统计信息是否最新】
    【执行计划内容】

    【 SQL 文本、schema 以及 数据分布】
【业务影响】
【TiDB 版本】
v4.0.13
【附件】 相关日志及监控(https://metricstool.pingcap.com/)
- TiUP Cluster Display 信息
- TiUP CLuster Edit config 信息
global:
user: tidb
ssh_port: 22
ssh_type: builtin
deploy_dir: /data/tidb-deploy
data_dir: /data/tidb-data
os: linux
arch: amd64
monitored:
node_exporter_port: 9100
blackbox_exporter_port: 9115
deploy_dir: /data/tidb-deploy/monitor-9100
data_dir: /data/tidb-data/monitor-9100
log_dir: /data/tidb-deploy/monitor-9100/log
server_configs:
tidb:
lower-case-table-names: 1
performance.max-txn-ttl: 7200000
performance.txn-total-size-limit: 10737418240
tikv: {}
pd:
replication.enable-placement-rules: true
tiflash: {}
tiflash-learner: {}
pump: {}
drainer: {}
cdc: {}
tidb_servers:
- host: xx.xxx.45.5
ssh_port: 22
port: 4000
status_port: 10080
deploy_dir: /data/tidb-deploy/tidb-4000
log_dir: /data/tidb-deploy/tidb-4000/log
arch: amd64
os: linux - host: xx.xx.46.5
ssh_port: 22
port: 4000
status_port: 10080
deploy_dir: /data/tidb-deploy/tidb-4000
log_dir: /data/tidb-deploy/tidb-4000/log
arch: amd64
os: linux
tikv_servers: - host: xx.xx.45.10
ssh_port: 22
port: 20160
status_port: 20180
deploy_dir: /data/tidb-deploy/tikv-20160
data_dir: /data/tidb-data/tikv-20160
log_dir: /data/tidb-deploy/tikv-20160/log
arch: amd64
os: linux - host: xx.xx.46.10
ssh_port: 22
port: 20160
status_port: 20180
deploy_dir: /data/tidb-deploy/tikv-20160
data_dir: /data/tidb-data/tikv-20160
log_dir: /data/tidb-deploy/tikv-20160/log
arch: amd64
os: linux - host: xx.xx.47.10
ssh_port: 22
port: 20160
status_port: 20180
deploy_dir: /data/tidb-deploy/tikv-20160
data_dir: /data/tidb-data/tikv-20160
log_dir: /data/tidb-deploy/tikv-20160/log
arch: amd64
os: linux
tiflash_servers: - host: xx.xx.45.11
ssh_port: 22
tcp_port: 9000
http_port: 8123
flash_service_port: 3930
flash_proxy_port: 20170
flash_proxy_status_port: 20292
metrics_port: 8234
deploy_dir: /data/tidb-deploy/tiflash-9000
data_dir: /data/tidb-data/tiflash-9000
log_dir: /data/tidb-deploy/tiflash-9000/log
arch: amd64
os: linux
pd_servers: - host: xx.xxx.45.6
ssh_port: 22
name: pd-xx.xx.45.6-2379
client_port: 2379
peer_port: 2380
deploy_dir: /data/tidb-deploy/pd-2379
data_dir: /data/tidb-data/pd-2379
log_dir: /data/tidb-deploy/pd-2379/log
arch: amd64
os: linux - host: xx.xx.46.6
ssh_port: 22
name: pd-xx.xxx.46.6-2379
client_port: 2379
peer_port: 2380
deploy_dir: /data/tidb-deploy/pd-2379
data_dir: /data/tidb-data/pd-2379
log_dir: /data/tidb-deploy/pd-2379/log
arch: amd64
os: linux - host: xx.xx.47.6
ssh_port: 22
name: pd-xxx.xxx.47.6-2379
client_port: 2379
peer_port: 2380
deploy_dir: /data/tidb-deploy/pd-2379
data_dir: /data/tidb-data/pd-2379
log_dir: /data/tidb-deploy/pd-2379/log
arch: amd64
os: linux
cdc_servers: - host: xx.xxx.45.12
ssh_port: 22
port: 8300
deploy_dir: /data/tidb-deploy/cdc-8300
data_dir: /data/tidb-data/cdc-8300
log_dir: /data/tidb-deploy/cdc-8300/log
arch: amd64
os: linux - host: xx.xxx.46.12
ssh_port: 22
port: 8300
deploy_dir: /data/tidb-deploy/cdc-8300
data_dir: /data/tidb-data/cdc-8300
log_dir: /data/tidb-deploy/cdc-8300/log
arch: amd64
os: linux - host: xx.xxx.47.12
ssh_port: 22
port: 8300
deploy_dir: /data/tidb-deploy/cdc-8300
data_dir: /data/tidb-data/cdc-8300
log_dir: /data/tidb-deploy/cdc-8300/log
arch: amd64
os: linux
monitoring_servers: - host: xxx.xxx.45.9
ssh_port: 22
port: 9090
deploy_dir: /data/tidb-deploy/prometheus-9090
data_dir: /data/tidb-data/prometheus-9090
log_dir: /data/tidb-deploy/prometheus-9090/log
external_alertmanagers: []
arch: amd64
os: linux
grafana_servers: - host: xxx.xxx.45.9
ssh_port: 22
port: 3000
deploy_dir: /data/tidb-deploy/grafana-3000
arch: amd64
os: linux
username: admin
password: admin
anonymous_enable: false
root_url: “”
domain: “”
alertmanager_servers: - host: xxx.xxx.45.9
ssh_port: 22
web_port: 9093
cluster_port: 9094
deploy_dir: /data/tidb-deploy/alertmanager-9093
data_dir: /data/tidb-data/alertmanager-9093
log_dir: /data/tidb-deploy/alertmanager-9093/log
arch: amd64
os: linux
- TiDB-Overview Grafana监控
- TiDB Grafana 监控
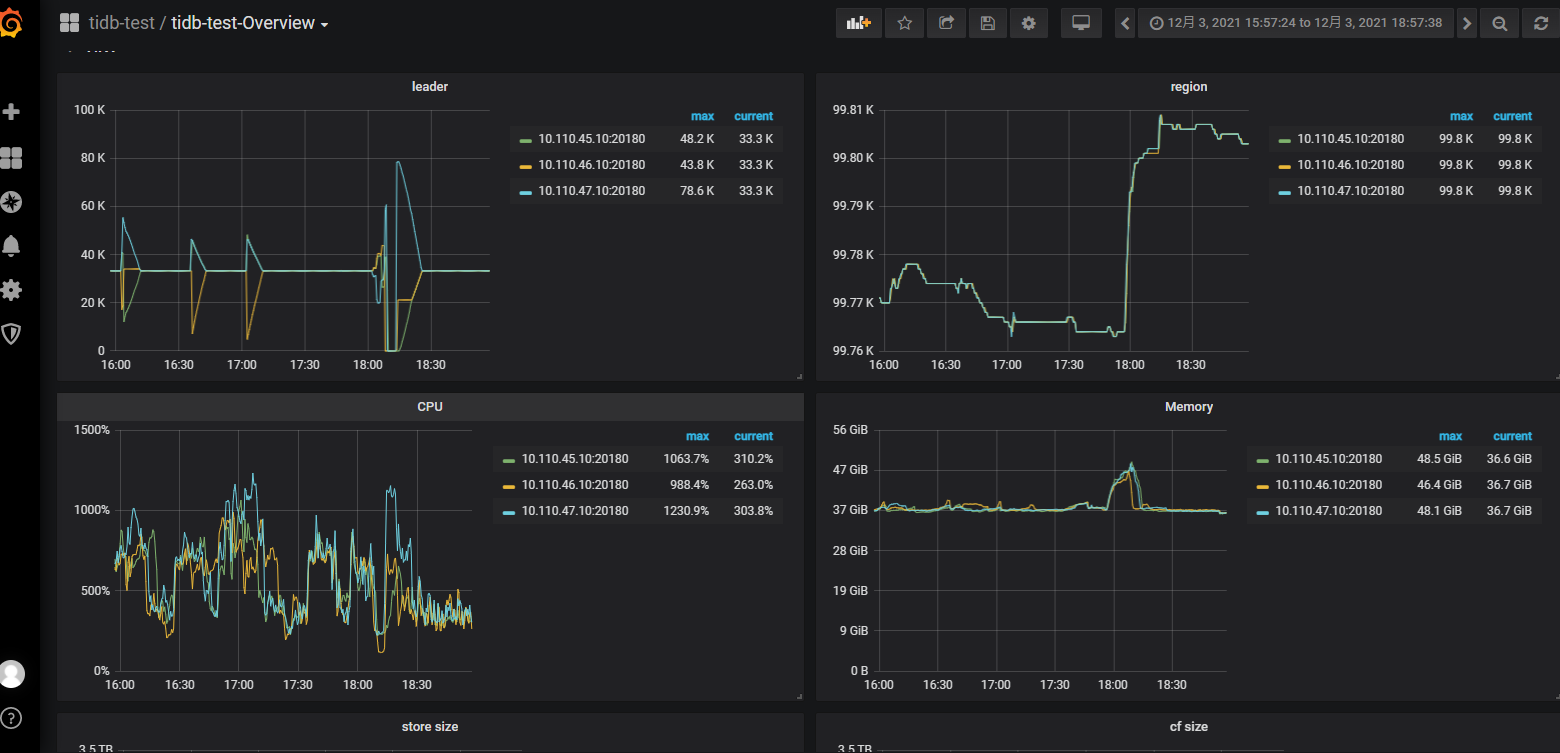
- TiKV Grafana 监控
- PD Grafana 监控
- 对应模块日志(包含问题前后 1 小时日志)
pd日志显示故障前大量region leader在tikv之间切换。

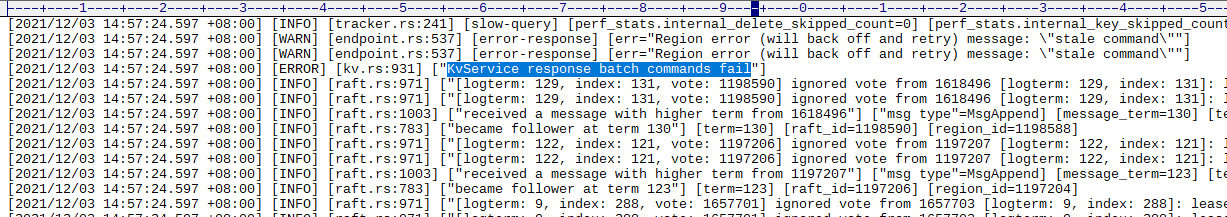
 类似这种,找对应TIKV 查看日志