为提高效率,请提供以下信息,问题描述清晰能够更快得到解决:
【 TiDB 使用环境】
TIDB V5.2.1
【概述】 场景 + 问题概述
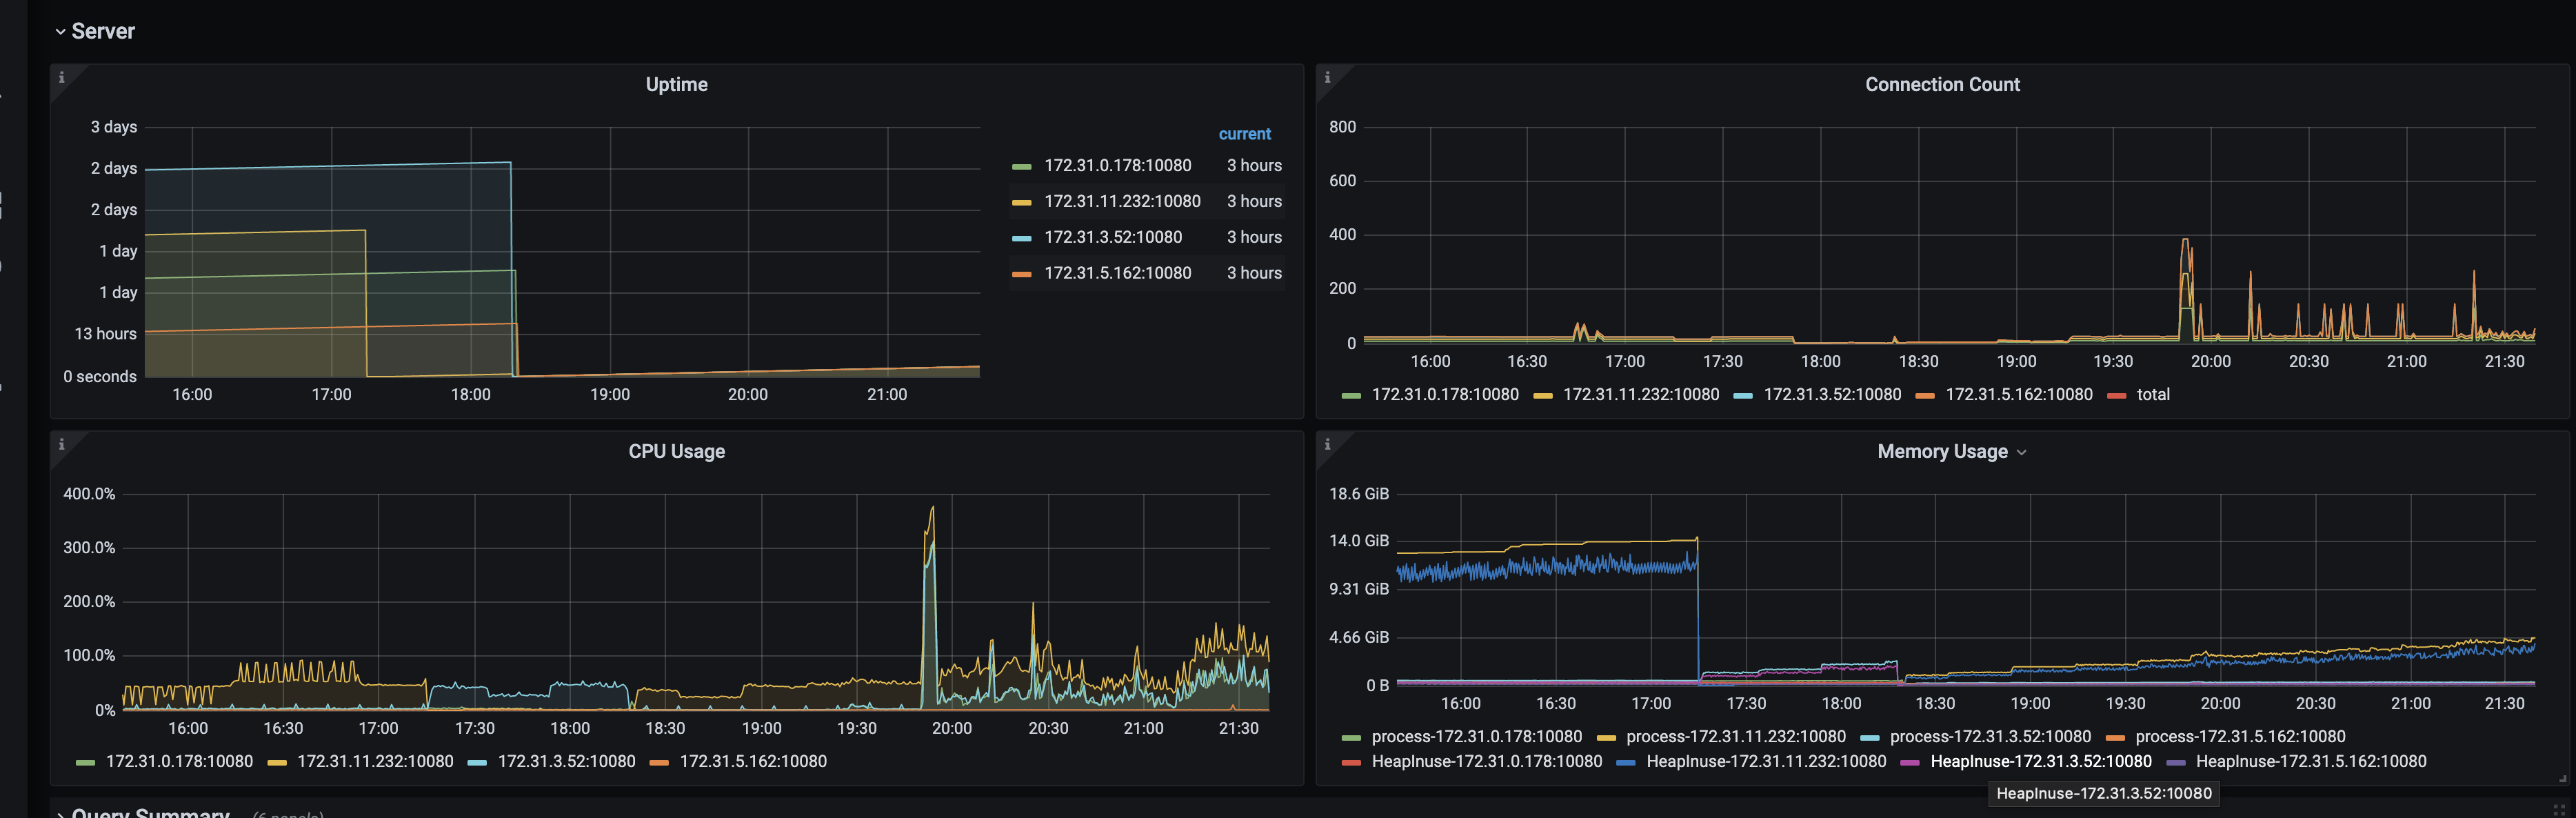
大量写请求的场景,几乎没有读请求;tidb 三台节点和 pd 混部,另外单独部署了一台 tidb,最近其中一台节点(混部)内存飙升,重启后释放内存,过一段时间又开始飙升。
ERROR LOG
[2021/11/14 12:53:32.230 +00:00] [ERROR] [update.go:1085] ["[stats] auto analyze failed"] [sql="analyze table %n.%n"] [cost_time=19m59.602356099s] [error="[tikv:9006]GC life time is shorter than transaction duration, transaction starts at 2021-11-14 12:33:32.598 +0000 UTC, GC safe point is 2021-11-14 12:43:23.149 +0000 UTC"]
[2021/11/14 13:13:33.632 +00:00] [ERROR] [analyze.go:146] ["analyze failed"] [error="[tikv:9006]GC life time is shorter than transaction duration, transaction starts at 2021-11-14 12:53:32.198 +0000 UTC, GC safe point is 2021-11-14 13:03:23.148 +0000 UTC"]
[2021/11/14 13:13:33.633 +00:00] [ERROR] [update.go:1085] ["[stats] auto analyze failed"] [sql="analyze table %n.%n"] [cost_time=20m1.40170836s] [error="[tikv:9006]GC life time is shorter than transaction duration, transaction starts at 2021-11-14 12:53:32.198 +0000 UTC, GC safe point is 2021-11-14 13:03:23.148 +0000 UTC"]
【背景】 做过哪些操作
重启
【现象】 业务和数据库现象
【问题】 当前遇到的问题
【业务影响】
【TiDB 版本】
V5.2.1
【应用软件及版本】
【附件】 相关日志及配置信息
-
TiUP Cluster Display 信息
-
TiUP CLuster Edit config 信息
server_configs:
  tidb:
    binlog.enable: false
    binlog.ignore-error: false
    log.slow-threshold: 300
    new_collations_enabled_on_first_bootstrap: true
  tikv:
    readpool.coprocessor.use-unified-pool: true
    readpool.storage.use-unified-pool: false
  pd:
    schedule.leader-schedule-limit: 4
    schedule.region-schedule-limit: 2048
    schedule.replica-schedule-limit: 64
监控(https://metricstool.pingcap.com/)
- TiDB-Overview Grafana监控
- TiDB Grafana 监控
- TiKV Grafana 监控
- PD Grafana 监控
- 对应模块日志(包含问题前后 1 小时日志)
重启过
若提问为性能优化、故障排查类问题,请下载脚本运行。终端输出的打印结果,请务必全选并复制粘贴上传。