场景
- TiDB 版本:tidb 3.0.3
- 操作系统: CentOS 7 虚拟机
- CPU: 8核 16G
- 机械硬盘: 500G
| HostName | IP | DES | ---- |
|---|---|---|---|
| dev10 | 172.160.180.32 | 主控机 master | |
| dev11 | 172.160.180.33 | 监控机 | TiDB, PD |
| dev12 | 172.160.180.34 | 工作节点 | TiDB, PD |
| dev13 | 172.160.180.35 | 工作节点 | TiDB, PD |
| dev16 | 172.160.180.51 | 工作节点 | TiKV |
| dev17 | 172.160.180.52 | 工作节点 | TiKV |
| dev18 | 172.160.180.53 | 工作节点 | TiKV |
问题描述(我做了什么):
-
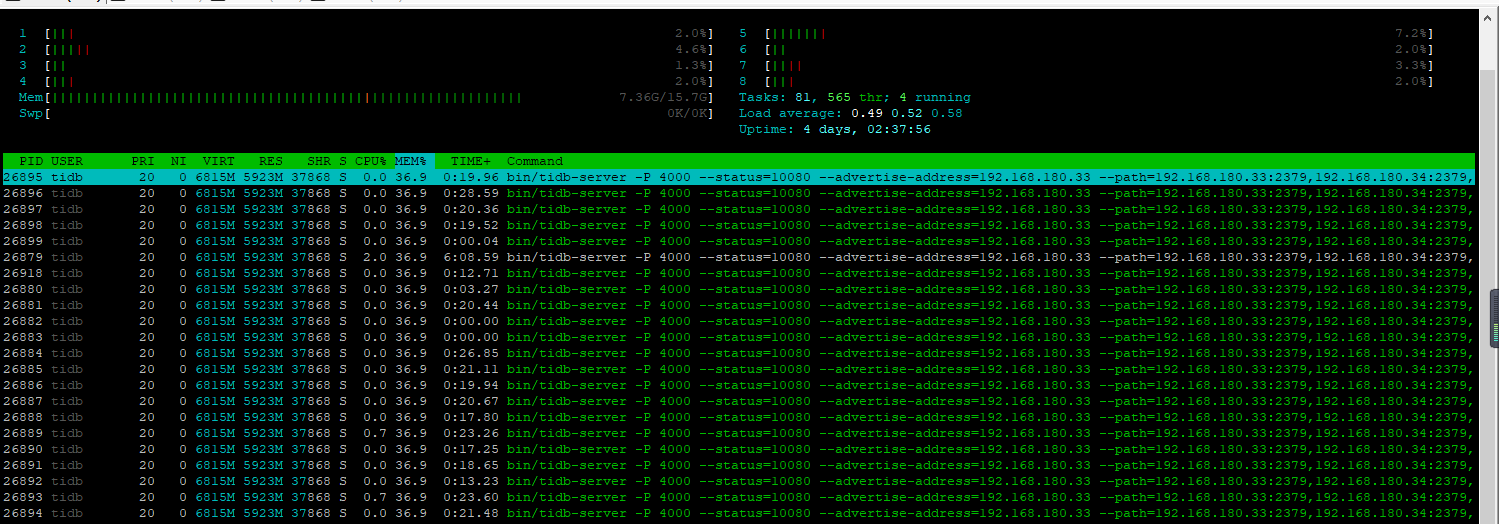
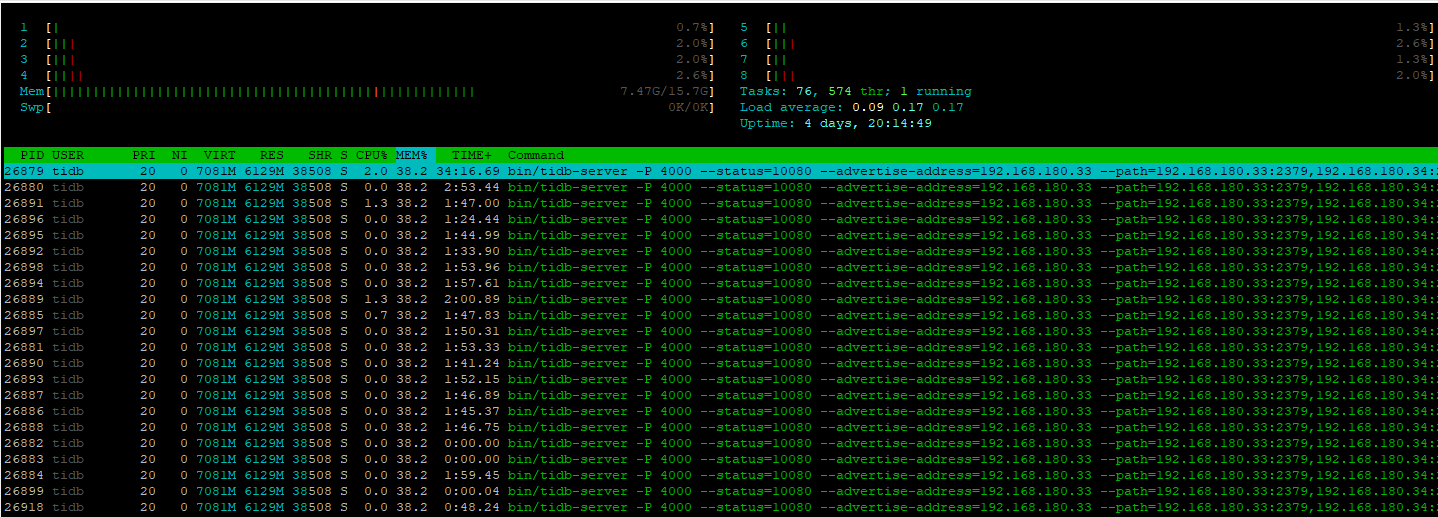
查看内存使用情况
-
查看内存快照

[tidb@dev10 ~]$ go tool pprof 172.160.180.33:10080/debug/pprof/heap
Fetching profile over HTTP from http://172.160.180.33:10080/debug/pprof/heap
Saved profile in /home/tidb/pprof/pprof.tidb-server.alloc_objects.alloc_space.inuse_objects.inuse_space.001.pb.gz
File: tidb-server
Build ID: 787dd8838e2bf23bccc68e84bc0a1df45a5e61d9
Type: inuse_space
Time: Sep 23, 2019 at 11:13am (CST)
Entering interactive mode (type "help" for commands, "o" for options)
(pprof)
(pprof) top
Showing nodes accounting for 2478.88MB, 93.44% of 2652.81MB total
Dropped 207 nodes (cum <= 13.26MB)
Showing top 10 nodes out of 72
      flat  flat%   sum%        cum   cum%
  901.53MB 33.98% 33.98%   901.53MB 33.98%  github.com/pingcap/tidb/executor/aggfuncs.(*firstRow4String).AllocPartialResult
  544.34MB 20.52% 54.50%  1555.38MB 58.63%  github.com/pingcap/tidb/executor.baseHashAggWorker.getPartialResult
  274.94MB 10.36% 64.87%   277.44MB 10.46%  github.com/pingcap/tidb/util/chunk.(*Chunk).AppendPartialRow
  208.70MB  7.87% 72.73%   311.49MB 11.74%  github.com/pingcap/tidb/util/chunk.(*column).appendString
     115MB  4.34% 77.07%      115MB  4.34%  github.com/pingcap/tidb/util/stringutil.Copy
  109.51MB  4.13% 81.20%   109.51MB  4.13%  github.com/pingcap/tidb/executor/aggfuncs.(*firstRow4Time).AllocPartialResult
  102.80MB  3.88% 85.07%   104.80MB  3.95%  github.com/pingcap/tidb/util/chunk.(*column).finishAppendVar
      96MB  3.62% 88.69%       96MB  3.62%  github.com/pingcap/tidb/store/tikv/latch.NewLatches
   86.29MB  3.25% 91.94%    87.29MB  3.29%  github.com/pingcap/tidb/util/chunk.(*column).appendNull
   39.77MB  1.50% 93.44%    39.77MB  1.50%  github.com/pingcap/tidb/util/chunk.newVarLenColumn
(pprof)
(pprof)
-
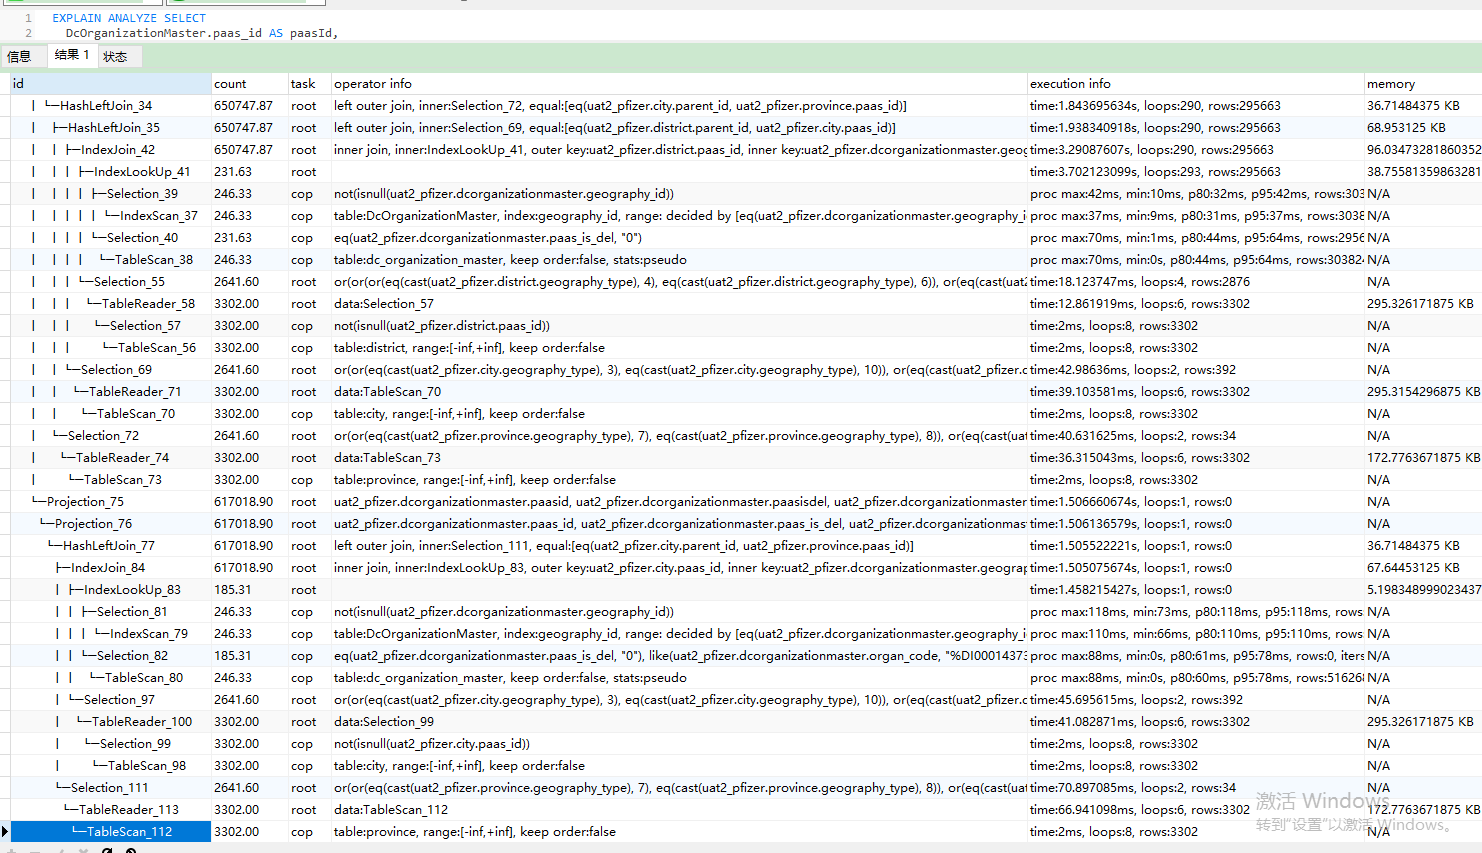
查看执行计划
-
调整后的tidb.yml 文件
我对如下属性进行了修改,并执行ansible-playbook rolling_update.yml --tags=tidb
-
查看tidb.log
-
show variables like ‘tidb_config’ G 确认
mem-quota-query和oom-action已经生效


MySQL [(none)]> show variables like 'tidb_config' G
*************************** 1. row ***************************
Variable_name: tidb_config
        Value: {
        "host": "0.0.0.0",
        "advertise-address": "172.160.180.33",
        "port": 4000,
        "cors": "",
        "store": "tikv",
        "path": "172.160.180.33:2379,172.160.180.34:2379,172.160.180.35:2379",
        "socket": "",
        "lease": "45s",
        "run-ddl": true,
        "split-table": true,
        "token-limit": 1000,
        "oom-action": "cancel",
        "mem-quota-query": 2147483648,
        "enable-streaming": false,
        "txn-local-latches": {
                "enabled": true,
                "capacity": 2048000
        },
        "lower-case-table-names": 2,
        "log": {
                "level": "info",
                "format": "text",
                "disable-timestamp": false,
                "file": {
                        "filename": "/home/tidb/deploy/log/tidb.log",
                        "log-rotate": true,
                        "max-size": 300,
                        "max-days": 0,
                        "max-backups": 0
                },
                "slow-query-file": "/home/tidb/deploy/log/tidb_slow_query.log",
                "slow-threshold": 300,
                "expensive-threshold": 10000,
                "query-log-max-len": 2048
        },
        "security": {
                "skip-grant-table": false,
                "ssl-ca": "",
                "ssl-cert": "",
                "ssl-key": "",
                "cluster-ssl-ca": "",
                "cluster-ssl-cert": "",
                "cluster-ssl-key": ""
        },
        "status": {
                "report-status": true,
                "status-host": "0.0.0.0",
                "status-port": 10080,
                "metrics-addr": "",
                "metrics-interval": 15,
                "record-db-qps": false
        },
        "performance": {
                "max-procs": 0,
                "max-memory": 2,
                "tcp-keep-alive": true,
                "cross-join": true,
                "stats-lease": "3s",
                "run-auto-analyze": true,
                "stmt-count-limit": 5000,
                "feedback-probability": 0.05,
                "query-feedback-limit": 1024,
                "pseudo-estimate-ratio": 0.8,
                "force-priority": "NO_PRIORITY",
                "bind-info-lease": "3s"
        },
        "prepared-plan-cache": {
                "enabled": false,
                "capacity": 100,
                "memory-guard-ratio": 0.1
        },
        "opentracing": {
                "enable": false,
                "sampler": {
                        "type": "const",
                        "param": 1,
                        "sampling-server-url": "",
                        "max-operations": 0,
                        "sampling-refresh-interval": 0
                },
                "reporter": {
                        "queue-size": 0,
                        "buffer-flush-interval": 0,
                        "log-spans": false,
                        "local-agent-host-port": ""
                },
                "rpc-metrics": false
        },
        "proxy-protocol": {
                "networks": "",
                "header-timeout": 5
        },
        "tikv-client": {
                "grpc-connection-count": 16,
                "grpc-keepalive-time": 10,
                "grpc-keepalive-timeout": 3,
                "commit-timeout": "41s",
                "max-txn-time-use": 590,
                "max-batch-size": 128,
                "overload-threshold": 200,
                "max-batch-wait-time": 0,
                "batch-wait-size": 8
        },
        "binlog": {
                "enable": false,
                "write-timeout": "15s",
                "ignore-error": false,
                "binlog-socket": "",
                "strategy": "range"
        },
        "compatible-kill-query": false,
        "plugin": {
                "dir": "",
                "load": ""
        },
        "pessimistic-txn": {
                "enable": false,
                "default": false,
                "max-retry-count": 256,
                "ttl": "30s"
        },
        "check-mb4-value-in-utf8": true,
        "treat-old-version-utf8-as-utf8mb4": true
}
1 row in set (0.00 sec)

MySQL [(none)]>
- 在 tidb.log 中过滤查看 oom-action 已经生效
[2019/09/23 11:09:13.630 +08:00] [INFO] [printer.go:41] ["Welcome to TiDB."] ["Release Version"=v3.0.3] ["Git Commit Hash"=836982c617fbaa42d74616eb9ba9ed4cae46c46b] ["Git Branch"=HEAD] ["UTC Build Time"="2019-08-30 02:42:42"] [GoVersion="go version go1.12 linux/amd64"] ["Race Enabled"=false] ["Check Table Before Drop"=false] ["TiKV Min Version"=v3.0.0-60965b006877ca7234adaced7890d7b029ed1306]
[2019/09/23 11:09:13.631 +08:00] [INFO] [printer.go:54] ["loaded config"] [config="{"host":"0.0.0.0","advertise-address":"172.160.180.33","port":4000,"cors":"","store":"tikv","path":"172.160.180.33:2379,172.160.180.34:2379,172.160.180.35:2379","socket":"","lease":"45s","run-ddl":true,"split-table":true,"token-limit":1000,"oom-action":"cancel","mem-quota-query":2147483648,"enable-streaming":false,"txn-local-latches":{"enabled":true,"capacity":2048000},"lower-case-table-names":2,"log":{"level":"info","format":"text","disable-timestamp":false,"file":{"filename":"/home/tidb/deploy/log/tidb.log","log-rotate":true,"max-size":300,"max-days":0,"max-backups":0},"slow-query-file":"/home/tidb/deploy/log/tidb_slow_query.log","slow-threshold":300,"expensive-threshold":10000,"query-log-max-len":2048},"security":{"skip-grant-table":false,"ssl-ca":"","ssl-cert":"","ssl-key":"","cluster-ssl-ca":"","cluster-ssl-cert":"","cluster-ssl-key":""},"status":{"report-status":true,"status-host":"0.0.0.0","status-port":10080,"metrics-addr":"","metrics-interval":15,"record-db-qps":false},"performance":{"max-procs":0,"max-memory":2,"tcp-keep-alive":true,"cross-join":true,"stats-lease":"3s","run-auto-analyze":true,"stmt-count-limit":5000,"feedback-probability":0.05,"query-feedback-limit":1024,"pseudo-estimate-ratio":0.8,"force-priority":"NO_PRIORITY","bind-info-lease":"3s"},"prepared-plan-cache":{"enabled":false,"capacity":100,"memory-guard-ratio":0.1},"opentracing":{"enable":false,"sampler":{"type":"const","param":1,"sampling-server-url":"","max-operations":0,"sampling-refresh-interval":0},"reporter":{"queue-size":0,"buffer-flush-interval":0,"log-spans":false,"local-agent-host-port":""},"rpc-metrics":false},"proxy-protocol":{"networks":"","header-timeout":5},"tikv-client":{"grpc-connection-count":16,"grpc-keepalive-time":10,"grpc-keepalive-timeout":3,"commit-timeout":"41s","max-txn-time-use":590,"max-batch-size":128,"overload-threshold":200,"max-batch-wait-time":0,"batch-wait-size":8},"binlog":{"enable":false,"write-timeout":"15s","ignore-error":false,"binlog-socket":"","strategy":"range"},"compatible-kill-query":false,"plugin":{"dir":"","load":""},"pessimistic-txn":{"enable":false,"default":false,"max-retry-count":256,"ttl":"30s"},"check-mb4-value-in-utf8":true,"treat-old-version-utf8-as-utf8mb4":true}"]
[2019/09/23 11:09:13.631 +08:00] [INFO] [main.go:250] ["disable Prometheus push client"]
- 升级内存 将内存加到 32GB
8.1 测试脚本: start.sh
#!/bin/bash
for i in {1..30}
do
  nohup mysql -h 172.160.180.33 -u root -P 4000 -p'' dev2_pfizer < script.sql > sql.log &
done
8.2 script.sql 文件是一个查询80万数据的sql
8.3 执行结果如下,当内存增长到32GB时,tidb会自动重启 [2019/09/24 15:16:03.159 +08:00] [INFO] [printer.go:41] [“Welcome to TiDB.”] [“Release Version”=v3.0.3]
[2019/09/24 15:15:39.747 +08:00] [INFO] [coprocessor.go:743] ["[TIME_COP_PROCESS] resp_time:702.125889ms txnStartTS:411385027262152706 region_id:13013 store_addr:172.160.180.51:20160"]
[2019/09/24 15:16:03.073 +08:00] [WARN] [main.go:165] ["config file conf/tidb.toml contained unknown configuration options: mem-quota-hashjoin, mem-quota-indexlookupjoin, mem-quota-indexlookupreader,   mem-quota-mergejoin, mem-quota-nestedloopapply, mem-quota-sort, mem-quota-topn"]
[2019/09/24 15:16:03.159 +08:00] [INFO] [printer.go:41] ["Welcome to TiDB."] ["Release Version"=v3.0.3] ["Git Commit Hash"=836982c617fbaa42d74616eb9ba9ed4cae46c46b] ["Git Branch"=HEAD] ["UTC Build Ti  me"="2019-08-30 02:42:42"] [GoVersion="go version go1.12 linux/amd64"] ["Race Enabled"=false] ["Check Table Before Drop"=false] ["TiKV Min Version"=v3.0.0-60965b006877ca7234adaced7890d7b029ed1306]
[2019/09/24 15:16:03.159 +08:00] [INFO] [printer.go:54] ["loaded config"] [config="{"host":"0.0.0.0","advertise-address":"172.160.180.33","port":4000,"cors":"","store":"tikv","path  ":"172.160.180.33:2379,172.160.180.34:2379,172.160.180.35:2379","socket":"","lease":"45s","run-ddl":true,"split-table":true,"token-limit":1000,"oom-action":"log","mem-quota-quer  y":2147483648,"enable-streaming":false,"txn-local-latches":{"enabled":true,"capacity":2048000},"lower-case-table-names":2,"log":{"level":"info","format":"text","disable-timestam  p":false,"file":{"filename":"/home/tidb/deploy/log/tidb.log","log-rotate":true,"max-size":300,"max-days":0,"max-backups":0},"slow-query-file":"/home/tidb/deploy/log/tidb_slow_query.  log","slow-threshold":300,"expensive-threshold":10000,"query-log-max-len":2048},"security":{"skip-grant-table":false,"ssl-ca":"","ssl-cert":"","ssl-key":"","cluster-ssl-ca":  "","cluster-ssl-cert":"","cluster-ssl-key":""},"status":{"report-status":true,"status-host":"0.0.0.0","status-port":10080,"metrics-addr":"","metrics-interval":15,"record-db-  qps":false},"performance":{"max-procs":0,"max-memory":2,"tcp-keep-alive":true,"cross-join":true,"stats-lease":"3s","run-auto-analyze":true,"stmt-count-limit":5000,"feedback-probab  ility":0.05,"query-feedback-limit":1024,"pseudo-estimate-ratio":0.8,"force-priority":"NO_PRIORITY","bind-info-lease":"3s"},"prepared-plan-cache":{"enabled":false,"capacity":100,"m  emory-guard-ratio":0.1},"opentracing":{"enable":false,"sampler":{"type":"const","param":1,"sampling-server-url":"","max-operations":0,"sampling-refresh-interval":0},"reporter":  {"queue-size":0,"buffer-flush-interval":0,"log-spans":false,"local-agent-host-port":""},"rpc-metrics":false},"proxy-protocol":{"networks":"","header-timeout":5},"tikv-client":{  "grpc-connection-count":16,"grpc-keepalive-time":10,"grpc-keepalive-timeout":3,"commit-timeout":"41s","max-txn-time-use":590,"max-batch-size":128,"overload-threshold":200,"max-batch-w  ait-time":0,"batch-wait-size":8},"binlog":{"enable":false,"write-timeout":"15s","ignore-error":false,"binlog-socket":"","strategy":"range"},"compatible-kill-query":false,"plug  in":{"dir":"","load":""},"pessimistic-txn":{"enable":false,"default":false,"max-retry-count":256,"ttl":"30s"},"check-mb4-value-in-utf8":true,"treat-old-version-utf8-as-utf8mb4  ":true}"]
[2019/09/24 15:16:03.160 +08:00] [INFO] [main.go:250] ["disable Prometheus push client"]
[2019/09/24 15:16:03.160 +08:00] [INFO] [store.go:69] ["new store"] [path=tikv://172.160.180.33:2379,172.160.180.34:2379,172.160.180.35:2379]
[2019/09/24 15:16:03.160 +08:00] [INFO] [client.go:148] ["[pd] create pd client with endpoints"] [pd-address="[172.160.180.33:2379,172.160.180.34:2379,172.160.180.35:2379]"]
[2019/09/24 15:16:03.160 +08:00] [INFO] [systime_mon.go:26] ["start system time monitor"]
[2019/09/24 15:16:03.421 +08:00] [ERROR] [client.go:204] ["[pd] failed to get cluster id"] [error="rpc error: code = Unavailable desc = all SubConns are in TransientFailure, latest connection error:   connection error: desc = "transport: Error while dialing dial tcp 172.160.180.33:2379: connect: connection refused""] [errorVerbose="rpc error: code = Unavailable desc = all SubConns are in Transie  ntFailure, latest connection error: connection error: desc = "transport: Error while dialing dial tcp 172.160.180.33:2379: connect: connection refused"
github.com/pingcap/pd/client.(*client).getMe  mbers
	/home/jenkins/workspace/release_tidb_3.0/go/pkg/mod/github.com/pingcap/pd@v0.0.0-20190711034019-ee98bf9063e9/client/client.go:239
github.com/pingcap/pd/client.(*client).initClusterID
	/ho  me/jenkins/workspace/release_tidb_3.0/go/pkg/mod/github.com/pingcap/pd@v0.0.0-20190711034019-ee98bf9063e9/client/client.go:201
github.com/pingcap/pd/client.(*client).initRetry
	/home/jenkins/works  pace/release_tidb_3.0/go/pkg/mod/github.com/pingcap/pd@v0.0.0-20190711034019-ee98bf9063e9/client/client.go:188
github.com/pingcap/pd/client.NewClient
	/home/jenkins/workspace/release_tidb_3.0/go/p  kg/mod/github.com/pingcap/pd@v0.0.0-20190711034019-ee98bf9063e9/client/client.go:161
github.com/pingcap/tidb/store/tikv.Driver.Open
	/home/jenkins/workspace/release_tidb_3.0/go/src/github.com/ping  cap/tidb/store/tikv/kv.go:78
github.com/pingcap/tidb/store.newStoreWithRetry.func1
	/home/jenkins/workspace/release_tidb_3.0/go/src/github.com/pingcap/tidb/store/store.go:70
github.com/pingcap/ti  db/util.RunWithRetry
	/home/jenkins/workspace/release_tidb_3.0/go/src/github.com/pingcap/tidb/util/misc.go:46
github.com/pingcap/tidb/store.newStoreWithRetry
	/home/jenkins/workspace/release_tid  b_3.0/go/src/github.com/pingcap/tidb/store/store.go:68
github.com/pingcap/tidb/store.New
	/home/jenkins/workspace/release_tidb_3.0/go/src/github.com/pingcap/tidb/store/store.go:52
main.createStor  eAndDomain
	/home/jenkins/workspace/release_tidb_3.0/go/src/github.com/pingcap/tidb/tidb-server/main.go:202
main.main
	/home/jenkins/workspace/release_tidb_3.0/go/src/github.com/pingcap/tidb/tid  b-server/main.go:171
runtime.main
	/usr/local/go/src/runtime/proc.go:200
runtime.goexit
	/usr/local/go/src/runtime/asm_amd64.s:1337"] [stack="github.com/pingcap/log.Error
	/home/jenkins/works  pace/release_tidb_3.0/go/pkg/mod/github.com/pingcap/log@v0.0.0-20190307075452-bd41d9273596/global.go:42
github.com/pingcap/pd/client.(*client).initClusterID
	/home/jenkins/workspace/release_tidb_3  .0/go/pkg/mod/github.com/pingcap/pd@v0.0.0-20190711034019-ee98bf9063e9/client/client.go:204
github.com/pingcap/pd/client.(*client).initRetry
	/home/jenkins/workspace/release_tidb_3.0/go/pkg/mod/gi  thub.com/pingcap/pd@v0.0.0-20190711034019-ee98bf9063e9/client/client.go:188
github.com/pingcap/pd/client.NewClient
	/home/jenkins/workspace/release_tidb_3.0/go/pkg/mod/github.com/pingcap/pd@v0.0.0  -20190711034019-ee98bf9063e9/client/client.go:161
github.com/pingcap/tidb/store/tikv.Driver.Open
	/home/jenkins/workspace/release_tidb_3.0/go/src/github.com/pingcap/tidb/store/tikv/kv.go:78
githu  b.com/pingcap/tidb/store.newStoreWithRetry.func1
	/home/jenkins/workspace/release_tidb_3.0/go/src/github.com/pingcap/tidb/store/store.go:70
github.com/pingcap/tidb/util.RunWithRetry
	/home/jenki  ns/workspace/release_tidb_3.0/go/src/github.com/pingcap/tidb/util/misc.go:46
github.com/pingcap/tidb/store.newStoreWithRetry
	/home/jenkins/workspace/release_tidb_3.0/go/src/github.com/pingcap/tid  b/store/store.go:68
github.com/pingcap/tidb/store.New
	/home/jenkins/workspace/release_tidb_3.0/go/src/github.com/pingcap/tidb/store/store.go:52
main.createStoreAndDomain
	/home/jenkins/workspa  ce/release_tidb_3.0/go/src/github.com/pingcap/tidb/tidb-server/main.go:202
main.main
	/home/jenkins/workspace/release_tidb_3.0/go/src/github.com/pingcap/tidb/tidb-server/main.go:171
runtime.main  n	/usr/local/go/src/runtime/proc.go:200"]
[2019/09/24 15:16:03.425 +08:00] [INFO] [client.go:256] ["[pd] switch leader"] [new-leader=http://172.160.180.35:2379] [old-leader=]
- 升级内存 将内存加到 64GB
9.1 测试脚本: start.sh
#!/bin/bash
for i in {1..30}
do
  nohup mysql -h 172.160.180.33 -u root -P 4000 -p'' dev2_pfizer < script.sql > sql.log &
done
9.2 script.sql 文件是一个查询80万数据的sql
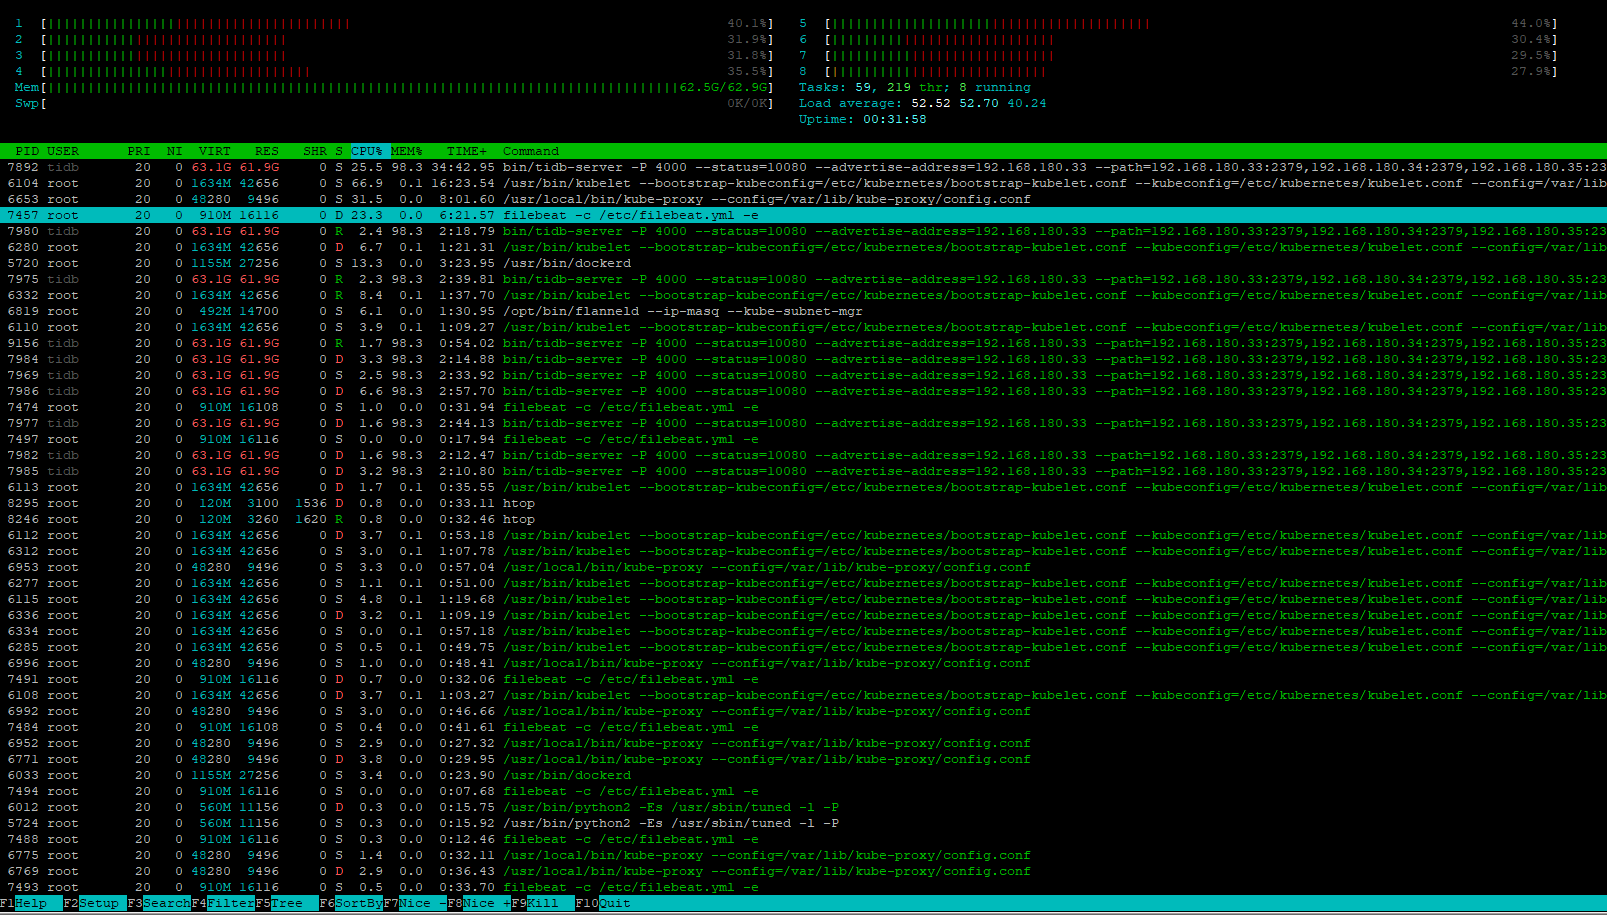
9.3 执行结果如下,当内存增长到64GB时,虚拟机卡死
[2019/09/24 15:28:46.143 +08:00] [INFO] [coprocessor.go:743] ["[TIME_COP_PROCESS] resp_time:893.221943ms txnStartTS:411385229191675934 region_id:33049 store_addr:172.160.180.53:20160 backoff_ms:478 backoff_types:[updateLeader,tikvRPC,tikvRPC,updateLeader,updateLeader,regionMiss,tikvRPC]"]
[2019/09/24 15:28:46.156 +08:00] [INFO] [coprocessor.go:743] ["[TIME_COP_PROCESS] resp_time:1.836637904s txnStartTS:411385229191675918 region_id:33061 store_addr:172.160.180.53:20160 backoff_ms:525 backoff_types:[tikvRPC,tikvRPC,updateLeader,tikvRPC]"]
[2019/09/24 15:28:46.215 +08:00] [INFO] [coprocessor.go:743] ["[TIME_COP_WAIT] resp_time:11.919865025s txnStartTS:411385229191675918 region_id:33065 store_addr:172.160.180.53:20160 backoff_ms:6803 backoff_types:[tikvRPC,tikvRPC,tikvRPC,tikvRPC,tikvRPC,tikvRPC,tikvRPC,tikvRPC] kv_wait_ms:246"]
[2019/09/24 15:28:46.223 +08:00] [INFO] [set.go:190] ["set session var"] [conn=33] [name=autocommit] [val=0]
[2019/09/24 15:28:46.228 +08:00] [INFO] [set.go:190] ["set session var"] [conn=33] [name=autocommit] [val=1]
[2019/09/24 15:28:46.284 +08:00] [INFO] [coprocessor.go:743] ["[TIME_COP_WAIT] resp_time:728.950552ms txnStartTS:411385229191675919 region_id:33065 store_addr:172.160.180.53:20160 backoff_ms:102 backoff_types:[updateLeader,tikvRPC,regionMiss] kv_wait_ms:248"]
[2019/09/24 15:28:46.284 +08:00] [INFO] [coprocessor.go:743] ["[TIME_COP_WAIT] resp_time:14.641365218s txnStartTS:411385229191675919 region_id:33061 store_addr:172.160.180.53:20160 backoff_ms:7732 backoff_types:[tikvRPC,tikvRPC,tikvRPC,updateLeader,tikvRPC,tikvRPC,tikvRPC,tikvRPC,tikvRPC,tikvRPC] kv_wait_ms:255"]
[2019/09/24 15:28:46.315 +08:00] [INFO] [coprocessor.go:743] ["[TIME_COP_WAIT] resp_time:7.095104767s txnStartTS:411385229191675923 region_id:33049 store_addr:172.160.180.53:20160 backoff_ms:8225 backoff_types:[tikvRPC,tikvRPC,updateLeader,tikvRPC,tikvRPC,tikvRPC,regionMiss,tikvRPC,tikvRPC,tikvRPC] kv_wait_ms:313"]
[2019/09/24 15:28:46.370 +08:00] [INFO] [coprocessor.go:743] ["[TIME_COP_WAIT] resp_time:1.118174137s txnStartTS:411385229204783135 region_id:33065 store_addr:172.160.180.53:20160 kv_wait_ms:294"]
[2019/09/24 15:28:46.373 +08:00] [INFO] [coprocessor.go:743] ["[TIME_COP_WAIT] resp_time:831.675513ms txnStartTS:411385229204783128 region_id:33061 store_addr:172.160.180.53:20160 kv_wait_ms:326"]
[2019/09/24 15:28:46.373 +08:00] [INFO] [coprocessor.go:743] ["[TIME_COP_WAIT] resp_time:830.765103ms txnStartTS:411385229204783131 region_id:33061 store_addr:172.160.180.53:20160 backoff_ms:296 backoff_types:[tikvRPC,tikvRPC,updateLeader,regionMiss] kv_wait_ms:371"]
[2019/09/24 15:28:46.388 +08:00] [INFO] [coprocessor.go:743] ["[TIME_COP_WAIT] resp_time:2.070049963s txnStartTS:411385229191675918 region_id:33049 store_addr:172.160.180.53:20160 backoff_ms:517 backoff_types:[tikvRPC,tikvRPC,tikvRPC,updateLeader] kv_wait_ms:313"]
[2019/09/24 15:28:46.390 +08:00] [INFO] [region_cache.go:534] ["switch region leader to specific leader due to kv return NotLeader"] [regionID=11833] [currIdx=0] [leaderStoreID=2]
[2019/09/24 15:28:46.400 +08:00] [INFO] [region_cache.go:285] ["invalidate current region, because others failed on same store"] [region=11833] [store=172.160.180.53:20160]
[2019/09/24 15:28:46.400 +08:00] [INFO] [coprocessor.go:743] ["[TIME_COP_PROCESS] resp_time:534.388443ms txnStartTS:411385233333551106 region_id:11833 store_addr:172.160.180.52:20160 backoff_ms:952 backoff_types:[regionMiss,tikvRPC,updateLeader,regionMiss,tikvRPC,updateLeader,regionMiss,tikvRPC,updateLeader,regionMiss,tikvRPC,updateLeader]"]
[2019/09/24 15:28:46.405 +08:00] [INFO] [coprocessor.go:743] ["[TIME_COP_WAIT] resp_time:862.557361ms txnStartTS:411385229191675919 region_id:33061 store_addr:172.160.180.53:20160 kv_wait_ms:335"]
[2019/09/24 15:28:47.364 +08:00] [INFO] [coprocessor.go:743] ["[TIME_COP_WAIT] resp_time:3.615901519s txnStartTS:411385229191675924 region_id:33065 store_addr:172.160.180.53:20160 backoff_ms:6268 backoff_types:[tikvRPC,tikvRPC,updateLeader,tikvRPC,tikvRPC,tikvRPC,updateLeader,tikvRPC,tikvRPC,regionMiss,regionMiss,updateLeader,tikvRPC] kv_wait_ms:420"]
[2019/09/24 15:28:47.364 +08:00] [INFO] [coprocessor.go:743] ["[TIME_COP_WAIT] resp_time:14.087808668s txnStartTS:411385229191675920 region_id:33049 store_addr:172.160.180.53:20160 backoff_ms:6849 backoff_types:[tikvRPC,tikvRPC,tikvRPC,updateLeader,tikvRPC,tikvRPC,tikvRPC,tikvRPC,tikvRPC,updateLeader] kv_wait_ms:389"]
[2019/09/24 15:28:47.364 +08:00] [INFO] [coprocessor.go:743] ["[TIME_COP_WAIT] resp_time:15.714793013s txnStartTS:411385229191675913 region_id:33065 store_addr:172.160.180.53:20160 backoff_ms:7514 backoff_types:[tikvRPC,tikvRPC,tikvRPC,tikvRPC,updateLeader,tikvRPC,tikvRPC,tikvRPC,tikvRPC,tikvRPC] kv_wait_ms:384"]
[2019/09/24 15:28:47.365 +08:00] [INFO] [coprocessor.go:743] ["[TIME_COP_WAIT] resp_time:1.798587502s txnStartTS:411385229204783111 region_id:33065 store_addr:172.160.180.53:20160 backoff_ms:7481 backoff_types:[tikvRPC,tikvRPC,tikvRPC,regionMiss,tikvRPC,updateLeader,regionMiss,tikvRPC,updateLeader,regionMiss,tikvRPC,tikvRPC,tikvRPC,updateLeader,regionMiss] kv_wait_ms:415"]
[2019/09/24 15:28:47.371 +08:00] [INFO] [set.go:190] ["set session var"] [conn=33] [name=autocommit] [val=0]
[2019/09/24 15:28:47.374 +08:00] [INFO] [coprocessor.go:743] ["[TIME_COP_WAIT] resp_time:13.565076597s txnStartTS:411385229191675926 region_id:33061 store_addr:172.160.180.53:20160 backoff_ms:7305 backoff_types:[tikvRPC,tikvRPC,tikvRPC,tikvRPC,tikvRPC,updateLeader,tikvRPC,tikvRPC,tikvRPC,updateLeader] kv_wait_ms:575"]
[2019/09/24 15:28:48.878 +08:00] [INFO] [coprocessor.go:743] ["[TIME_COP_WAIT] resp_time:5.453276495s txnStartTS:411385229191675918 region_id:33049 store_addr:172.160.180.53:20160 backoff_ms:7822 backoff_types:[tikvRPC,tikvRPC,tikvRPC,tikvRPC,tikvRPC,tikvRPC,tikvRPC,regionMiss,tikvRPC,tikvRPC] kv_wait_ms:1029"]
[2019/09/24 15:29:11.795 +08:00] [INFO] [coprocessor.go:743] ["[TIME_COP_WAIT] resp_time:15.751688592s txnStartTS:411385229191675944 region_id:33049 store_addr:172.160.180.53:20160 backoff_ms:7731 backoff_types:[tikvRPC,tikvRPC,tikvRPC,tikvRPC,tikvRPC,tikvRPC,tikvRPC,tikvRPC,updateLeader] kv_wait_ms:579"]
[2019/09/24 15:29:16.652 +08:00] [INFO] [coprocessor.go:743] ["[TIME_COP_WAIT] resp_time:16.461143071s txnStartTS:411385229191675933 region_id:33065 store_addr:172.160.180.53:20160 backoff_ms:7194 backoff_types:[tikvRPC,tikvRPC,tikvRPC,tikvRPC,tikvRPC,updateLeader,tikvRPC,tikvRPC,updateLeader,updateLeader,updateLeader,tikvRPC] kv_wait_ms:530"]
[2019/09/24 15:30:49.633 +08:00] [WARN] [client_batch.go:504] ["wait response is cancelled"] [to=172.160.180.53:20160] [cause="context deadline exceeded"]
结果
执行 80万数据查询, 因为内存不释放,导致工作机宕机
期望
想要 TiDB 根据实际内存的使用情况自动释放内存,不要因此导致工作机资源耗尽而宕机