接上文 TiDB 内存释放问题(一)
【系统版本】
CentOS Linux release 7.6.1810 (Core)
【TiDB 版本】
TiDB-v3.0.3
【集群节点分布】
| HostName | IP | DES | ---- | 内存 |
|---|---|---|---|---|
| dev10 | 192.168.180.32 | 主控机 master | 16G | |
| dev11 | 192.168.180.33 | 监控机 | TiDB, PD | 16G |
| dev12 | 192.168.180.34 | 工作节点 | TiDB, PD | 16G |
| dev17 | 192.168.180.52 | 工作节点 | TiKV1-1 TiKV1-2 TiKV1-3 | 32G |
| dev18 | 192.168.180.53 | 工作节点 | TiDB, PD | 32G |
【数据量 & region 数量 & 副本数】
1 数据量
MySQL [dev2_pfizer]> SELECT COUNT(1) FROM dc_organization_master;
+----------+
| COUNT(1) |
+----------+
|   820218 |
+----------+
1 row in set (0.08 sec)

MySQL [dev2_pfizer]>
2 region 数量
默认
3 副本数
默认
##【问题描述(我做了什么)】
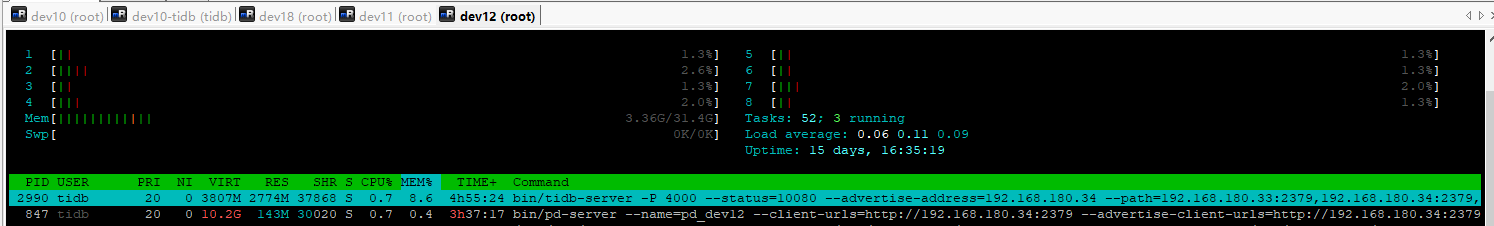
1 单条SQL语句 全量查询数据
MySQL [dev2_pfizer]> SELECT * FROM dc_organization_master;
执行结束后 查看内存使用的结果

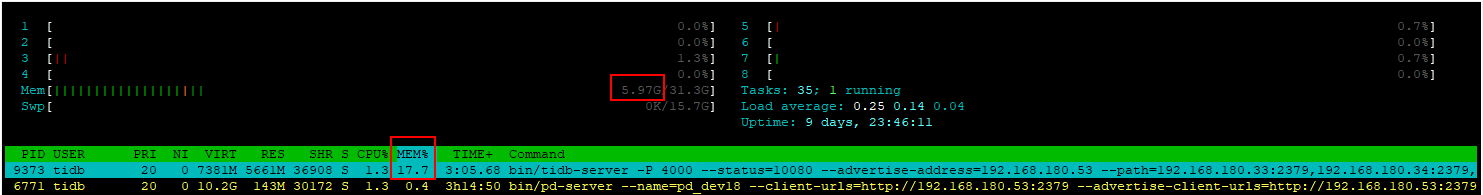
2 第一次查询 并发30条SQL语句 全量查询数据
#!/bin/bash
for i in {1..30}
do
  nohup mysql -h 192.168.180.53 -u root -P 4600 -p'密码' dev2_pfizer < script.sql > sql.log &
done
执行结束后 查看内存使用的结果
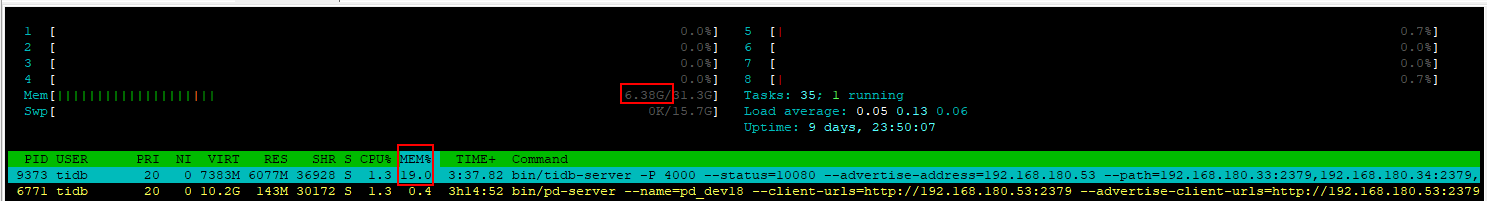
3 第二次查询 并发30条SQL语句 全量查询数据
第二次执行结束后 查看内存使用的结果
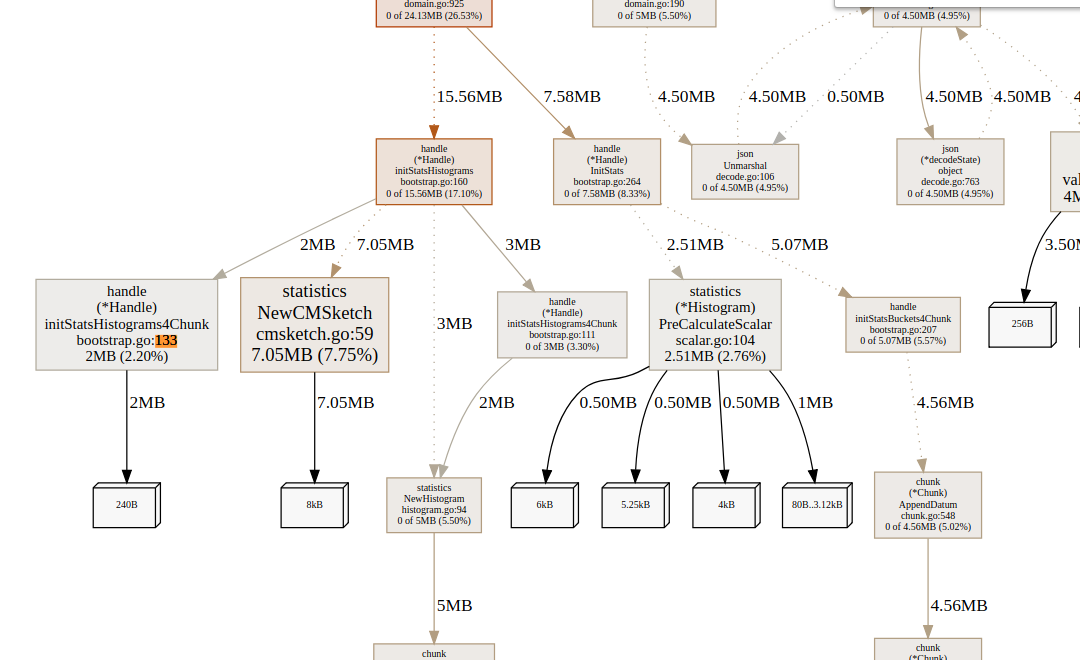
查看 TiDB 内存快照
[tidb@dev10 ~]$ go tool pprof 192.168.180.53:10080/debug/pprof/heap?debug=1
Fetching profile over HTTP from http://192.168.180.53:10080/debug/pprof/heap?debug=1
Saved profile in /home/tidb/pprof/pprof.alloc_objects.alloc_space.inuse_objects.inuse_space.001.pb.gz
Type: inuse_space
Entering interactive mode (type "help" for commands, "o" for options)
(pprof)
(pprof) top
Showing nodes accounting for 2154.93MB, 98.20% of 2194.45MB total
Dropped 136 nodes (cum <= 10.97MB)
Showing top 10 nodes out of 42
      flat  flat%   sum%        cum   cum%
 2089.65MB 95.22% 95.22%  2089.65MB 95.22%  google.golang.org/grpc.(*parser).recvMsg
      48MB  2.19% 97.41%       48MB  2.19%  github.com/pingcap/tidb/store/tikv/latch.NewLatches
   13.29MB  0.61% 98.02%    19.33MB  0.88%  github.com/pingcap/tidb/util/chunk.(*column).appendBytes
       4MB  0.18% 98.20%    13.55MB  0.62%  github.com/pingcap/tidb/statistics/handle.(*Handle).initStatsHistograms4Chunk
         0     0% 98.20%  2089.65MB 95.22%  github.com/pingcap/kvproto/pkg/tikvpb.(*tikvBatchCommandsClient).Recv
         0     0% 98.20%    15.25MB  0.69%  github.com/pingcap/tidb/distsql.(*selectResult).Next
         0     0% 98.20%    15.25MB  0.69%  github.com/pingcap/tidb/distsql.(*selectResult).readRowsData
         0     0% 98.20%    22.68MB  1.03%  github.com/pingcap/tidb/domain.(*Domain).loadStatsWorker
         0     0% 98.20%    15.25MB  0.69%  github.com/pingcap/tidb/executor.(*TableReaderExecutor).Next
         0     0% 98.20%    15.25MB  0.69%  github.com/pingcap/tidb/executor.(*recordSet).Next
(pprof)
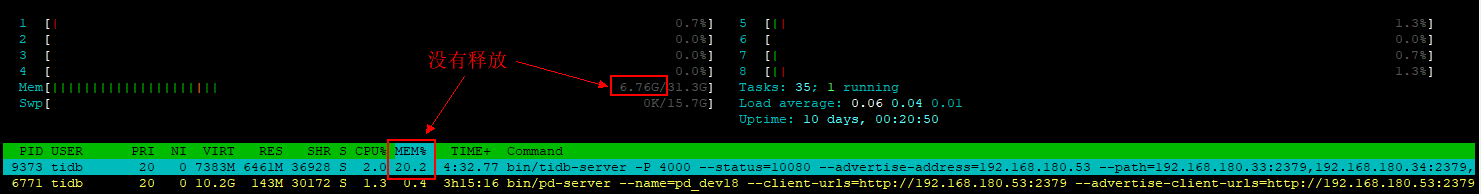
4 第三次查询 并发30条SQL语句 全量查询数据
第三次执行结束后 查看内存使用的结果

查看 TiDB 内存快照
[tidb@dev10 ~]$ go tool pprof 192.168.180.53:10080/debug/pprof/heap?debug=1
Fetching profile over HTTP from http://192.168.180.53:10080/debug/pprof/heap?debug=1
Saved profile in /home/tidb/pprof/pprof.alloc_objects.alloc_space.inuse_objects.inuse_space.002.pb.gz
Type: inuse_space
Entering interactive mode (type "help" for commands, "o" for options)
(pprof)
(pprof) top
Showing nodes accounting for 2412.35MB, 98.28% of 2454.51MB total
Dropped 137 nodes (cum <= 12.27MB)
Showing top 10 nodes out of 26
      flat  flat%   sum%        cum   cum%
 2360.35MB 96.16% 96.16%  2360.35MB 96.16%  google.golang.org/grpc.(*parser).recvMsg
      48MB  1.96% 98.12%       48MB  1.96%  github.com/pingcap/tidb/store/tikv/latch.NewLatches
       4MB  0.16% 98.28%    13.55MB  0.55%  github.com/pingcap/tidb/statistics/handle.(*Handle).initStatsHistograms4Chunk
         0     0% 98.28%  2360.35MB 96.16%  github.com/pingcap/kvproto/pkg/tikvpb.(*tikvBatchCommandsClient).Recv
         0     0% 98.28%    22.17MB   0.9%  github.com/pingcap/tidb/domain.(*Domain).loadStatsWorker
         0     0% 98.28%    22.17MB   0.9%  github.com/pingcap/tidb/statistics/handle.(*Handle).InitStats
         0     0% 98.28%    13.55MB  0.55%  github.com/pingcap/tidb/statistics/handle.(*Handle).initStatsHistograms
         0     0% 98.28%       48MB  1.96%  github.com/pingcap/tidb/store.New
         0     0% 98.28%       48MB  1.96%  github.com/pingcap/tidb/store.newStoreWithRetry
         0     0% 98.28%       48MB  1.96%  github.com/pingcap/tidb/store.newStoreWithRetry.func1
(pprof)
【附加 golang 所有内存快照】
heap profile: 72: 51334328 [31733: 15123849984] @ heap/1048576
1: 50331648 [1: 50331648] @ 0x17c4e8b 0x17c4e58 0x17edc4c 0x17edc3b 0x1bafd08 0x1429b6f 0x1baf5fa 0x1bf825e 0x1bf8247 0x1bf7c20 0xbb8fcc 0xbe6721
#	0x17c4e8a	github.com/pingcap/tidb/store/tikv/latch.NewLatches+0x6a			/home/jenkins/workspace/release_tidb_3.0/go/src/github.com/pingcap/tidb/store/tikv/latch/latch.go:119
#	0x17c4e57	github.com/pingcap/tidb/store/tikv/latch.NewScheduler+0x37			/home/jenkins/workspace/release_tidb_3.0/go/src/github.com/pingcap/tidb/store/tikv/latch/scheduler.go:36
#	0x17edc4b	github.com/pingcap/tidb/store/tikv.(*tikvStore).EnableTxnLocalLatches+0x69b	/home/jenkins/workspace/release_tidb_3.0/go/src/github.com/pingcap/tidb/store/tikv/kv.go:203
#	0x17edc3a	github.com/pingcap/tidb/store/tikv.Driver.Open+0x68a				/home/jenkins/workspace/release_tidb_3.0/go/src/github.com/pingcap/tidb/store/tikv/kv.go:109
#	0x1bafd07	github.com/pingcap/tidb/store.newStoreWithRetry.func1+0x227			/home/jenkins/workspace/release_tidb_3.0/go/src/github.com/pingcap/tidb/store/store.go:70
#	0x1429b6e	github.com/pingcap/tidb/util.RunWithRetry+0x7e					/home/jenkins/workspace/release_tidb_3.0/go/src/github.com/pingcap/tidb/util/misc.go:46
#	0x1baf5f9	github.com/pingcap/tidb/store.newStoreWithRetry+0x179				/home/jenkins/workspace/release_tidb_3.0/go/src/github.com/pingcap/tidb/store/store.go:68
#	0x1bf825d	github.com/pingcap/tidb/store.New+0xed						/home/jenkins/workspace/release_tidb_3.0/go/src/github.com/pingcap/tidb/store/store.go:52
#	0x1bf8246	main.createStoreAndDomain+0xd6							/home/jenkins/workspace/release_tidb_3.0/go/src/github.com/pingcap/tidb/tidb-server/main.go:202
#	0x1bf7c1f	main.main+0x1af									/home/jenkins/workspace/release_tidb_3.0/go/src/github.com/pingcap/tidb/tidb-server/main.go:171
#	0xbb8fcb	runtime.main+0x20b								/usr/local/go/src/runtime/proc.go:200

8: 524288 [8: 524288] @ 0x101c03e 0x101c01c 0x100e5eb 0x10a8fd2 0x10a8f26 0x10a8731 0xbe6721
#	0x101c03d	google.golang.org/grpc/internal/transport.newBufWriter+0xed		/home/jenkins/workspace/release_tidb_3.0/go/pkg/mod/google.golang.org/grpc@v1.17.0/internal/transport/http_util.go:559
#	0x101c01b	google.golang.org/grpc/internal/transport.newFramer+0xcb		/home/jenkins/workspace/release_tidb_3.0/go/pkg/mod/google.golang.org/grpc@v1.17.0/internal/transport/http_util.go:612
#	0x100e5ea	google.golang.org/grpc/internal/transport.newHTTP2Client+0x74a		/home/jenkins/workspace/release_tidb_3.0/go/pkg/mod/google.golang.org/grpc@v1.17.0/internal/transport/http2_client.go:234
#	0x10a8fd1	google.golang.org/grpc/internal/transport.NewClientTransport+0x5a1	/home/jenkins/workspace/release_tidb_3.0/go/pkg/mod/google.golang.org/grpc@v1.17.0/internal/transport/transport.go:515
#	0x10a8f25	google.golang.org/grpc.(*addrConn).createTransport+0x4f5		/home/jenkins/workspace/release_tidb_3.0/go/pkg/mod/google.golang.org/grpc@v1.17.0/clientconn.go:1143
#	0x10a8730	google.golang.org/grpc.(*addrConn).resetTransport+0x530			/home/jenkins/workspace/release_tidb_3.0/go/pkg/mod/google.golang.org/grpc@v1.17.0/clientconn.go:1064

13: 106496 [13: 106496] @ 0x1698801 0x169b0c3 0x169b699 0x169bb18 0x18cbdbf 0x18cc833 0x18cdf22 0x18f3747 0xbe6721
#	0x1698800	github.com/pingcap/tidb/statistics.NewCMSketch+0x90					/home/jenkins/workspace/release_tidb_3.0/go/src/github.com/pingcap/tidb/statistics/cmsketch.go:59
#	0x169b0c2	github.com/pingcap/tidb/statistics.CMSketchFromProto+0x62				/home/jenkins/workspace/release_tidb_3.0/go/src/github.com/pingcap/tidb/statistics/cmsketch.go:387
#	0x169b698	github.com/pingcap/tidb/statistics.decodeCMSketch+0x208					/home/jenkins/workspace/release_tidb_3.0/go/src/github.com/pingcap/tidb/statistics/cmsketch.go:435
#	0x169bb17	github.com/pingcap/tidb/statistics.LoadCMSketchWithTopN+0x3a7				/home/jenkins/workspace/release_tidb_3.0/go/src/github.com/pingcap/tidb/statistics/cmsketch.go:449
#	0x18cbdbe	github.com/pingcap/tidb/statistics/handle.(*Handle).initStatsHistograms4Chunk+0x3fe	/home/jenkins/workspace/release_tidb_3.0/go/src/github.com/pingcap/tidb/statistics/handle/bootstrap.go:106
#	0x18cc832	github.com/pingcap/tidb/statistics/handle.(*Handle).initStatsHistograms+0x192		/home/jenkins/workspace/release_tidb_3.0/go/src/github.com/pingcap/tidb/statistics/handle/bootstrap.go:160
#	0x18cdf21	github.com/pingcap/tidb/statistics/handle.(*Handle).InitStats+0x81			/home/jenkins/workspace/release_tidb_3.0/go/src/github.com/pingcap/tidb/statistics/handle/bootstrap.go:260
#	0x18f3746	github.com/pingcap/tidb/domain.(*Domain).loadStatsWorker+0x1b6				/home/jenkins/workspace/release_tidb_3.0/go/src/github.com/pingcap/tidb/domain/domain.go:925

3: 73728 [3: 73728] @ 0x13ba0f9 0x13b9ed8 0x13b9ea5 0x16a7c4a 0x18ccf18 0x18cda82 0x18cdf4d 0x18f3747 0xbe6721
#	0x13ba0f8	github.com/pingcap/tidb/util/chunk.(*column).appendBytes+0x3b8			/home/jenkins/workspace/release_tidb_3.0/go/src/github.com/pingcap/tidb/util/chunk/column.go:171
#	0x13b9ed7	github.com/pingcap/tidb/util/chunk.(*Chunk).AppendBytes+0x197			/home/jenkins/workspace/release_tidb_3.0/go/src/github.com/pingcap/tidb/util/chunk/chunk.go:500
#	0x13b9ea4	github.com/pingcap/tidb/util/chunk.(*Chunk).AppendDatum+0x164			/home/jenkins/workspace/release_tidb_3.0/go/src/github.com/pingcap/tidb/util/chunk/chunk.go:548
#	0x16a7c49	github.com/pingcap/tidb/statistics.(*Histogram).AppendBucket+0x79		/home/jenkins/workspace/release_tidb_3.0/go/src/github.com/pingcap/tidb/statistics/histogram.go:136
#	0x18ccf17	github.com/pingcap/tidb/statistics/handle.initStatsBuckets4Chunk+0x507		/home/jenkins/workspace/release_tidb_3.0/go/src/github.com/pingcap/tidb/statistics/handle/bootstrap.go:207
#	0x18cda81	github.com/pingcap/tidb/statistics/handle.(*Handle).initStatsBuckets+0x191	/home/jenkins/workspace/release_tidb_3.0/go/src/github.com/pingcap/tidb/statistics/handle/bootstrap.go:232
#	0x18cdf4c	github.com/pingcap/tidb/statistics/handle.(*Handle).InitStats+0xac		/home/jenkins/workspace/release_tidb_3.0/go/src/github.com/pingcap/tidb/statistics/handle/bootstrap.go:264
#	0x18f3746	github.com/pingcap/tidb/domain.(*Domain).loadStatsWorker+0x1b6			/home/jenkins/workspace/release_tidb_3.0/go/src/github.com/pingcap/tidb/domain/domain.go:925

2: 65536 [2: 65536] @ 0x101c28c 0x101bfda 0x100e5eb 0x10a8fd2 0x10a8f26 0x10a8731 0xbe6721
#	0x101c28b	bufio.NewReaderSize+0x33b						/usr/local/go/src/bufio/bufio.go:56
#	0x101bfd9	google.golang.org/grpc/internal/transport.newFramer+0x89		/home/jenkins/workspace/release_tidb_3.0/go/pkg/mod/google.golang.org/grpc@v1.17.0/internal/transport/http_util.go:610
#	0x100e5ea	google.golang.org/grpc/internal/transport.newHTTP2Client+0x74a		/home/jenkins/workspace/release_tidb_3.0/go/pkg/mod/google.golang.org/grpc@v1.17.0/internal/transport/http2_client.go:234
#	0x10a8fd1	google.golang.org/grpc/internal/transport.NewClientTransport+0x5a1	/home/jenkins/workspace/release_tidb_3.0/go/pkg/mod/google.golang.org/grpc@v1.17.0/internal/transport/transport.go:515
#	0x10a8f25	google.golang.org/grpc.(*addrConn).createTransport+0x4f5		/home/jenkins/workspace/release_tidb_3.0/go/pkg/mod/google.golang.org/grpc@v1.17.0/clientconn.go:1143
#	0x10a8730	google.golang.org/grpc.(*addrConn).resetTransport+0x530			/home/jenkins/workspace/release_tidb_3.0/go/pkg/mod/google.golang.org/grpc@v1.17.0/clientconn.go:1064

1: 57344 [1: 57344] @ 0x13ba0f9 0x13b9ed8 0x13b9ea5 0x16a7c6f 0x18ccf18 0x18cda82 0x18cdf4d 0x18f3747 0xbe6721
#	0x13ba0f8	github.com/pingcap/tidb/util/chunk.(*column).appendBytes+0x3b8			/home/jenkins/workspace/release_tidb_3.0/go/src/github.com/pingcap/tidb/util/chunk/column.go:171
#	0x13b9ed7	github.com/pingcap/tidb/util/chunk.(*Chunk).AppendBytes+0x197			/home/jenkins/workspace/release_tidb_3.0/go/src/github.com/pingcap/tidb/util/chunk/chunk.go:500
#	0x13b9ea4	github.com/pingcap/tidb/util/chunk.(*Chunk).AppendDatum+0x164			/home/jenkins/workspace/release_tidb_3.0/go/src/github.com/pingcap/tidb/util/chunk/chunk.go:548
#	0x16a7c6e	github.com/pingcap/tidb/statistics.(*Histogram).AppendBucket+0x9e		/home/jenkins/workspace/release_tidb_3.0/go/src/github.com/pingcap/tidb/statistics/histogram.go:137
#	0x18ccf17	github.com/pingcap/tidb/statistics/handle.initStatsBuckets4Chunk+0x507		/home/jenkins/workspace/release_tidb_3.0/go/src/github.com/pingcap/tidb/statistics/handle/bootstrap.go:207
#	0x18cda81	github.com/pingcap/tidb/statistics/handle.(*Handle).initStatsBuckets+0x191	/home/jenkins/workspace/release_tidb_3.0/go/src/github.com/pingcap/tidb/statistics/handle/bootstrap.go:232
#	0x18cdf4c	github.com/pingcap/tidb/statistics/handle.(*Handle).InitStats+0xac		/home/jenkins/workspace/release_tidb_3.0/go/src/github.com/pingcap/tidb/statistics/handle/bootstrap.go:264
#	0x18f3746	github.com/pingcap/tidb/domain.(*Domain).loadStatsWorker+0x1b6			/home/jenkins/workspace/release_tidb_3.0/go/src/github.com/pingcap/tidb/domain/domain.go:925

0: 0 [1: 6602752] @ 0x13b6176 0x13b60d2 0x13b7297 0x1ab70c8 0x1a84a8d 0x1a327e0 0x18cc86c 0x18cdf22 0x18f3747 0xbe6721
#	0x13b6175	github.com/pingcap/tidb/util/chunk.newVarLenColumn+0x165			/home/jenkins/workspace/release_tidb_3.0/go/src/github.com/pingcap/tidb/util/chunk/chunk.go:149
#	0x13b60d1	github.com/pingcap/tidb/util/chunk.renewColumns+0xc1				/home/jenkins/workspace/release_tidb_3.0/go/src/github.com/pingcap/tidb/util/chunk/chunk.go:112
#	0x13b7296	github.com/pingcap/tidb/util/chunk.(*Chunk).GrowAndReset+0x86			/home/jenkins/workspace/release_tidb_3.0/go/src/github.com/pingcap/tidb/util/chunk/chunk.go:272
#	0x1ab70c7	github.com/pingcap/tidb/executor.(*ProjectionExec).Next+0x97			/home/jenkins/workspace/release_tidb_3.0/go/src/github.com/pingcap/tidb/executor/projection.go:167
#	0x1a84a8c	github.com/pingcap/tidb/executor.Next+0xbc					/home/jenkins/workspace/release_tidb_3.0/go/src/github.com/pingcap/tidb/executor/executor.go:191
#	0x1a327df	github.com/pingcap/tidb/executor.(*recordSet).Next+0xaf				/home/jenkins/workspace/release_tidb_3.0/go/src/github.com/pingcap/tidb/executor/adapter.go:109
#	0x18cc86b	github.com/pingcap/tidb/statistics/handle.(*Handle).initStatsHistograms+0x1cb	/home/jenkins/workspace/release_tidb_3.0/go/src/github.com/pingcap/tidb/statistics/handle/bootstrap.go:153
#	0x18cdf21	github.com/pingcap/tidb/statistics/handle.(*Handle).InitStats+0x81		/home/jenkins/workspace/release_tidb_3.0/go/src/github.com/pingcap/tidb/statistics/handle/bootstrap.go:260
#	0x18f3746	github.com/pingcap/tidb/domain.(*Domain).loadStatsWorker+0x1b6			/home/jenkins/workspace/release_tidb_3.0/go/src/github.com/pingcap/tidb/domain/domain.go:925


# runtime.MemStats
# Alloc = 97320320
# TotalAlloc = 31271004600
# Sys = 7025211128
# Lookups = 0
# Mallocs = 20744433
# Frees = 20492139
# HeapAlloc = 97320320
# HeapSys = 6774882304
# HeapIdle = 6655066112
# HeapInuse = 119816192
# HeapReleased = 5627183104
# HeapObjects = 252294
# Stack = 3112960 / 3112960
# MSpan = 1219248 / 16400384
# MCache = 13888 / 16384
# BuckHashSys = 1786120
# GCSys = 225679360
# OtherSys = 3333616
# NextGC = 184565744
# LastGC = 1570602630720696666
# PauseNs = [12711 2613126 53063 32810 82942 66935 6710 95578 135551 10827 20903 34894 48380 89962 73580 158330 32693 86651 31217 79815 68621 74324 81701 67404 75884 66478 72889 64321 51702 88140 92022 66682 67475 64403 82229 59337 79373 75523 58690 35688 59195 78983 63617 89494 74384 65371 62946 80764 64316 71832 65656 78742 71406 79440 64596 115743 61467 90550 73645 91148 35490 75286 71442 83565 72769 71600 64531 44274 65036 65267 35727 102845 71132 35566 59183 30273 70347 68302 66658 46613 71184 90810 72943 62612 73900 92040 34432 84533 79867 38697 444702 25700 1536752 8542 49757 27345 72533 5596190 6131 5609016 2187321 4922620 6696 2042402 8176 11348 8346 9844 43433 71173 10174 466913 2282030 7632 8342 8939 13688 242371 53251 71561 2553856 2072713 2078116 2003088 9444 10126 64312 44298 1865234 2189485 57415 2070263 7850 2502781 18585 71997 45708 41110 26676 18183 0 0 0 0 0 0 0 0 0 0 0 0 0 0 0 0 0 0 0 0 0 0 0 0 0 0 0 0 0 0 0 0 0 0 0 0 0 0 0 0 0 0 0 0 0 0 0 0 0 0 0 0 0 0 0 0 0 0 0 0 0 0 0 0 0 0 0 0 0 0 0 0 0 0 0 0 0 0 0 0 0 0 0 0 0 0 0 0 0 0 0 0 0 0 0 0 0 0 0 0 0 0 0 0 0 0 0 0 0 0 0 0 0 0 0 0]
# PauseEnd = [1570591368933691348 1570591368939215823 1570591368941997357 1570591369007737863 1570591369177631209 1570591369311417633 1570591369536805638 1570591370821162075 1570591371913485152 1570591371988944271 1570591492022885720 1570591612030724150 1570591732055375107 1570591852068074248 1570591972086152078 1570592092099258176 1570592212115785693 1570592332142938151 1570592452153322708 1570592572190516224 1570592692221006540 1570592812240396052 1570592932263712506 1570593052290112194 1570593172316815889 1570593292340039536 1570593412356480406 1570593532414859342 1570593652443335050 1570593772459499328 1570593892489946996 1570594012516247934 1570594132543591076 1570594252567329596 1570594372592406380 1570594492618119971 1570594612640218686 1570594732660562524 1570594852687611630 1570594972718201243 1570595092744054957 1570595212771957244 1570595332798540541 1570595452817828935 1570595572842336009 1570595692863656048 1570595812889963077 1570595932917289887 1570596052938554373 1570596172951838625 1570596292964745436 1570596413017525082 1570596533042840792 1570596653063039289 1570596773089486910 1570596893103973446 1570597013116189139 1570597133140617657 1570597253151934051 1570597373214588841 1570597493239924945 1570597613263722450 1570597733286633173 1570597853318456115 1570597973344144688 1570598093387014468 1570598213412113586 1570598333435228061 1570598453463415358 1570598573484765689 1570598693521134058 1570598813538716778 1570598933553689624 1570599053595235111 1570599173621091881 1570599293637994686 1570599413663017766 1570599533685754777 1570599653716626259 1570599773738060161 1570599893753629852 1570600013800062140 1570600133816559868 1570600253841081651 1570600373863540172 1570600493889926194 1570600613914907304 1570600733940455357 1570600853951606719 1570600973965429717 1570601004889484593 1570601005020883642 1570601024117747880 1570601026078226382 1570601042320837274 1570601099897617075 1570601219921064114 1570601247329469911 1570601247756822485 1570601260394673067 1570601260423157418 1570601272221394019 1570601272369004581 1570601285399210476 1570601286746763292 1570601339877465995 1570601341235691330 1570601350097765929 1570601351674084732 1570601471684911042 1570601570132686506 1570601570519806122 1570601570860047182 1570601571093767112 1570601572848470536 1570601579789972315 1570601592080939952 1570601608814165176 1570601728836130344 1570601757999281847 1570601758653481634 1570601758863449156 1570601759380584983 1570601760545063663 1570601767667480366 1570601782410961414 1570601902443442676 1570601988882515753 1570601989144665681 1570601989634212654 1570601989945967084 1570601991093891891 1570601997061995809 1570602014030365953 1570602030553860182 1570602150620788326 1570602270639316799 1570602390658734042 1570602510686066885 1570602630720696666 0 0 0 0 0 0 0 0 0 0 0 0 0 0 0 0 0 0 0 0 0 0 0 0 0 0 0 0 0 0 0 0 0 0 0 0 0 0 0 0 0 0 0 0 0 0 0 0 0 0 0 0 0 0 0 0 0 0 0 0 0 0 0 0 0 0 0 0 0 0 0 0 0 0 0 0 0 0 0 0 0 0 0 0 0 0 0 0 0 0 0 0 0 0 0 0 0 0 0 0 0 0 0 0 0 0 0 0 0 0 0 0 0 0 0 0]
# NumGC = 140
# NumForcedGC = 0
# GCCPUFraction = 2.8487013339187e-05
# DebugGC = false
【间隔一段时间后】
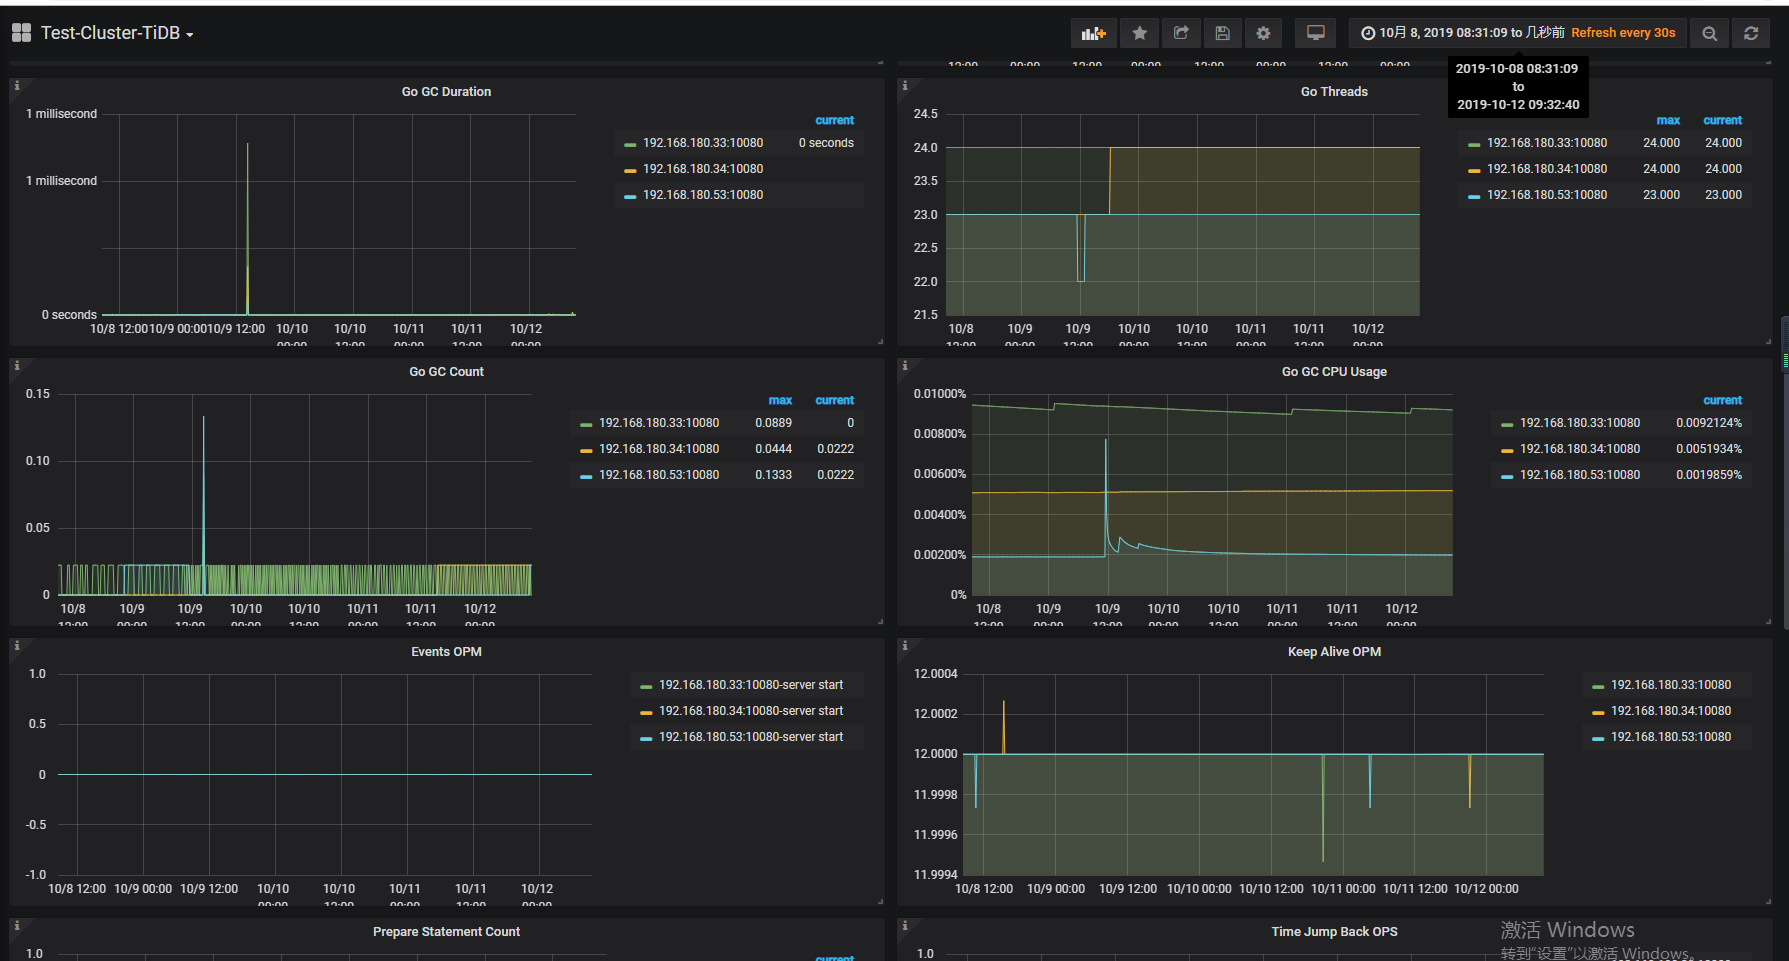
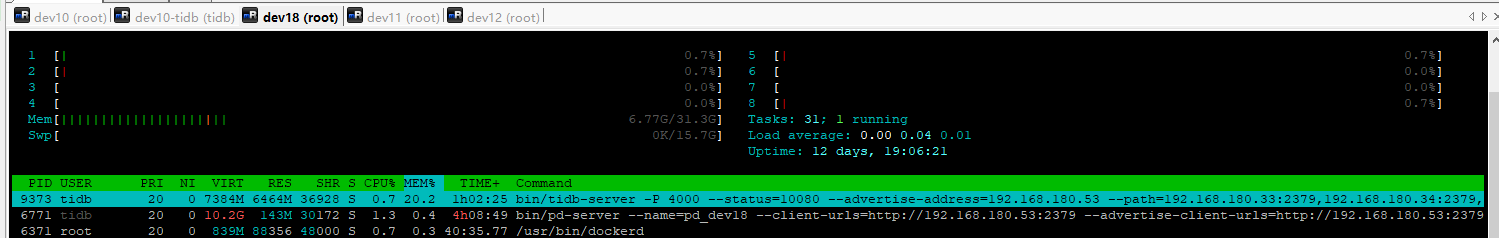
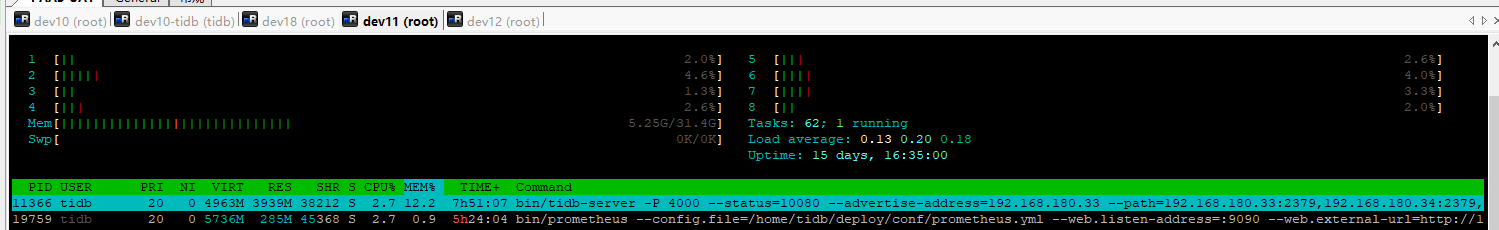
查看内存使用情况
查看内存快照
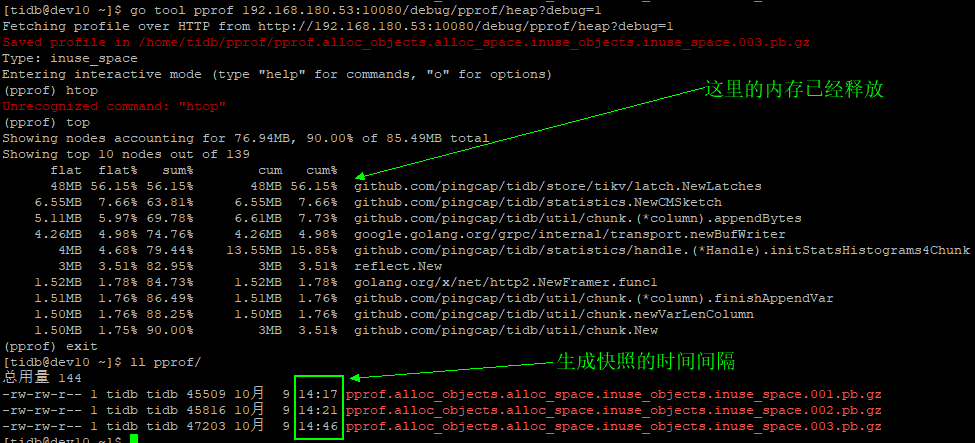
【内存使用会持续累加】
【测试内存是否真的被占用】
内存压测语句
stress --cpu 8 --io 4 --vm 10 --vm-bytes 1G --vm-hang 100 -t 100s
内存压测结果