explain_analyze.txt (15.3 KB)
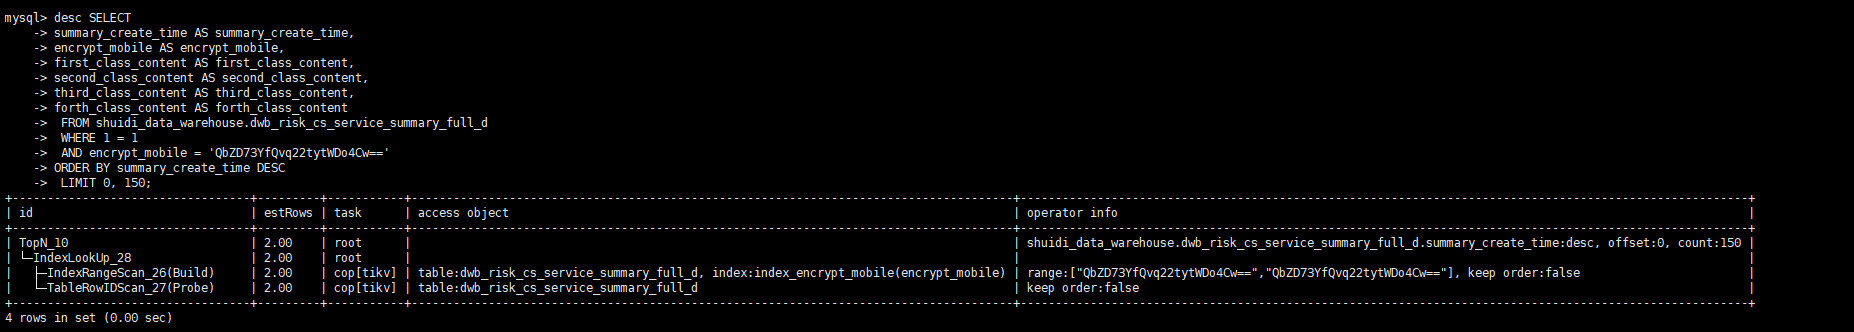
加完后的执行计划,感觉耗时稍微高了点。多了一步。
±-----------------------------------±--------±--------±----------±--------------------------------------------------------------------------------------------------------±------------------------------------------------------------------------------------------------------------------------------------------------------------------------------------------------------------------------------------------------------------------------------------------------------------------------------------------------±-------------------------------------------------------------------------------------------------------------------------------------------------------------------------------------------------------------------------------------------------------------------------------------------------------------------------------------------------------------------------------------------------------------------------------------------------------------------------------±----------±-----+
| id | estRows | actRows | task | access object | execution info | operator info | memory | disk |
±-----------------------------------±--------±--------±----------±--------------------------------------------------------------------------------------------------------±------------------------------------------------------------------------------------------------------------------------------------------------------------------------------------------------------------------------------------------------------------------------------------------------------------------------------------------------±-------------------------------------------------------------------------------------------------------------------------------------------------------------------------------------------------------------------------------------------------------------------------------------------------------------------------------------------------------------------------------------------------------------------------------------------------------------------------------±----------±-----+
| Limit_13 | 2.00 | 0 | root | | time:497.9µs, loops:1 | offset:0, count:150 | N/A | N/A |
| └─Projection_38 | 2.50 | 0 | root | | time:497.1µs, loops:1, Concurrency:OFF | shuidi_data_warehouse.dwb_risk_cs_service_summary_full_d.summary_create_time, shuidi_data_warehouse.dwb_risk_cs_service_summary_full_d.encrypt_mobile, shuidi_data_warehouse.dwb_risk_cs_service_summary_full_d.first_class_content, shuidi_data_warehouse.dwb_risk_cs_service_summary_full_d.second_class_content, shuidi_data_warehouse.dwb_risk_cs_service_summary_full_d.third_class_content, shuidi_data_warehouse.dwb_risk_cs_service_summary_full_d.forth_class_content | 3.79 KB | N/A |
| └─IndexLookUp_37 | 2.50 | 0 | root | | time:496.3µs, loops:1, table_task: {total_time: 7.43ms, num: 0, concurrency: 16} | | 216 Bytes | N/A |
| ├─Limit_36(Build) | 2.50 | 0 | cop[tikv] | | time:445.2µs, loops:1, cop_task: {num: 1, max: 405µs, proc_keys: 0, rpc_num: 1, rpc_time: 387.6µs, copr_cache_hit_ratio: 0.00}, tikv_task:{time:0s, loops:1}, scan_detail: {total_process_keys: 0, total_keys: 1, rocksdb: {delete_skipped_count: 0, key_skipped_count: 0, block: {cache_hit_count: 16, read_count: 0, read_byte: 0 Bytes}}} | offset:0, count:150 | N/A | N/A |
| │ └─IndexRangeScan_34 | 2.50 | 0 | cop[tikv] | table:dwb_risk_cs_service_summary_full_d, index:index_encrypt_time(encrypt_mobile, summary_create_time) | tikv_task:{time:0s, loops:1}, scan_detail: {total_process_keys: 0, total_keys: 0, rocksdb: {delete_skipped_count: 0, key_skipped_count: 0, block: {cache_hit_count: 0, read_count: 0, read_byte: 0 Bytes}}} | range:[“QbZD73YfQvq22tytWDo4Cw==”,“QbZD73YfQvq22tytWDo4Cw==”], keep order:true, desc | N/A | N/A |
| └─TableRowIDScan_35(Probe) | 2.50 | 0 | cop[tikv] | table:dwb_risk_cs_service_summary_full_d | | keep order:false, stats:pseudo | N/A | N/A |
±-----------------------------------±--------±--------±----------±--------------------------------------------------------------------------------------------------------±------------------------------------------------------------------------------------------------------------------------------------------------------------------------------------------------------------------------------------------------------------------------------------------------------------------------------------------------±-------------------------------------------------------------------------------------------------------------------------------------------------------------------------------------------------------------------------------------------------------------------------------------------------------------------------------------------------------------------------------------------------------------------------------------------------------------------------------±----------±-----+
6 rows in set (0.00 sec)