[tidb@db33 ~]$ tiup list
Available components:
Name               Owner    Description
----               -----    -----------
PCC                pingcap  A tool used to capture plan changes among different versions of TiDB
alertmanager       pingcap  Prometheus alertmanager
bench              pingcap  Benchmark database with different workloads
blackbox_exporter  pingcap  Blackbox prober exporter
br                 pingcap  TiDB/TiKV cluster backup restore tool
cdc                pingcap  CDC is a change data capture tool for TiDB
cluster            pingcap  Deploy a TiDB cluster for production
ctl                pingcap  TiDB controller suite
dba                pingcap  dbatoolset
diag               pingcap  Clinic client for data collection and quick health check
dm                 pingcap  Data Migration Platform manager
dm-master          pingcap  dm-master component of Data Migration Platform
dm-worker          pingcap  dm-worker component of Data Migration Platform
dmctl              pingcap  dmctl component of Data Migration Platform
drainer            pingcap  The drainer componet of TiDB binlog service
dumpling           pingcap  Dumpling is a CLI tool that helps you dump MySQL/TiDB data
errdoc             pingcap  Document about TiDB errors
grafana            pingcap  Grafana is the open source analytics & monitoring solution for every database
influxdb           pingcap  InfluxDB
insight            pingcap  TiDB-Insight collector
node_exporter      pingcap  Exporter for machine metrics
package            pingcap  A toolbox to package tiup component
pd                 pingcap  PD is the abbreviation for Placement Driver. It is used to manage and schedule the TiKV cluster
pd-recover         pingcap  PD Recover is a disaster recovery tool of PD, used to recover the PD cluster which cannot start or provide services normally
playground         pingcap  Bootstrap a local TiDB cluster for fun
prometheus         pingcap  The Prometheus monitoring system and time series database
pump               pingcap  The pump componet of TiDB binlog service
server             pingcap  TiUP publish/cache server
spark              pingcap  Spark is a fast and general cluster computing system for Big Data
tidb               pingcap  TiDB is an open source distributed HTAP database compatible with the MySQL protocol
tidb-lightning     pingcap  TiDB Lightning is a tool used for fast full import of large amounts of data into a TiDB cluster
tiflash            pingcap  The TiFlash Columnar Storage Engine
tikv               pingcap  Distributed transactional key-value database, originally created to complement TiDB
tikv-importer      pingcap
tispark            pingcap  tispark
tiup               pingcap  TiUP is a command-line component management tool that can help to download and install TiDB platform components to the local system
# # Global variables are applied to all deployments and used as the default value of
# # the deployments if a specific deployment value is missing.
global:
# # The user who runs the tidb cluster.
user: "tidb"
# # group is used to specify the group name the user belong to,if it's not the same as user.
# group: "tidb"
# # SSH port of servers in the managed cluster.
ssh_port: 22
# # Storage directory for cluster deployment files, startup scripts, and configuration files.
deploy_dir: "/tidb/app/deploy"
# # TiDB Cluster data storage directory
data_dir: "/tidb/app/data"
# # Supported values: "amd64", "arm64" (default: "amd64")
arch: "amd64"
# # Resource Control is used to limit the resource of an instance.
# # See: https://www.freedesktop.org/software/systemd/man/systemd.resource-control.html
# # Supports using instance-level `resource_control` to override global `resource_control`.
# resource_control:
# # See: https://www.freedesktop.org/software/systemd/man/systemd.resource-control.html#MemoryLimit=bytes
# memory_limit: "2G"
# # See: https://www.freedesktop.org/software/systemd/man/systemd.resource-control.html#CPUQuota=
# # The percentage specifies how much CPU time the unit shall get at maximum, relative to the total CPU time available on one CPU. Use values > 100% for allotting CPU time on more than one CPU.
# # Example: CPUQuota=200% ensures that the executed processes will never get more than two CPU time.
# cpu_quota: "200%"
# # See: https://www.freedesktop.org/software/systemd/man/systemd.resource-control.html#IOReadBandwidthMax=device%20bytes
# io_read_bandwidth_max: "/dev/disk/by-path/pci-0000:00:1f.2-scsi-0:0:0:0 100M"
# io_write_bandwidth_max: "/dev/disk/by-path/pci-0000:00:1f.2-scsi-0:0:0:0 100M"
# # Monitored variables are applied to all the machines.
monitored:
# # The communication port for reporting system information of each node in the TiDB cluster.
node_exporter_port: 9100
# # Blackbox_exporter communication port, used for TiDB cluster port monitoring.
blackbox_exporter_port: 9115
# # Storage directory for deployment files, startup scripts, and configuration files of monitoring components.
# deploy_dir: "/tidb-deploy/monitored-9100"
# # Data storage directory of monitoring components.
# data_dir: "/tidb-data/monitored-9100"
# # Log storage directory of the monitoring component.
# log_dir: "/tidb-deploy/monitored-9100/log"
# # Server configs are used to specify the runtime configuration of TiDB components.
# # All configuration items can be found in TiDB docs:
# # - TiDB: https://pingcap.com/docs/stable/reference/configuration/tidb-server/configuration-file/
# # - TiKV: https://pingcap.com/docs/stable/reference/configuration/tikv-server/configuration-file/
# # - PD: https://pingcap.com/docs/stable/reference/configuration/pd-server/configuration-file/
# # - TiFlash: https://docs.pingcap.com/tidb/stable/tiflash-configuration
# #
# # All configuration items use points to represent the hierarchy, e.g:
# # readpool.storage.use-unified-pool
# # ^ ^
# # - example: https://github.com/pingcap/tiup/blob/master/embed/examples/cluster/topology.example.yaml
# # You can overwrite this configuration via the instance-level `config` field.
# server_configs:
# tidb:
# tikv:
# pd:
# tiflash:
# tiflash-learner:
# kvcdc:
# # Server configs are used to specify the configuration of PD Servers.
pd_servers:
# # The ip address of the PD Server.
- host: 192.168.0.31
# # SSH port of the server.
# ssh_port: 22
# # PD Server name
# name: "pd-1"
# # communication port for TiDB Servers to connect.
# client_port: 2379
# # communication port among PD Server nodes.
# peer_port: 2380
# # PD Server deployment file, startup script, configuration file storage directory.
deploy_dir: "/tidb/app/deploy/pd-2379"
# # PD Server data storage directory.
data_dir: "/tidb/app/data/pd-2379"
# # PD Server log file storage directory.
log_dir: "/tidb/app/deploy/pd-2379/log"
# # numa node bindings.
# numa_node: "0,1"
# # The following configs are used to overwrite the `server_configs.pd` values.
# config:
# schedule.max-merge-region-size: 20
# schedule.max-merge-region-keys: 200000
- host: 192.168.0.35
# ssh_port: 22
# name: "pd-1"
# client_port: 2379
# peer_port: 2380
deploy_dir: "/tidb/app/deploy/pd-2379"
data_dir: "/tidb/app/data/pd-2379"
log_dir: "/tidb/app/deploy/pd-2379/log"
# numa_node: "0,1"
# config:
# schedule.max-merge-region-size: 20
# schedule.max-merge-region-keys: 200000
- host: 192.168.0.37
# ssh_port: 22
# name: "pd-1"
# client_port: 2379
# peer_port: 2380
deploy_dir: "/tidb/app/deploy/pd-2379"
data_dir: "/tidb/app/data/pd-2379"
log_dir: "/tidb/app/deploy/pd-2379/log"
# numa_node: "0,1"
# config:
# schedule.max-merge-region-size: 20
# schedule.max-merge-region-keys: 200000
# # Server configs are used to specify the configuration of TiDB Servers.
tidb_servers:
# # The ip address of the TiDB Server.
- host: 192.168.0.31
# # SSH port of the server.
# ssh_port: 22
# # Access the TiDB cluster port.
port: 4000
# # TiDB Server status information reporting port.
status_port: 10080
# # TiDB Server deployment file, startup script, configuration file storage directory.
deploy_dir: "/tidb/app/deploy/tidb-4000"
# # TiDB Server log file storage directory.
log_dir: "/tidb/app/deploy/tidb-4000/log"
# numa_node: "0" # suggest numa node bindings.
- host: 192.168.0.35
# ssh_port: 22
port: 4000
status_port: 10080
deploy_dir: "/tidb/app/deploy/tidb-4001"
log_dir: "/tidb/app/deploy/tidb-4001/log"
# numa_node: "1" # suggest numa node bindings.
- host: 192.168.0.37
# ssh_port: 22
port: 4000
status_port: 10080
deploy_dir: "/tidb/app/deploy/tidb-4000"
log_dir: "/tidb/app/deploy/tidb-4000/log"
# numa_node: "0" # suggest numa node bindings.
# # Server configs are used to specify the configuration of TiKV Servers.
tikv_servers:
# # The ip address of the TiKV Server.
- host: 192.168.0.31
# # SSH port of the server.
# ssh_port: 22
# # TiKV Server communication port.
port: 20160
# # Communication port for reporting TiKV Server status.
status_port: 20180
# # TiKV Server deployment file, startup script, configuration file storage directory.
deploy_dir: "/tidb/app/deploy/tikv-20160"
# # TiKV Server data storage directory.
data_dir: "/tidb/app/data/tikv-20160"
# # TiKV Server log file storage directory.
log_dir: "/tidb/app/deploy/tikv-20160/log"
# numa_node: "0"
# # The following configs are used to overwrite the `server_configs.tikv` values.
# config:
# log.level: warn
- host: 192.168.0.35
# ssh_port: 22
port: 20160
status_port: 20180
deploy_dir: "/tidb/app/deploy/tikv-20161"
data_dir: "/tidb/app/data/tikv-20161"
log_dir: "/tidb/app/deploy/tikv-20161/log"
# numa_node: "1"
# config:
# log.level: warn
- host: 192.168.0.37
# ssh_port: 22
port: 20160
status_port: 20180
deploy_dir: "/tidb/app/deploy/tikv-20161"
data_dir: "/tidb/app/data/tikv-20161"
log_dir: "/tidb/app/deploy/tikv-20161/log"
# numa_node: "0"
# config:
# log.level: warn
# # Server configs are used to specify the configuration of TiFlash Servers.
tiflash_servers:
# # The ip address of the TiFlash Server.
- host: 192.168.0.31
# # SSH port of the server.
# ssh_port: 22
# # TiFlash TCP Service port.
tcp_port: 9000
# # TiFlash HTTP Service port.
http_port: 8123
# # TiFlash raft service and coprocessor service listening address.
flash_service_port: 3930
# # TiFlash Proxy service port.
flash_proxy_port: 20170
# # Prometheus pulls TiFlash Proxy metrics port.
flash_proxy_status_port: 20292
# # Prometheus pulls the TiFlash metrics port.
metrics_port: 8234
# # TiFlash Server deployment file, startup script, configuration file storage directory.
deploy_dir: /tidb/app/deploy/tiflash-9000
## With cluster version >= v4.0.9 and you want to deploy a multi-disk TiFlash node, it is recommended to
## check config.storage.* for details. The data_dir will be ignored if you defined those configurations.
## Setting data_dir to a ','-joined string is still supported but deprecated.
## Check https://docs.pingcap.com/tidb/stable/tiflash-configuration#multi-disk-deployment for more details.
# # TiFlash Server data storage directory.
data_dir: /tiflash/data/tiflash-9000
# # TiFlash Server log file storage directory.
log_dir: /tidb/app/deploy/tiflash-9000/log
- host: 192.168.0.35
# ssh_port: 22
tcp_port: 9000
http_port: 8123
flash_service_port: 3930
flash_proxy_port: 20170
flash_proxy_status_port: 20292
metrics_port: 8234
deploy_dir: /tidb/app/deploy/tiflash-9001
data_dir: /tiflash/data/tiflash-9001
log_dir: /tidb/app/deploy/tiflash-9001/log
- host: 192.168.0.37
# ssh_port: 22
tcp_port: 9000
http_port: 8123
flash_service_port: 3930
flash_proxy_port: 20170
flash_proxy_status_port: 20292
metrics_port: 8234
deploy_dir: /tidb/app/deploy/tiflash-9001
data_dir: /tiflash/data/tiflash-9001
log_dir: /tidb/app/deploy/tiflash-9001/log
# # Server configs are used to specify the configuration of TiKV-CDC Servers.
#kvcdc_servers:
# - host: 192.168.0.31
# # # SSH port of the server.
# # ssh_port: 22
# # # TiKV-CDC Server communication port.
# port: 8600
# # # TiKV-CDC Server data storage directory.
# data_dir: "/tidb/app/data/tikv-cdc-8600"
# # # TiKV-CDC Server log file storage directory.
# log_dir: "/data1/tidb-deploy/tikv-cdc-8600/log"
# - host: 192.168.0.35
# port: 8600
# data_dir: "/tidb/app/data/tikv-cdc-8600"
# log_dir: "/tidb/app/deploy/tikv-cdc-8600/log"
# - host: 192.168.0.37
# port: 8600
# data_dir: "/tidb/app/data/tikv-cdc-8600"
# log_dir: "/tidb/app/deploy/tikv-cdc-8600/log"
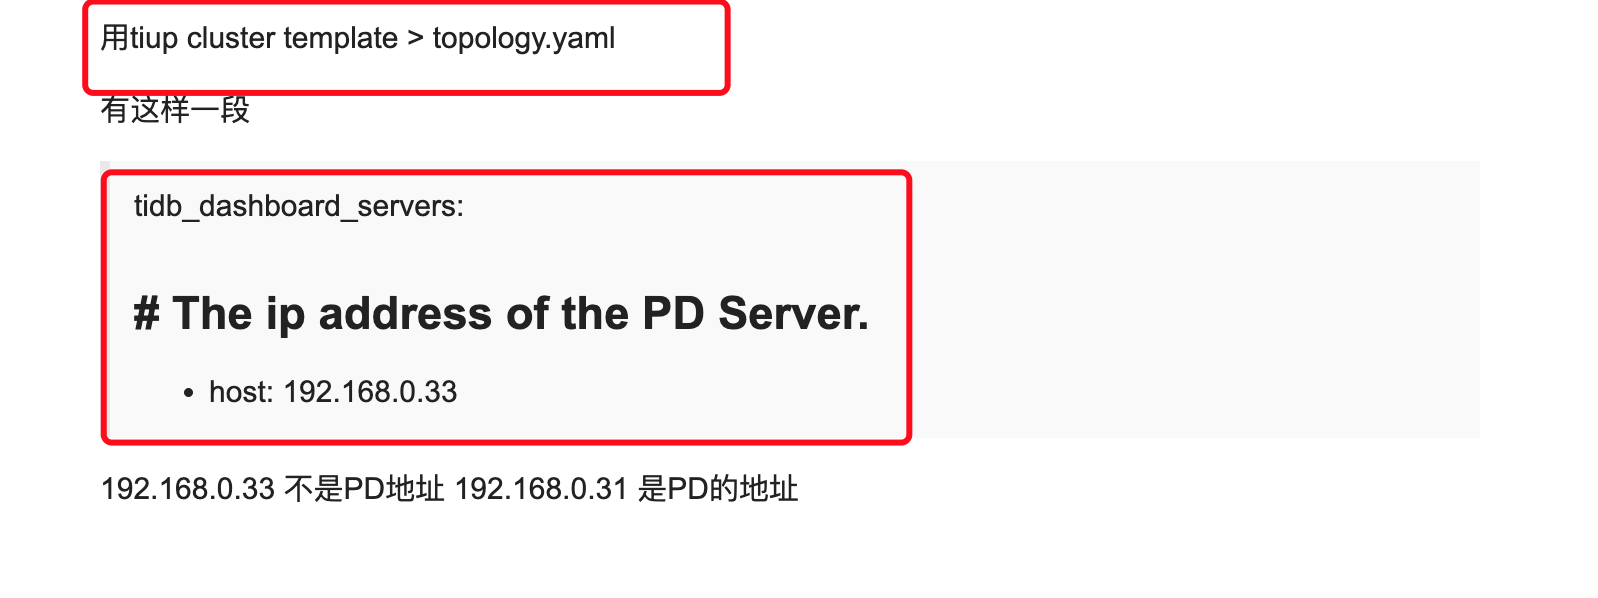
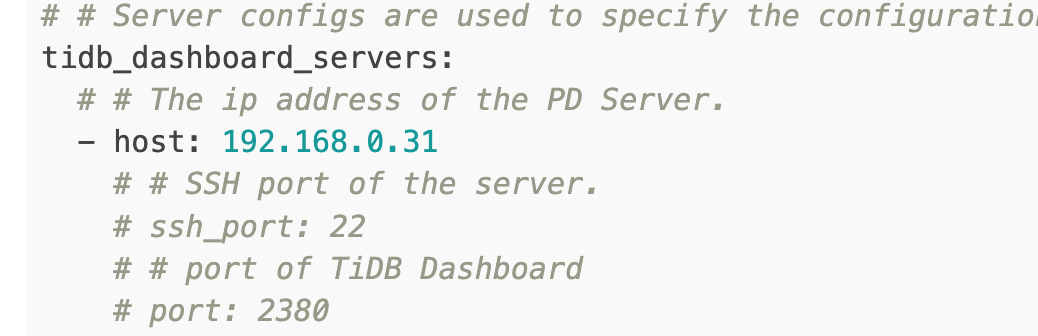
# # Server configs are used to specify the configuration of TiDB Dashboard Servers.
tidb_dashboard_servers:
# # The ip address of the PD Server.
- host: 192.168.0.31
# # SSH port of the server.
# ssh_port: 22
# # port of TiDB Dashboard
# port: 2380
# # TiDB Dashboard deployment file, startup script, configuration file storage directory.
# deploy_dir: "/tidb-deploy/tidb-dashboard-23333"
# # PD Server data storage directory.
# data_dir: "/tidb-data/tidb-dashboard-23333"
# # PD Server log file storage directory.
# log_dir: "/tidb-deploy/tidb-dashboard-23333/log"
# # numa node bindings.
# numa_node: "0,1"
# # Server configs are used to specify the configuration of Prometheus Server.
monitoring_servers:
# # The ip address of the Monitoring Server.
- host: 192.168.0.33
# # SSH port of the server.
# ssh_port: 22
# # Prometheus Service communication port.
# port: 9090
# # ng-monitoring servive communication port
# ng_port: 12020
# # Prometheus deployment file, startup script, configuration file storage directory.
# deploy_dir: "/tidb-deploy/prometheus-8249"
# # Prometheus data storage directory.
# data_dir: "/tidb-data/prometheus-8249"
# # Prometheus log file storage directory.
# log_dir: "/tidb-deploy/prometheus-8249/log"
# prometheus rule dir on TiUP machine
# rule_dir: /home/tidb/prometheus_rule
# scrape_interval: 15s
# scrape_timeout: 10s
# # Server configs are used to specify the configuration of Grafana Servers.
grafana_servers:
# # The ip address of the Grafana Server.
- host: 192.168.0.33
# # Grafana Web monitoring service client (browser) access port
# port: 3000
# # Grafana deployment file, startup script, configuration file storage directory.
# deploy_dir: /tidb-deploy/grafana-3000
# grafana dashboard dir on TiUP machine
# dashboard_dir: /home/tidb/dashboards
# config:
# log.file.level: warning
# # Server configs are used to specify the configuration of Alertmanager Servers.
alertmanager_servers:
# # The ip address of the Alertmanager Server.
- host: 192.168.0.33
# # SSH port of the server.
# ssh_port: 22
# Alertmanager web service listen host.
# listen_host: 0.0.0.0
# # Alertmanager web service port.
# web_port: 9093
# # Alertmanager communication port.
# cluster_port: 9094
# # Alertmanager deployment file, startup script, configuration file storage directory.
# deploy_dir: "/tidb-deploy/alertmanager-9093"
# # Alertmanager data storage directory.
# data_dir: "/tidb-data/alertmanager-9093"
# # Alertmanager log file storage directory.
# log_dir: "/tidb-deploy/alertmanager-9093/log"
# # Alertmanager config file storage directory.
# config_file: "/tidb-deploy/alertmanager-9093/bin/alertmanager/alertmanager.yml"