饭光小团
1
【 TiDB 使用环境】生产环境
【 TiDB 版本】6.1.2
【复现路径】alter table t set TIFLASH REPLICA 1 ;
【遇到的问题:问题现象及影响】
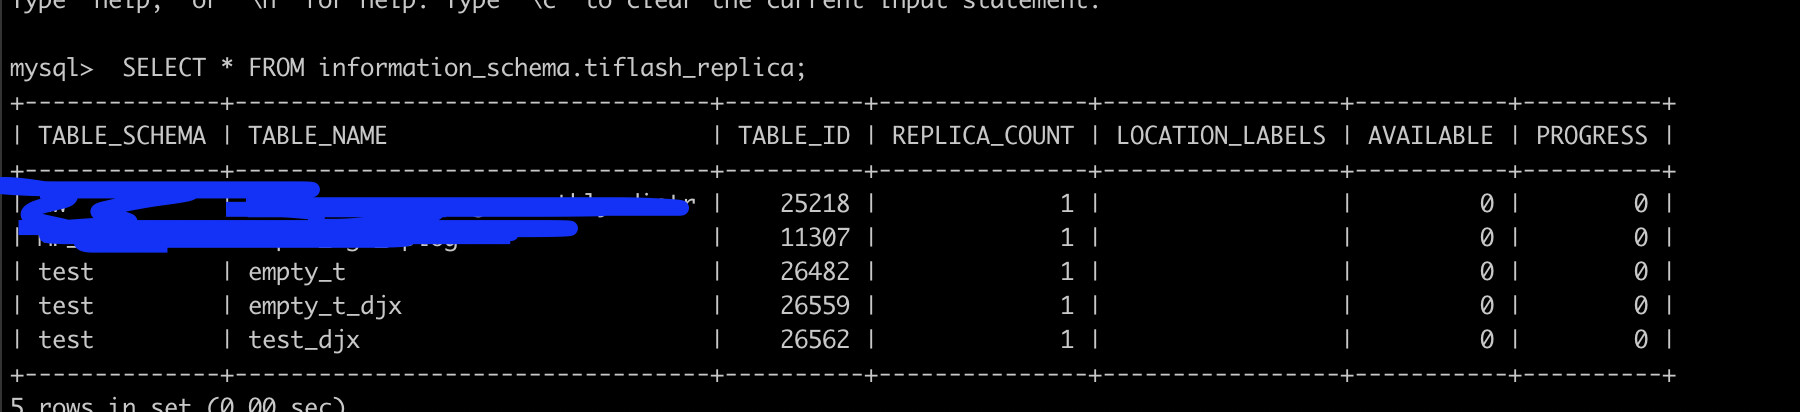
TiFlash AVAILABLE 和PROGRESS 均为0
mysql> show create table test_djx \G
*************************** 1. row ***************************
Table: test_djx
Create Table: CREATE TABLE
test_djx (
id int(11) DEFAULT NULL
) ENGINE=InnoDB DEFAULT CHARSET=utf8mb4 COLLATE=utf8mb4_bin /*T![placement] PLACEMENT POLICY=
storeonssd */
按照
https://docs.pingcap.com/zh/tidb/stable/troubleshoot-tiflash#tiflash-常见问题 官网文档的排查结果如下:
- TiFlash 是正常启动的
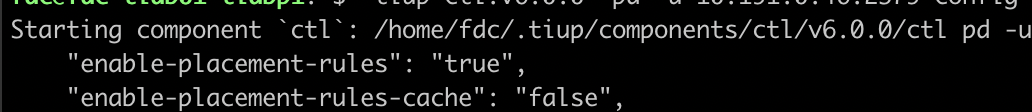
- 使用 pd-ctl 检查 PD 的 Placement Rules 功能是否开启:
- 通过 pd-ctl 查看 TiFlash proxy 状态是否正常:
4.检查配置的副本数是否小于等于集群 TiKV 节点数。若配置的副本数超过 TiKV 节点数,则 PD 不会向 TiFlash 同步数据 : 副本数1 肯定小于节点数。
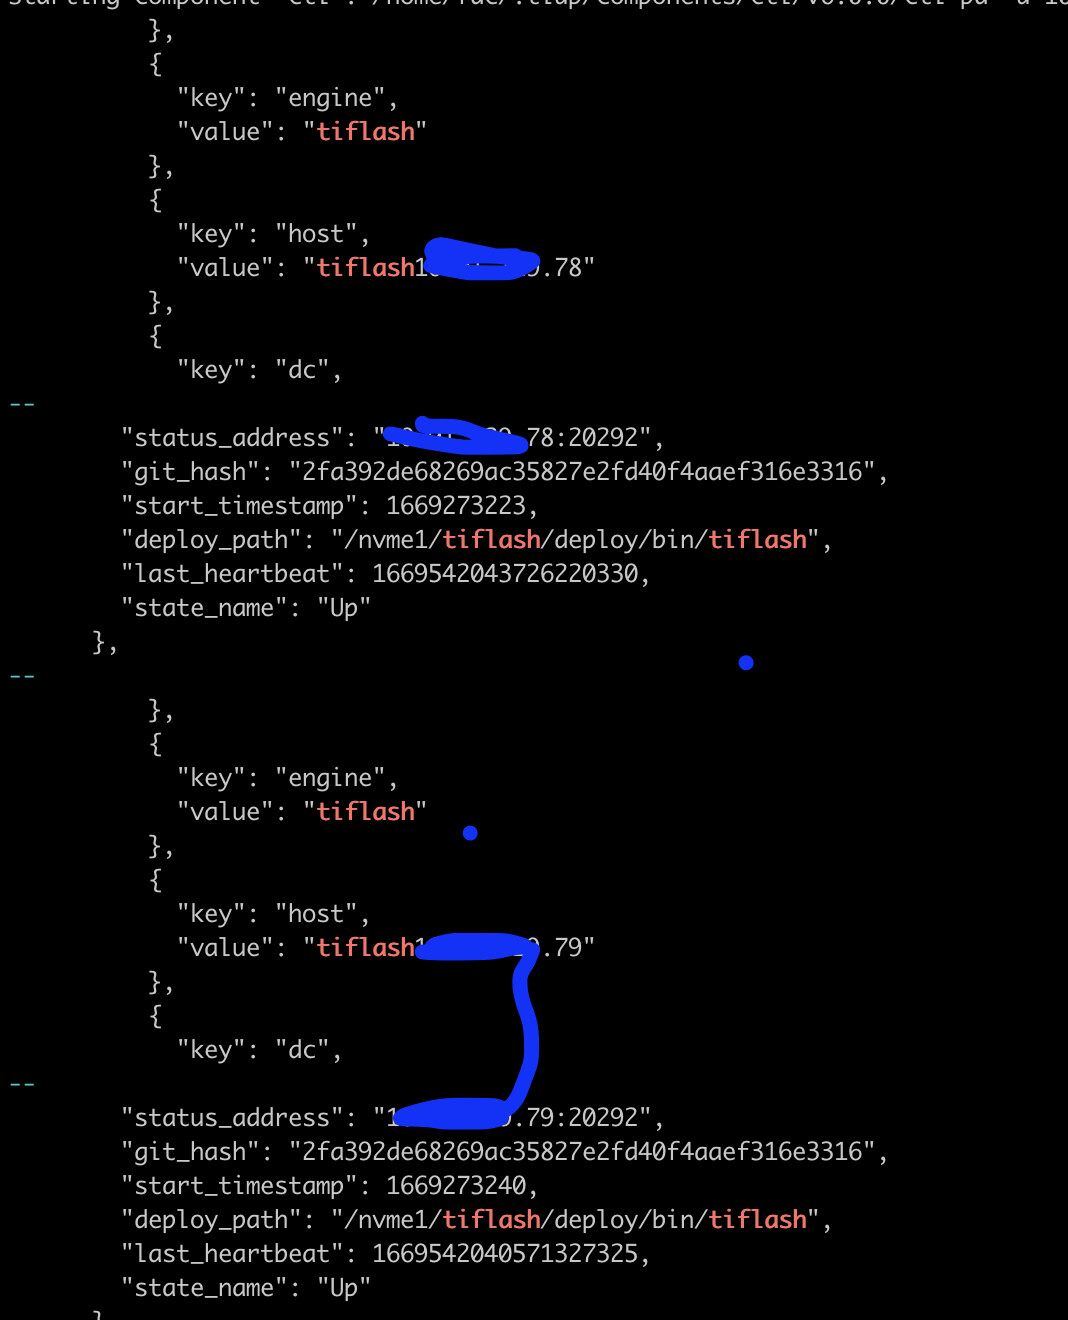
5.检查 PD 是否为表设置 placement-rule
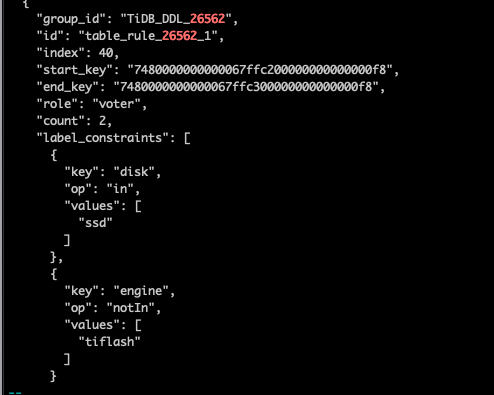
- 检查 TiDB 是否为表创建
placement-rule
搜索 TiDB DDL Owner 的日志,检查 TiDB 是否通知 PD 添加 placement-rule。对于非分区表搜索 ConfigureTiFlashPDForTable;对于分区表,搜索 ConfigureTiFlashPDForPartitions :
确认有关键字。
【资源配置】
【附件:截图/日志/监控】
集群配置:
1 个赞
h5n1
(H5n1)
5
tiflash_tikv.log ,tiflash.log
看看这2个日志有啥
饭光小团
6
tiflash.log 持续的刷如下的日志:
[2022/11/28 14:49:55.410 +08:00] [DEBUG] [PageEntriesVersionSetWithDelta.cpp:369] ["PageStorage:db_1.t_26562.meta gcApply remove 1 invalid snapshots, 1 snapshots left, longest lifetime 0.000 seconds, created from thread_id 0, tracing_id "] [thread_id=34]
[2022/11/28 14:49:55.410 +08:00] [DEBUG] [PageEntriesVersionSetWithDelta.cpp:369] ["PageStorage:db_1.t_26562.data gcApply remove 1 invalid snapshots, 1 snapshots left, longest lifetime 0.000 seconds, created from thread_id 0, tracing_id "] [thread_id=34]
[2022/11/28 14:49:55.410 +08:00] [DEBUG] [PageEntriesVersionSetWithDelta.cpp:369] ["PageStorage:db_1.t_26562.log gcApply remove 1 invalid snapshots, 1 snapshots left, longest lifetime 0.000 seconds, created from thread_id 0, tracing_id "] [thread_id=34]
[2022/11/28 14:50:00.141 +08:00] [DEBUG] [DeltaMergeStore.cpp:1758] [“DeltaMergeStore:db_1.t_26562 GC on table t_26562 start with key: 9223372036854775807, gc_safe_point: 437672540880764928, max gc limit: 100”] [thread_id=28]
[2022/11/28 14:50:00.141 +08:00] [DEBUG] [DeltaMergeStore.cpp:1879] [“DeltaMergeStore:db_1.t_26562 Finish GC on 0 segments [table=t_26562]”] [thread_id=28]
tiflash_tikv.log 没有看到啥有价值的日志
h5n1
(H5n1)
7
也看看pd leader的pd.log日志 ,找找这个表的相关region调度情况
饭光小团
8
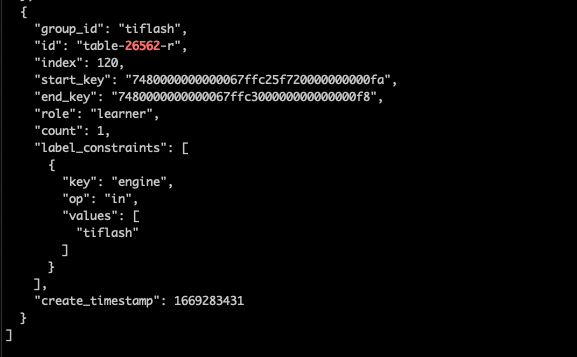
[2022/11/24 17:50:31.107 +08:00] [INFO] [rule_manager.go:244] [“placement rule updated”] [rule=“{"group_id":"tiflash","id":"table-26562-r","index":120,"start_key":"7480000000000067ffc25f720000000000fa","end_key":"7480000000000067ffc300000000000000f8","role":"learner","count":1,"label_constraints":[{"key":"engine","op":"in","values":["tiflash"]}],"create_timestamp":1669283431}”]
[2022/11/24 17:50:31.121 +08:00] [INFO] [operator_controller.go:450] [“add operator”] [region-id=9561515817] [operator=“"rule-split-region {split: region 9561515817 use policy USEKEY and keys [7480000000000067FFC200000000000000F8 7480000000000067FFC25F720000000000FA 7480000000000067FFC300000000000000F8]} (kind:split, region:9561515817(21291, 673), createAt:2022-11-24 17:50:31.121009088 +0800 CST m=+616944.596227224, startAt:0001-01-01 00:00:00 +0000 UTC, currentStep:0, size:1, steps:[split region with policy USEKEY])"”] [additional-info=“{"region-end-key":"","region-start-key":"7480000000000067FFC000000000000000F8"}”]
饭光小团
11
fdc@fdc-tidb01-tidbp1:~$ tiup ctl:v6.0.0 pd -u XXXXX.46:2379 scheduler show
Starting component ctl: /home/fdc/.tiup/components/ctl/v6.0.0/ctl pd -u XXXXX.46:2379 scheduler show
[
“balance-leader-scheduler”,
“balance-region-scheduler”,
“split-bucket-scheduler”,
“balance-hot-region-scheduler”
]
我们同事排查了下,没看到有这个调度项,这个要手动添加?
h5n1
(H5n1)
12
不是这个意思,是查看pd leaer的pd.log里的operator产生
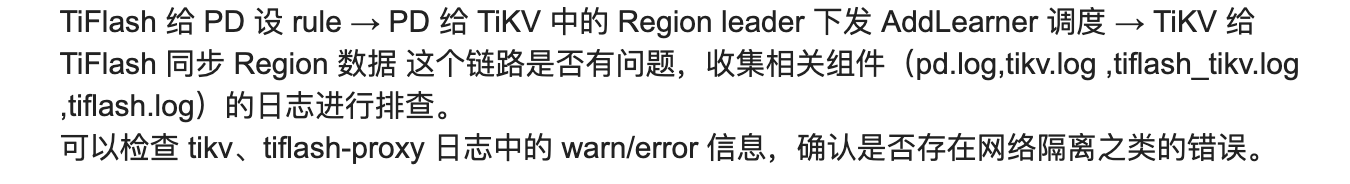
- 确认同步进度 “慢” 的具体表现。出问题的表,其 flash_region_count 是否很长时间”没有变化”,还是只是”变化得慢” (比如几分钟还是会涨几个 region)。
- 如果是 “没有变化”,需要排查整个工作链路上什么环节出现问题。
TiFlash 给 PD 设 rule → PD 给 TiKV 中的 Region leader 下发 AddLearner 调度 → TiKV 给 TiFlash 同步 Region 数据 这个链路是否有问题,收集相关组件(pd.log,tikv.log ,tiflash_tikv.log ,tiflash.log)的日志进行排查。
可以检查 tikv、tiflash-proxy 日志中的 warn/error 信息,确认是否存在网络隔离之类的错误。
饭光小团
13
[flash.flash_cluster]
cluster_manager_path = “/nvme1/tiflash/deploy/bin/tiflash/flash_cluster_manager”
log = “/nvme1/tiflash/deploy/log/tiflash_cluster_manager.log”
看了下tiflash.toml 有这个配置,但是tiflash_cluster_manager.log 这个文件没有,是否算是异常了?看文档 flash_region_count 是需要在tiflash_cluster_manager.log 里面确认
饭光小团
15
这个还不行,我们的集群是生产集群,当前配置了数据要分布在冷热盘上,删了以后它就会调度到 普通hdd上了,到时候可能有问题。因为flash_region_count我看不到了(没有tiflash_cluster_manager.log日志)所以我继续顺着这个
再看看。
饭光小团
17
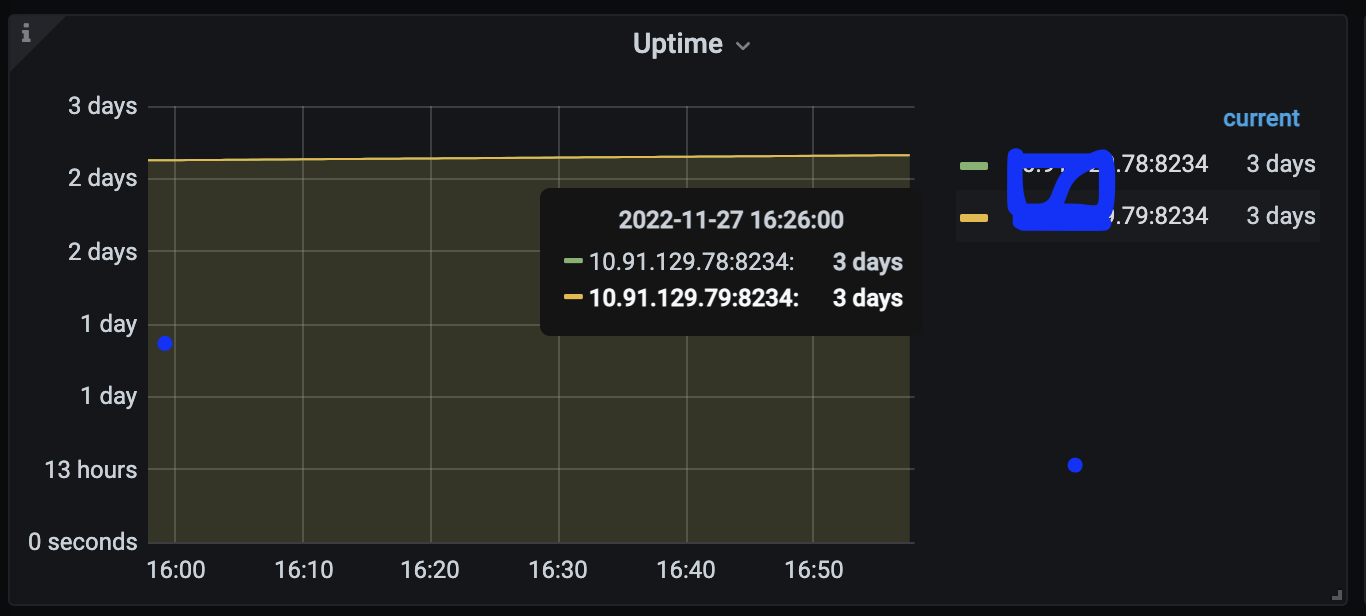
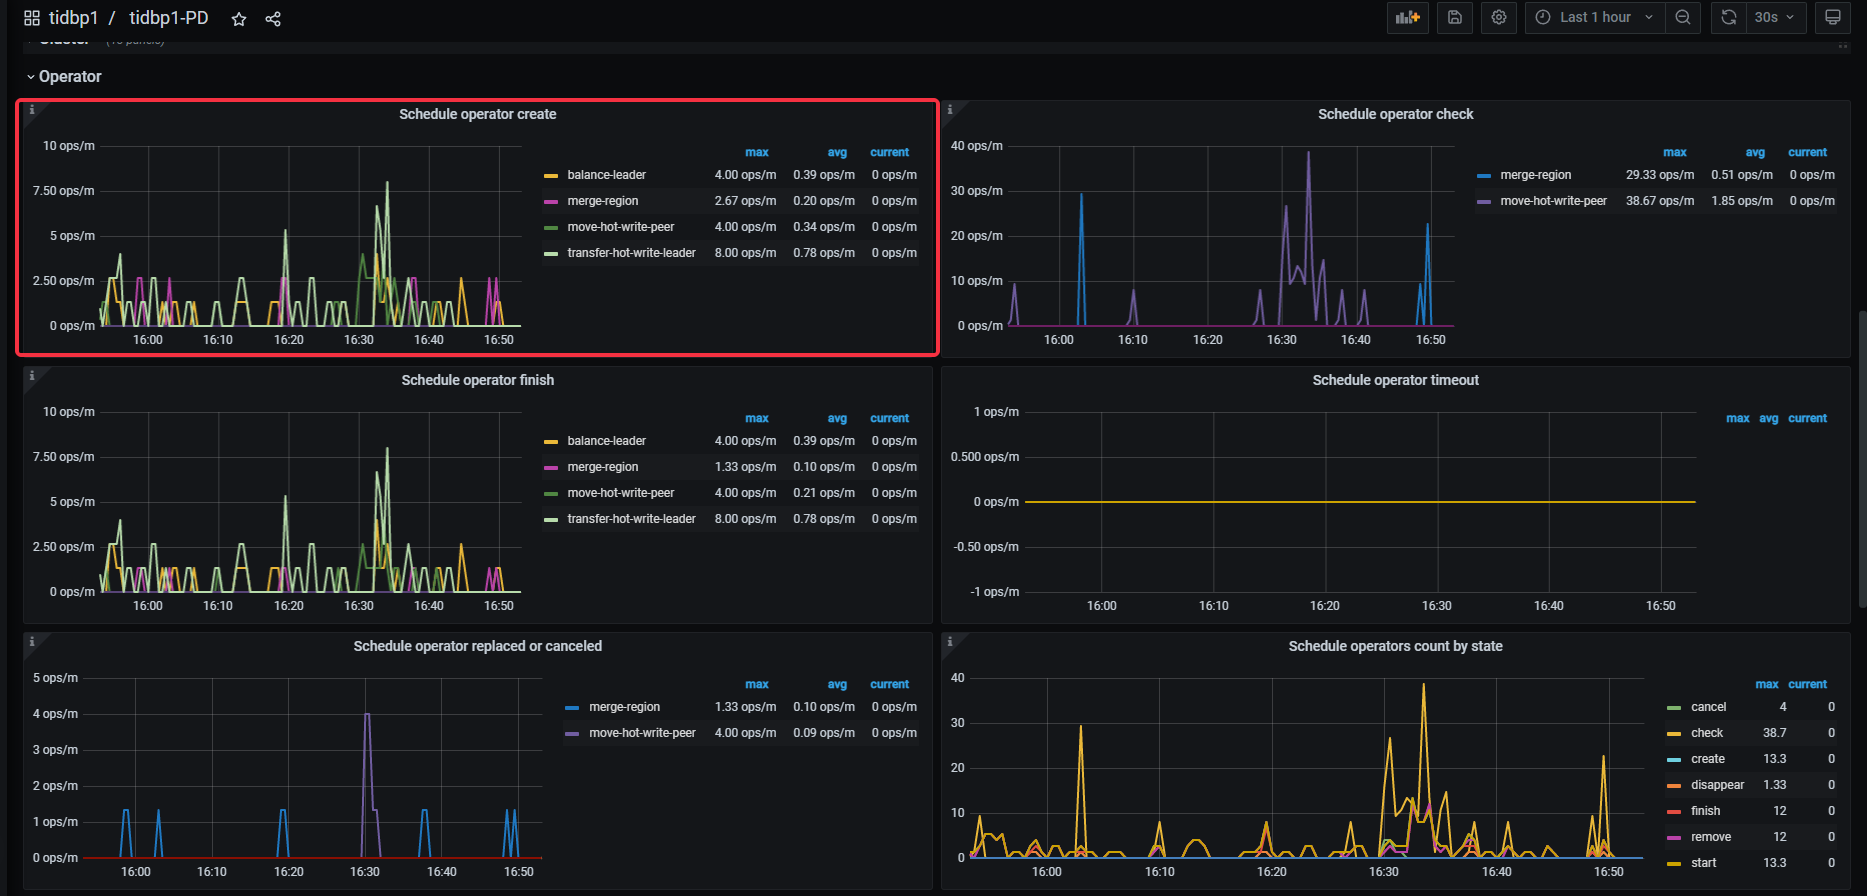
新增一些监控图表
tiup ctl:v6.1.2 pd -u xxx:2379 operator show
[]
test_djx 这张表是一直进度为 0,还是很长段时间后,恢复正常了?