【 TiDB 使用环境】生产环境
【 TiDB 版本】6.1.2
【遇到的问题:问题现象及影响】
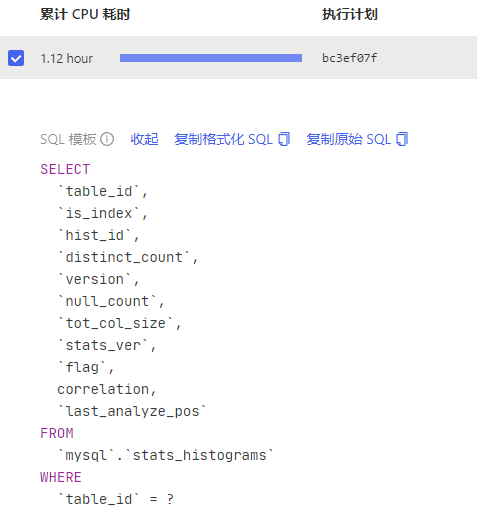
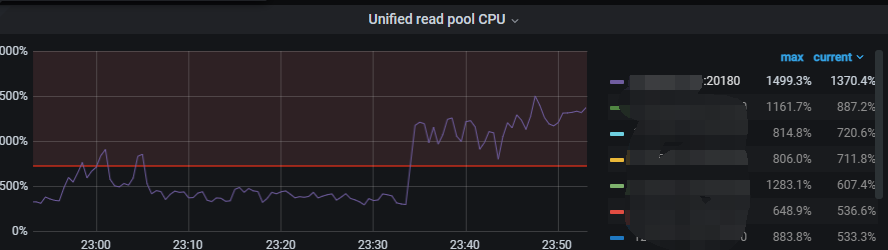
从5.4.2 升级到6.1.2, 发现统计信息只在一个tikv上跑,造成热点。
如何优化?
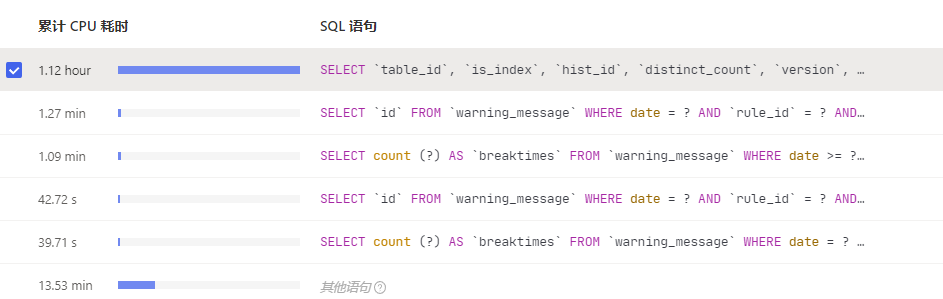
单纯这个表可以split table 或pd-ctl 方式进行region split,然后手工调度部分region到其他节点。但是得看下 这SQL在升级前执行量是不是也这么多
升级前没有这么高,而且也配置load base split了
可以了,CPU恢复正常了
原因是升级前 tidb_analyze_version = 1, tidb_persist_analyze_options 持久化默认参数是on,导致统计信息持久化不生效。把tidb_analyze_version = 2 看看吧
select count(1) from mysql.stats_histograms ;
| count(1) |
| 1700201 |
有什么办法 快速清理一下吗?
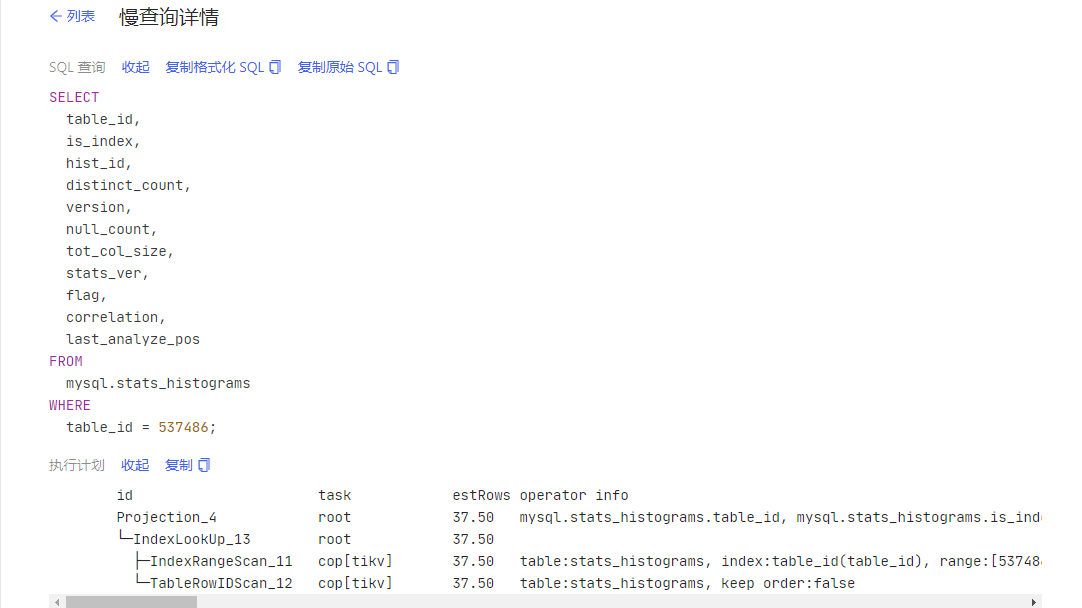
alter table mysql.stats_histograms add key table_id(table_id) ; 加了索引还是全表扫描。
我跑一下这个 analyze table mysql.stats_histograms ;
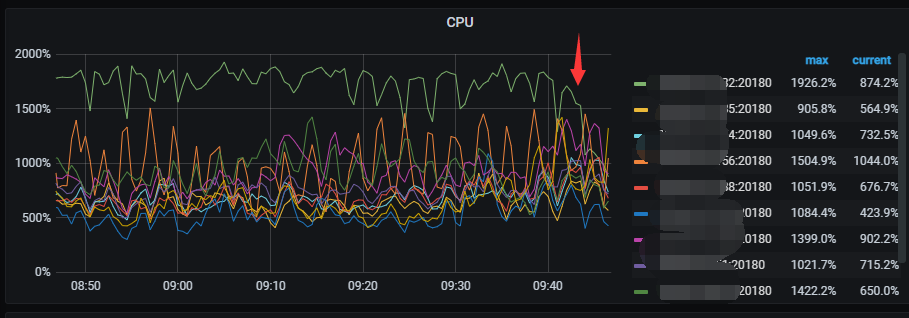
这个表的执行计划 正常了 。tikv CPU也下降了一些 ,再观察看看 。


另外 tidb升级6.1.2之后 出现比较多的 Data too long for column ‘video_material’ at row 错误 :
2022/11/17 11:29:25.359 +08:00] [INFO] [conn.go:1149] [command dispatched failed] [conn=985285563792585879] [connInfo=id:985285563792585879, addr:192.168.6.29:64675 status:10, collation:utf8mb4_general_ci, user:dspwrite] [command=Execute] [status=inTxn:0, au[types:1406]Data too long for column ‘video_material’ at row 1ngithub.com/pingcap/errors.AddStack\n\t/go/pkg/mod/github.com/pingcap/errors@v0.11.5-0.20211224045212-9687c2b0f87c/errors.go:174ngithub.com/pingcap/errors.(*Error).GenWithStack\n\t/go/pkg/mod/github.com/pingcap/errors@v0.11.5-0.2021122
Path:/data/tidb/tidblog/tidb.log
2022/11/17 11:29:02.969 +08:00] [INFO] [conn.go:1149] [command dispatched failed] [conn=985285563792585877] [connInfo=id:985285563792585877, addr:192.168.6.29:46303 status:10, collation:utf8mb4_general_ci, user:dspwrite] [command=Execute] [status=inTxn:0, au[types:1406]Data too long for column ‘image_material’ at row 1ngithub.com/pingcap/errors.AddStack\n\t/go/pkg/mod/github.com/pingcap/errors@v0.11.5-0.20211224045212-9687c2b0f87c/errors.go:174ngithub.com/pingcap/errors.(*Error).GenWithStack\n\t/go/pkg/mod/github.com/pingcap/errors@v0.11.5-0.2021122

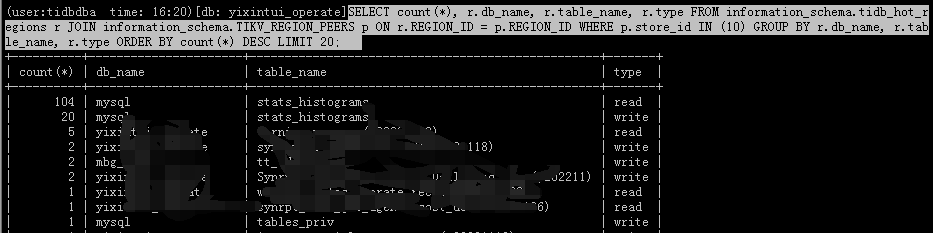
如何追踪这些热点,方便拆分
https://docs.pingcap.com/zh/tidb/stable/pd-control#region-key---formatrawencodehex-key
通过region 去查吧,好像也就这个办法了
29g 基本就是没建索引
CPU高的store 查到 很多跟这个表相关的 。
SELECT count(), r.db_name, r.table_name, r.type FROM information_schema.tidb_hot_regions r JOIN information_schema.TIKV_REGION_PEERS p ON r.REGION_ID = p.REGION_ID WHERE p.store_id IN (10) GROUP BY r.db_name, r.table_name, r.type ORDER BY count() DESC LIMIT 20;
这些都是垃圾数据吧 ,应该是可以清理掉的吧 。 表不存在了 ,但是统计数据还在 。
(user:tidbdba time: 22:02)[db: yixintui_operate]select * from information_schema.tables where tidb_table_id=465581;
Empty set (3.02 sec)
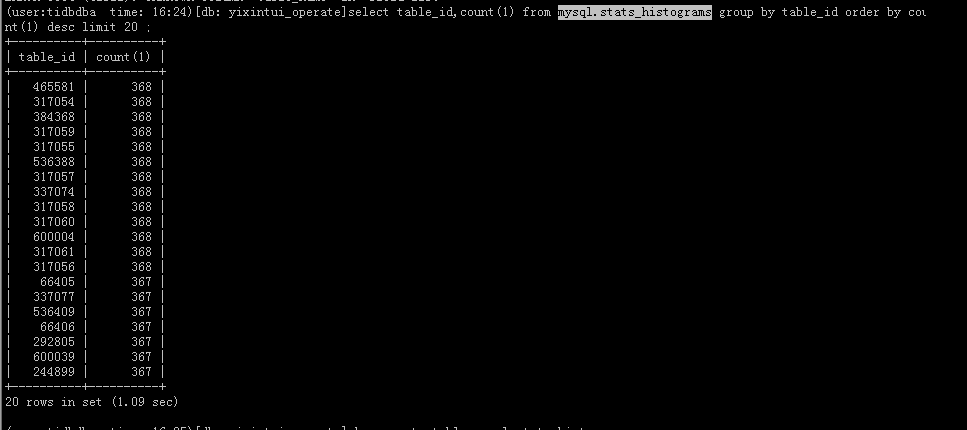
(user:tidbdba time: 22:02)[db: yixintui_operate]select count(1) from mysql.stats_histograms where table_id=465581 limit 3;
±---------+
| count(1) |
±---------+
| 368 |
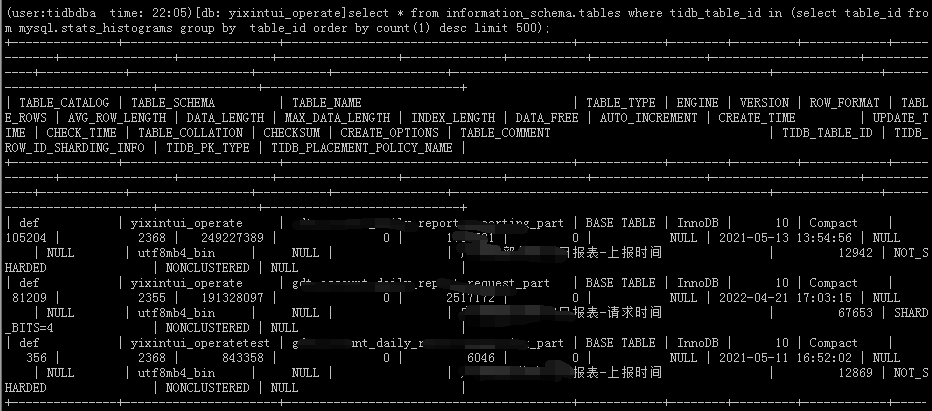
统计表里面 按table_id 前面top 500 张表 ,在 information_schema.tables里存在的只有3 张表。其他都是垃圾数据 ,都是已经删掉的表 。或者 rename的表的统计数据 。
select * from information_schema.tables where tidb_table_id in (select table_id from mysql.stats_histograms group by table_id order by count(1) desc limit 500);
系统只有2000多长表 ,统计表里有37929 个不同table_id的统计数据 。
(user:tidbdba time: 22:16)[db: test]select count(1) from information_schema.tables;
| count(1) |
| 2011 |
1 row in set (2.87 sec)
(user:tidbdba time: 22:18)[db: test]select count(distinct table_id) from mysql.stats_histograms ;
| count(distinct table_id) |
| 37929 |
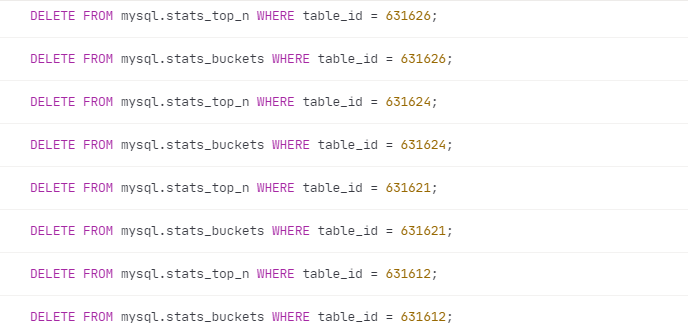
这两个表 会清理 ,可能其他表 也需要统一清理的。
select table_id, hist_id, tot_col_size from mysql.stats_histograms where is_index = 0;
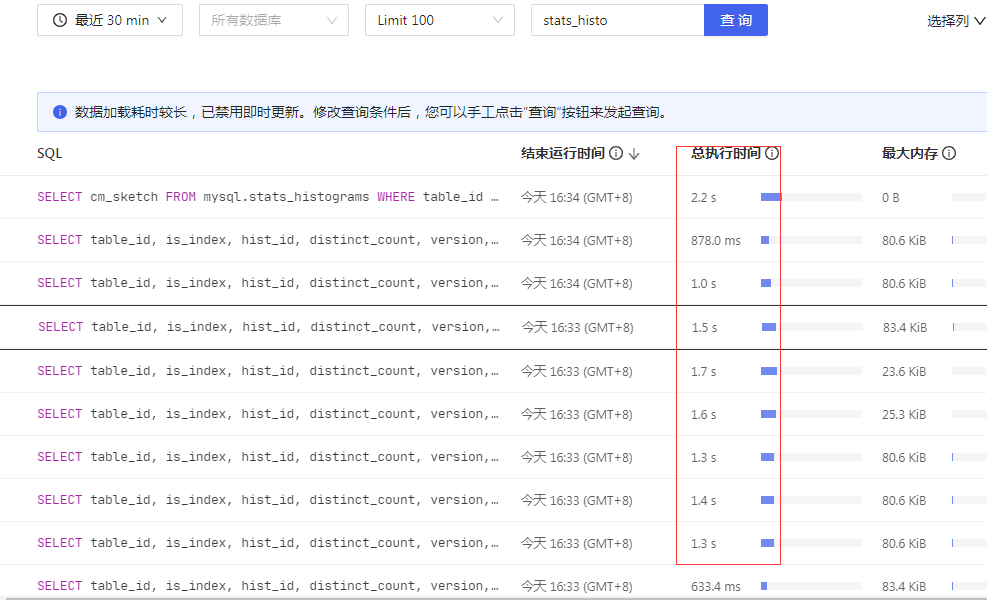
这种sql 全表扫 系统消耗严重 。 这个表里的数据肯定是需要清理的 。
还有很多 update , select 的 table_id 都是 information_schema.tables 里不存在的表 。
此话题已在最后回复的 60 天后被自动关闭。不再允许新回复。