[2021/06/17 09:16:55.499 +00:00] [INFO] [dynamic_config_manager.go:178] ["Load dynamic config from etcd"] [json="{\"keyvisual\":{\"auto_collection_disabled\":false,\"policy\":\"db\",\"policy_kv_separator\":
\"\"},\"profiling\":{\"auto_collection_targets\":null,\"auto_collection_duration_secs\":0,\"auto_collection_interval_secs\":0}}"]
[2021/06/17 09:16:55.499 +00:00] [WARN] [tidb.go:74] ["Alive of TiDB has expired, maybe local time in different hosts are not synchronized"] [key=/topology/tidb/10.18.251.163:4000/ttl] [value=16239199536381
00465]
[2021/06/17 09:16:55.499 +00:00] [WARN] [tidb.go:74] ["Alive of TiDB has expired, maybe local time in different hosts are not synchronized"] [key=/topology/tidb/10.18.251.204:4000/ttl] [value=16239199536374
21720]
[2021/06/17 09:16:55.499 +00:00] [WARN] [tidb.go:74] ["Alive of TiDB has expired, maybe local time in different hosts are not synchronized"] [key=/topology/tidb/10.18.251.77:4000/ttl] [value=1623919953639318400]
[2021/06/17 09:16:55.503 +00:00] [INFO] [dynamic_config_manager.go:199] ["Save dynamic config to etcd"] [json="{\"keyvisual\":{\"auto_collection_disabled\":false,\"policy\":\"db\",\"policy_kv_separator\":\"\"},\"profiling\":{\"auto_collection_targets\":null,\"auto_collection_duration_secs\":0,\"auto_collection_interval_secs\":0}}"]
[2021/06/17 09:16:55.510 +00:00] [INFO] [manager.go:85] ["Key visual service is started"]
[2021/06/17 09:16:57.498 +00:00] [WARN] [proxy.go:189] ["fail to recv activity from remote, stay inactive and wait to next checking round"] [remote=10.18.251.77:10080] [interval=2s] [error="dial tcp 10.18.251.77:10080: connect: connection refused"]
[2021/06/17 09:16:57.498 +00:00] [WARN] [proxy.go:189] ["fail to recv activity from remote, stay inactive and wait to next checking round"] [remote=10.18.251.77:4000] [interval=2s] [error="dial tcp 10.18.251.77:4000: connect: connection refused"]
[2021/06/17 09:16:57.498 +00:00] [WARN] [proxy.go:189] ["fail to recv activity from remote, stay inactive and wait to next checking round"] [remote=10.18.251.204:4000] [interval=2s] [error="dial tcp 10.18.251.204:4000: connect: connection refused"]
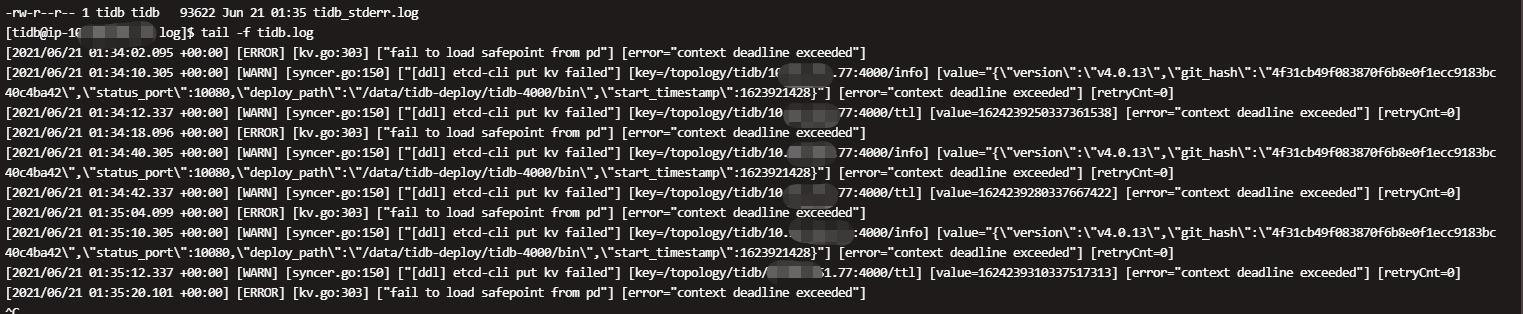
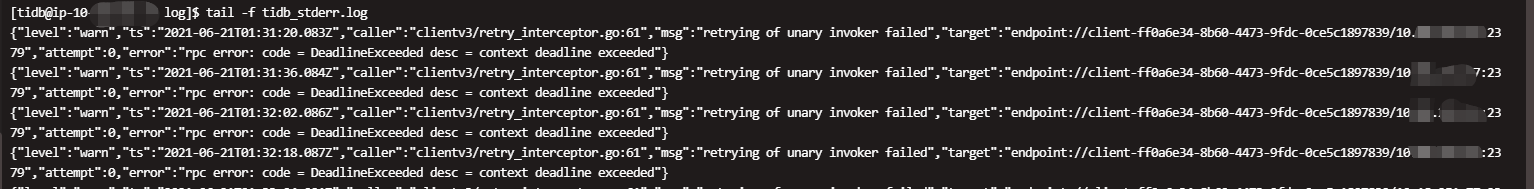
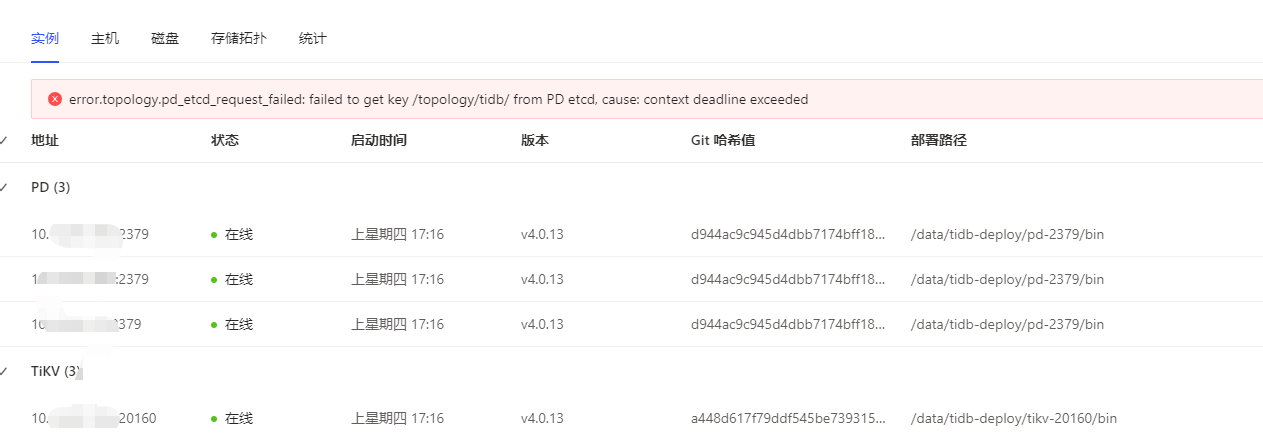
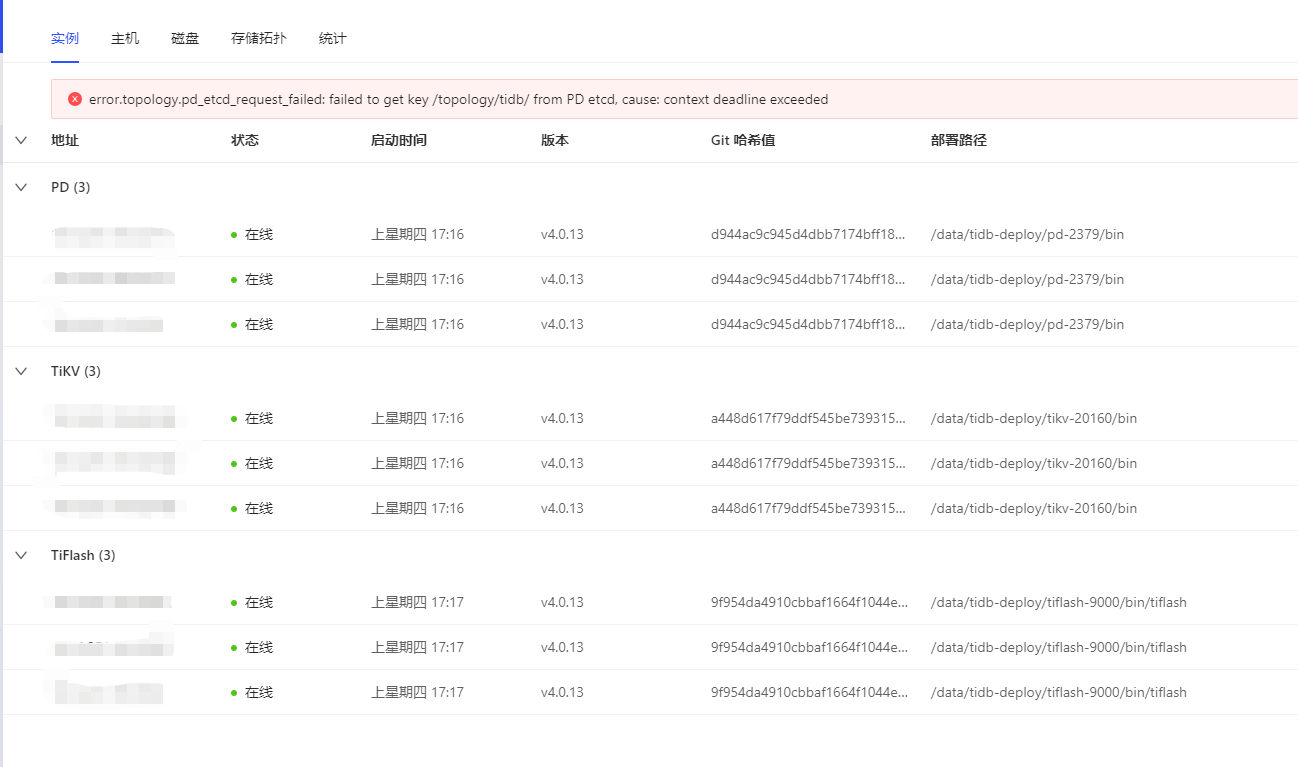
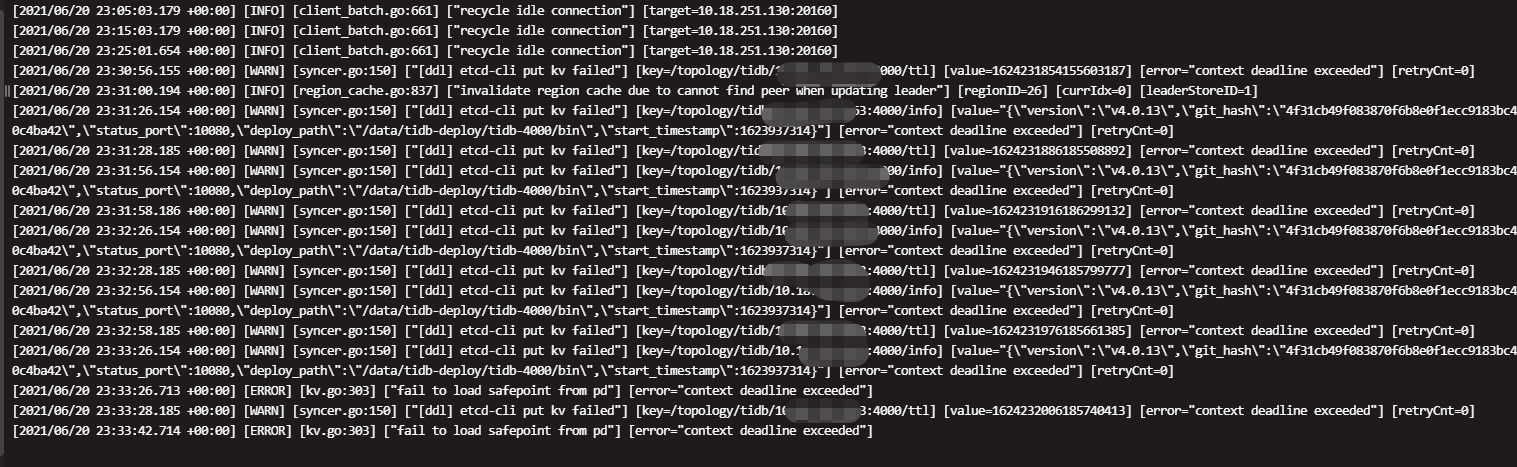
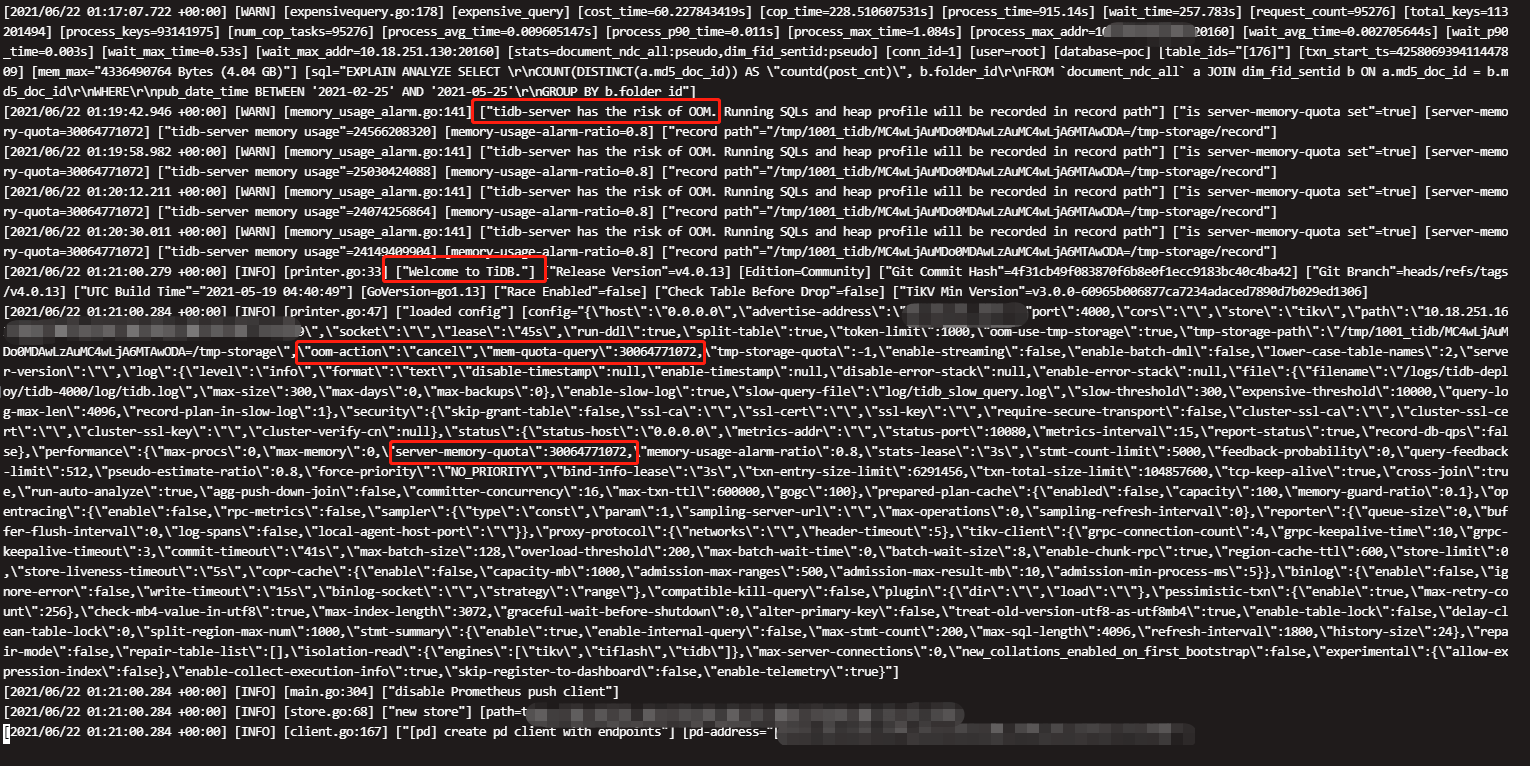
对,是有个pd leader(tidb server也部署在这里),一个大sql,tidb server 内存不够了,机器异常的卡,重启机器后解决了,但是有个问题,我设置了oom-action为cancel以及mem-quota-query设置了28G,但是超过了28G没有被cancel,是因为啥呢。。一个大sql过来,还是让tidb server oom了。。