TiDB节点挂点,拉不起来

【 TiDB 使用环境】生产环境
【 TiDB 版本】v5.2.1
【遇到的问题】tidb节点全挂,拉动不起来
【复现路径】tiup cluster prune txidc_saas_tidb
【问题现象及影响】
之前有6个tikv节点,后面下架掉两个,状态是Tombstone,然后将服务器下架了。
后面想将服务器升级,发现升不了,说是有两个节点不能通信,这两个节点正是上次下架的节点
于是执行 tiup cluster prune txidc_saas_tidb,没效果
后面还执行了reload命令,也是不行
然后就没管他了
但早上业务突然告警,一查发现集群的tidb全挂了,其它节点看状态是正常的,想拉起tidb节点,拉不起来

【附件】

Cluster type: tidb
Cluster name: txidc_saas_tidb
Cluster version: v5.2.1
Deploy user: tidb
SSH type: builtin
Dashboard URL: http://10.0.40.149:2379/dashboard
ID Role Host Ports OS/Arch Status Data Dir Deploy Dir


10.0.40.65:9093 alertmanager 10.0.40.65 9093/9094 linux/x86_64 Up /data/deploy/alertmanager/data /data/deploy/alertmanager
10.0.40.65:3000 grafana 10.0.40.65 3000 linux/x86_64 Up - /data/deploy/grafana
10.0.40.149:2379 pd 10.0.40.149 2379/2380 linux/x86_64 Up|UI /data/deploy/data /data/deploy
10.0.40.20:2379 pd 10.0.40.20 2379/2380 linux/x86_64 Up|L /data/deploy/data /data/deploy
10.0.40.65:2379 pd 10.0.40.65 2379/2380 linux/x86_64 Up /data/deploy/data /data/deploy
10.0.40.65:9090 prometheus 10.0.40.65 9090 linux/x86_64 Up /data/deploy/prometheus/data /data/deploy/prometheus
10.0.40.166:4000 tidb 10.0.40.166 4000/10080 linux/x86_64 Down - /data/deploy
10.0.40.25:4000 tidb 10.0.40.25 4000/10080 linux/x86_64 Down - /data/deploy
10.0.40.85:4000 tidb 10.0.40.85 4000/10080 linux/x86_64 Down - /data/deploy
10.0.40.194:20160 tikv 10.0.40.194 20160/20180 linux/x86_64 Up /data/deploy/data /data/deploy
10.0.40.29:20160 tikv 10.0.40.29 20160/20180 linux/x86_64 Up /data/deploy/data /data/deploy
10.0.40.46:20160 tikv 10.0.40.46 20160/20180 linux/x86_64 Up /data/deploy/data /data/deploy
10.0.40.73:20160 tikv 10.0.40.73 20160/20180 linux/x86_64 Tombstone /data/deploy/data /data/deploy
10.0.40.93:20160 tikv 10.0.40.93 20160/20180 linux/x86_64 Up /data/deploy/data /data/deploy
10.0.40.96:20160 tikv 10.0.40.96 20160/20180 linux/x86_64 Tombstone /data/deploy/data /data/deploy
Total nodes: 15

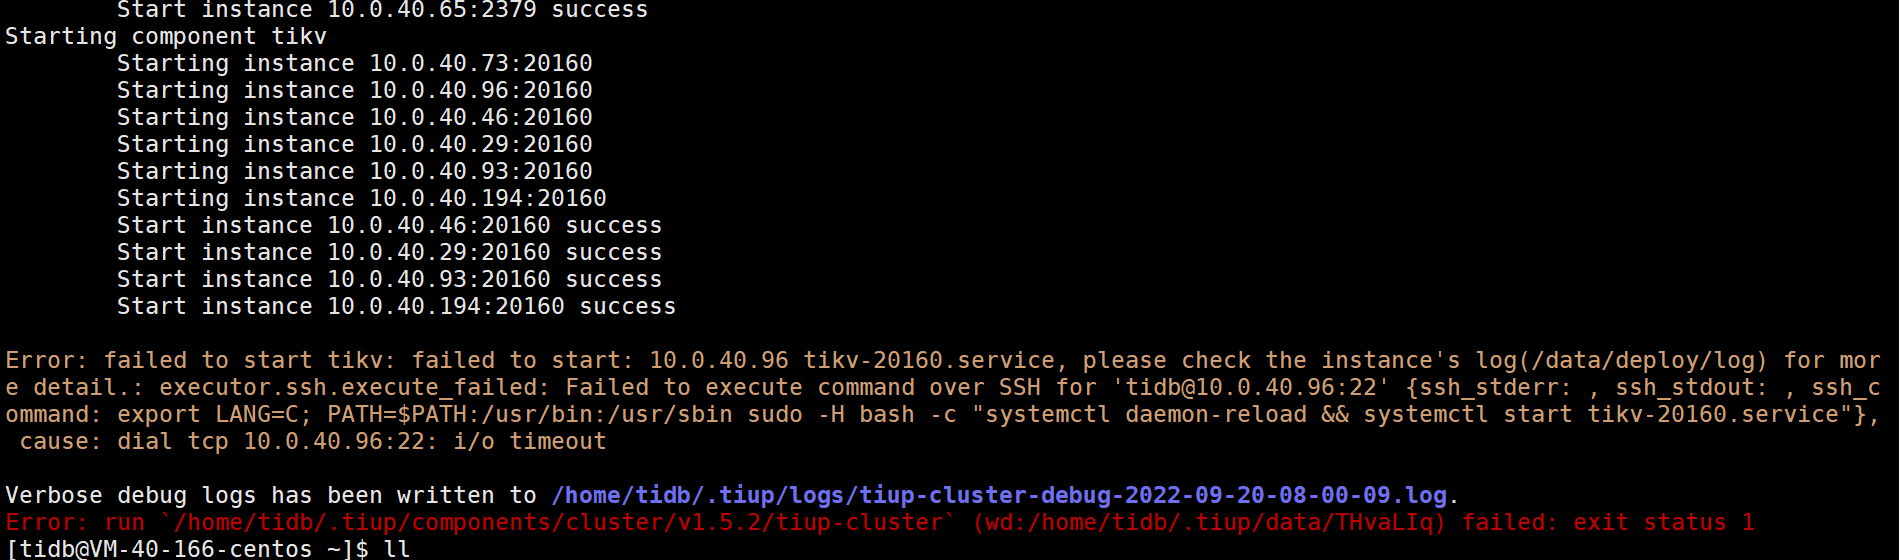
tiup cluster start txidc_saas_tidb
包括用 reload ,restart 等命令都操一样的效果,拉动不起来

cat /home/tidb/.tiup/storage/cluster/clusters/txidc_saas_tidb/meta.yaml
user: tidb
tidb_version: v5.2.1
last_ops_ver: |-
1.5.2 tiup
Go Version: go1.16.5
Git Ref: v1.5.2
GitHash: 5f4e8abfe2ce2b3415b6a8161d8a4863d4e16ce0
topology:
global:
user: tidb
ssh_port: 22
ssh_type: builtin
deploy_dir: /data/tidb/deploy
data_dir: /data/tidb/deploy/data
os: linux
arch: amd64
monitored:
node_exporter_port: 9100
blackbox_exporter_port: 9115
deploy_dir: /data/tidb/deploy/monitor-9100
data_dir: /data/tidb/deploy/data/monitor-9100
log_dir: /data/tidb/deploy/monitor-9100/log
server_configs:
tidb:
binlog.enable: false
binlog.ignore-error: false
log.slow-threshold: 80
performance.txn-total-size-limit: 4294967296
tikv:
raftstore.apply-pool-size: 8
raftstore.store-pool-size: 4
readpool.coprocessor.use-unified-pool: true
readpool.storage.use-unified-pool: false
rocksdb.max-sub-compactions: 3
server.grpc-concurrency: 8
pd:
schedule.leader-schedule-limit: 8
schedule.region-schedule-limit: 1024
schedule.replica-schedule-limit: 32
tiflash: {}
tiflash-learner: {}
pump: {}
drainer: {}
cdc: {}
tidb_servers:

  • host: 10.0.40.166
    ssh_port: 22
    port: 4000
    status_port: 10080
    deploy_dir: /data/deploy
    log_dir: /data/deploy/log
    config:
    log.slow-query-file: tidb_slow_query.log
    arch: amd64
    os: linux
  • host: 10.0.40.85
    ssh_port: 22
    port: 4000
    status_port: 10080
    deploy_dir: /data/deploy
    log_dir: /data/deploy/log
    config:
    log.slow-query-file: tidb_slow_query.log
    arch: amd64
    os: linux
  • host: 10.0.40.25
    ssh_port: 22
    port: 4000
    status_port: 10080
    deploy_dir: /data/deploy
    log_dir: /data/deploy/log
    config:
    log.slow-query-file: tidb_slow_query.log
    arch: amd64
    os: linux
    tikv_servers:
  • host: 10.0.40.46
    ssh_port: 22
    port: 20160
    status_port: 20180
    deploy_dir: /data/deploy
    data_dir: /data/deploy/data
    log_dir: /data/deploy/log
    arch: amd64
    os: linux
  • host: 10.0.40.93
    ssh_port: 22
    port: 20160
    status_port: 20180
    deploy_dir: /data/deploy
    data_dir: /data/deploy/data
    log_dir: /data/deploy/log
    arch: amd64
    os: linux
  • host: 10.0.40.29
    ssh_port: 22
    port: 20160
    status_port: 20180
    deploy_dir: /data/deploy
    data_dir: /data/deploy/data
    log_dir: /data/deploy/log
    arch: amd64
    os: linux
  • host: 10.0.40.194
    ssh_port: 22
    port: 20160
    status_port: 20180
    deploy_dir: /data/deploy
    data_dir: /data/deploy/data
    log_dir: /data/deploy/log
    arch: amd64
    os: linux
  • host: 10.0.40.96
    ssh_port: 22
    port: 20160
    status_port: 20180
    deploy_dir: /data/deploy
    data_dir: /data/deploy/data
    log_dir: /data/deploy/log
    offline: true
    arch: amd64
    os: linux
  • host: 10.0.40.73
    ssh_port: 22
    port: 20160
    status_port: 20180
    deploy_dir: /data/deploy
    data_dir: /data/deploy/data
    log_dir: /data/deploy/log
    offline: true
    arch: amd64
    os: linux
    tiflash_servers: []
    pd_servers:
  • host: 10.0.40.65
    ssh_port: 22
    name: pd-1
    client_port: 2379
    peer_port: 2380
    deploy_dir: /data/deploy
    data_dir: /data/deploy/data
    log_dir: /data/deploy/log
    arch: amd64
    os: linux
  • host: 10.0.40.149
    ssh_port: 22
    name: pd-2
    client_port: 2379
    peer_port: 2380
    deploy_dir: /data/deploy
    data_dir: /data/deploy/data
    log_dir: /data/deploy/log
    arch: amd64
    os: linux
  • host: 10.0.40.20
    ssh_port: 22
    name: pd-3
    client_port: 2379
    peer_port: 2380
    deploy_dir: /data/deploy
    data_dir: /data/deploy/data
    log_dir: /data/deploy/log
    arch: amd64
    os: linux
    monitoring_servers:
  • host: 10.0.40.65
    ssh_port: 22
    port: 9090
    deploy_dir: /data/deploy/prometheus
    data_dir: /data/deploy/prometheus/data
    log_dir: /data/deploy/prometheus/log
    external_alertmanagers: []
    arch: amd64
    os: linux
    grafana_servers:
  • host: 10.0.40.65
    ssh_port: 22
    port: 3000
    deploy_dir: /data/deploy/grafana
    arch: amd64
    os: linux
    username: admin
    password: admin
    anonymous_enable: false
    root_url: “”
    domain: “”
    alertmanager_servers:
  • host: 10.0.40.65
    ssh_port: 22
    web_port: 9093
    cluster_port: 9094
    deploy_dir: /data/deploy/alertmanager
    data_dir: /data/deploy/alertmanager/data
    log_dir: /data/deploy/alertmanager/log
    arch: amd64
    os: linux
    这是原信息文件

先安装最新版本的 clinic 然后上传相关日志看下问题

https://docs.pingcap.com/zh/tidb/stable/quick-start-with-clinic

上传好之后可以将 地址私信给我

同时 你用 tiup ctl:v5.2.1 pd 查看下单peer 的 region 数量

https://docs.pingcap.com/zh/tidb/stable/pd-control#根据副本数过滤-region

可将结果以附件形式发出来

1 个赞

tikv节点下线后,有没有检查tikv节点数据是否迁移完。

检查过的,就是没有将服务器从列表中删除而已,然后就将服务器下架了

给sudo权限了吗

把配置文件中的2个下线的tikv节点删除。

查看下tikv日志具体报什么错?