【TiDB 版本】
v4.0.4
【问题描述】
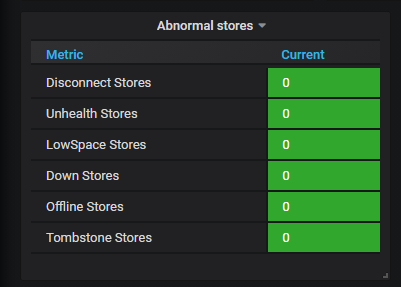
上周集群状态正常,周一来查看集群状态,发现tikv3个store down(3副本,4node)


查看tikv pod日志没发现error明显错误,截图如下,大佬帮分析下

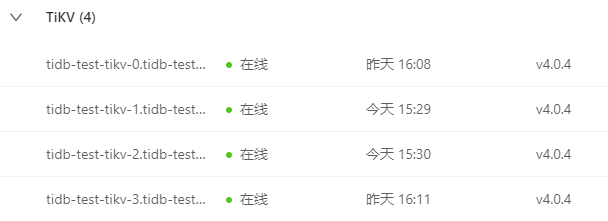
pod状态,tikv pod状态正常。tiflash 重启21次可忽略,问题已解决。
【TiDB 版本】
v4.0.4
【问题描述】
上周集群状态正常,周一来查看集群状态,发现tikv3个store down(3副本,4node)
pd-ctl 执行下 store 命令看下结果
检查一下 tikv pod 与 pd pod 之间的网络情况
pd-ctl store结果如下:
/ # ./pd-ctl store
{
“count”: 7,
“stores”: [
{
“store”: {
“id”: 12,
“address”: “tidb-test-tikv-2.tidb-test-tikv-peer.default.svc:20160”,
“labels”: [
{
“key”: “host”,
“value”: “mgmt12.hh-b.brainpp.cn”
}
],
“version”: “4.0.4”,
“status_address”: “tidb-test-tikv-2.tidb-test-tikv-peer.default.svc:20180”,
“git_hash”: “28e3d44b00700137de4fa933066ab83e5f8306cf”,
“start_timestamp”: 1618997318,
“deploy_path”: “/”,
“last_heartbeat”: 1621204797467564724,
“state_name”: “Down”
},
“status”: {
“capacity”: “600GiB”,
“available”: “268.7GiB”,
“used_size”: “309.3GiB”,
“leader_count”: 12657,
“leader_weight”: 1,
“leader_score”: 12657,
“leader_size”: 912919,
“region_count”: 13355,
“region_weight”: 1,
“region_score”: 957026,
“region_size”: 957026,
“start_ts”: “2021-04-21T09:28:38Z”,
“last_heartbeat_ts”: “2021-05-16T22:39:57.467564724Z”,
“uptime”: “613h11m19.467564724s”
}
},
{
“store”: {
“id”: 45,
“address”: “tidb-test-tikv-1.tidb-test-tikv-peer.default.svc:20160”,
“labels”: [
{
“key”: “host”,
“value”: “mgmt11.hh-b.brainpp.cn”
}
],
“version”: “4.0.4”,
“status_address”: “tidb-test-tikv-1.tidb-test-tikv-peer.default.svc:20180”,
“git_hash”: “28e3d44b00700137de4fa933066ab83e5f8306cf”,
“start_timestamp”: 1618997318,
“deploy_path”: “/”,
“last_heartbeat”: 1621006849391385689,
“state_name”: “Down”
},
“status”: {
“capacity”: “600GiB”,
“available”: “69.3GiB”,
“used_size”: “530.7GiB”,
“leader_count”: 5,
“leader_weight”: 1,
“leader_score”: 5,
“leader_size”: 346,
“region_count”: 26778,
“region_weight”: 1,
“region_score”: 990616004.5679679,
“region_size”: 1922093,
“start_ts”: “2021-04-21T09:28:38Z”,
“last_heartbeat_ts”: “2021-05-14T15:40:49.391385689Z”,
“uptime”: “558h12m11.391385689s”
}
},
{
“store”: {
“id”: 141064,
“address”: “tidb-test-tikv-3.tidb-test-tikv-peer.default.svc:20160”,
“labels”: [
{
“key”: “host”,
“value”: “mgmt12.hh-b.brainpp.cn”
}
],
“version”: “4.0.4”,
“status_address”: “tidb-test-tikv-3.tidb-test-tikv-peer.default.svc:20180”,
“git_hash”: “28e3d44b00700137de4fa933066ab83e5f8306cf”,
“start_timestamp”: 1618997316,
“deploy_path”: “/”,
“last_heartbeat”: 1621230192889010374,
“state_name”: “Up”
},
“status”: {
“capacity”: “600GiB”,
“available”: “285.7GiB”,
“used_size”: “267.3GiB”,
“leader_count”: 10397,
“leader_weight”: 1,
“leader_score”: 10397,
“leader_size”: 742590,
“region_count”: 13626,
“region_weight”: 1,
“region_score”: 971118,
“region_size”: 971118,
“start_ts”: “2021-04-21T09:28:36Z”,
“last_heartbeat_ts”: “2021-05-17T05:43:12.889010374Z”,
“uptime”: “620h14m36.889010374s”
}
},
{
“store”: {
“id”: 24156011,
“address”: “tidb-test-tiflash-1.tidb-test-tiflash-peer.default.svc:3930”,
“labels”: [
{
“key”: “engine”,
“value”: “tiflash”
},
{
“key”: “host”,
“value”: “mgmt13.hh-b.brainpp.cn”
}
],
“version”: “v4.0.4”,
“peer_address”: “tidb-test-tiflash-1.tidb-test-tiflash-peer.default.svc:20170”,
“status_address”: “tidb-test-tiflash-1.tidb-test-tiflash-peer.default.svc:20292”,
“git_hash”: “bfa9128f59cf800e129152f06b12480ad78adafd”,
“start_timestamp”: 1620903735,
“deploy_path”: “/tiflash”,
“last_heartbeat”: 1621230194163462734,
“state_name”: “Up”
},
“status”: {
“capacity”: “918.7GiB”,
“available”: “182.8GiB”,
“used_size”: “41.96GiB”,
“leader_count”: 0,
“leader_weight”: 1,
“leader_score”: 0,
“leader_size”: 0,
“region_count”: 2167,
“region_weight”: 1,
“region_score”: 542076607.5407978,
“region_size”: 179462,
“start_ts”: “2021-05-13T11:02:15Z”,
“last_heartbeat_ts”: “2021-05-17T05:43:14.163462734Z”,
“uptime”: “90h40m59.163462734s”
}
},
{
“store”: {
“id”: 24156012,
“address”: “tidb-test-tiflash-0.tidb-test-tiflash-peer.default.svc:3930”,
“labels”: [
{
“key”: “engine”,
“value”: “tiflash”
},
{
“key”: “host”,
“value”: “mgmt11.hh-b.brainpp.cn”
}
],
“version”: “v4.0.4”,
“peer_address”: “tidb-test-tiflash-0.tidb-test-tiflash-peer.default.svc:20170”,
“status_address”: “tidb-test-tiflash-0.tidb-test-tiflash-peer.default.svc:20292”,
“git_hash”: “bfa9128f59cf800e129152f06b12480ad78adafd”,
“start_timestamp”: 1620903735,
“deploy_path”: “/tiflash”,
“last_heartbeat”: 1621230194884411819,
“state_name”: “Up”
},
“status”: {
“capacity”: “918.7GiB”,
“available”: “310.6GiB”,
“used_size”: “52.92GiB”,
“leader_count”: 0,
“leader_weight”: 1,
“leader_score”: 0,
“leader_size”: 0,
“region_count”: 2786,
“region_weight”: 1,
“region_score”: 231135,
“region_size”: 231135,
“start_ts”: “2021-05-13T11:02:15Z”,
“last_heartbeat_ts”: “2021-05-17T05:43:14.884411819Z”,
“uptime”: “90h40m59.884411819s”
}
},
{
“store”: {
“id”: 24156013,
“address”: “tidb-test-tiflash-2.tidb-test-tiflash-peer.default.svc:3930”,
“state”: 1,
“labels”: [
{
“key”: “engine”,
“value”: “tiflash”
},
{
“key”: “host”,
“value”: “mgmt12.hh-b.brainpp.cn”
}
],
“version”: “v4.0.4”,
“peer_address”: “tidb-test-tiflash-2.tidb-test-tiflash-peer.default.svc:20170”,
“status_address”: “tidb-test-tiflash-2.tidb-test-tiflash-peer.default.svc:20292”,
“git_hash”: “bfa9128f59cf800e129152f06b12480ad78adafd”,
“start_timestamp”: 1620903735,
“deploy_path”: “/tiflash”,
“last_heartbeat”: 1621230194128329418,
“state_name”: “Offline”
},
“status”: {
“capacity”: “918.7GiB”,
“available”: “285.7GiB”,
“used_size”: “28.74GiB”,
“leader_count”: 0,
“leader_weight”: 1,
“leader_score”: 0,
“leader_size”: 0,
“region_count”: 1438,
“region_weight”: 1,
“region_score”: 120494,
“region_size”: 120494,
“start_ts”: “2021-05-13T11:02:15Z”,
“last_heartbeat_ts”: “2021-05-17T05:43:14.128329418Z”,
“uptime”: “90h40m59.128329418s”
}
},
{
“store”: {
“id”: 1,
“address”: “tidb-test-tikv-0.tidb-test-tikv-peer.default.svc:20160”,
“labels”: [
{
“key”: “host”,
“value”: “mgmt13.hh-b.brainpp.cn”
}
],
“version”: “4.0.4”,
“status_address”: “tidb-test-tikv-0.tidb-test-tikv-peer.default.svc:20180”,
“git_hash”: “28e3d44b00700137de4fa933066ab83e5f8306cf”,
“start_timestamp”: 1618997317,
“deploy_path”: “/”,
“last_heartbeat”: 1621090849017378690,
“state_name”: “Down”
},
“status”: {
“capacity”: “600GiB”,
“available”: “70.13GiB”,
“used_size”: “529.9GiB”,
“leader_count”: 3675,
“leader_weight”: 1,
“leader_score”: 3675,
“leader_size”: 267232,
“region_count”: 26749,
“region_weight”: 1,
“region_score”: 983161298.89606,
“region_size”: 1918901,
“start_ts”: “2021-04-21T09:28:37Z”,
“last_heartbeat_ts”: “2021-05-15T15:00:49.01737869Z”,
“uptime”: “581h32m12.01737869s”
}
}
]
}
业务访问集群有没有什么报错信息或者异常的?
业务已经不查询了,原因是olap场景,磁盘满tikv扩容后, tiflash 一直不可用。周一来发现tikv 又跪了,能否从数据库层面定位问题呢,感觉tikv down了,也没发现error类日志打印,问题定位不明确,初学tidb,请大佬帮分析
先简单通过 client 连接下数据库,使用下数据库看是否有问题
因为你这个只是 tikv 的状态显示为 down 了,看进程应该是没有问题的,因为 pod 没有一直重启。
需要先确认是状态显示异常的问题还是 tikv 进程本身就有问题。
连接数据库正常,能查出部分表数据,但是某些表select查询时报错,报错信息是ERROR 9001 (HY000): PD server timeout,麻烦您抽丝剥茧,再帮分析下
从现象上来和这个一样 使用tidb官方工具:mydumper导出,loader导入工具,进行导入数据时,报错如下: **Error 9001: PD server timeout** - #13,来自 vcdog ,检查kv pd db版本是一致的,
client 查询部分表数据报错如下(其它部分表查询正常):

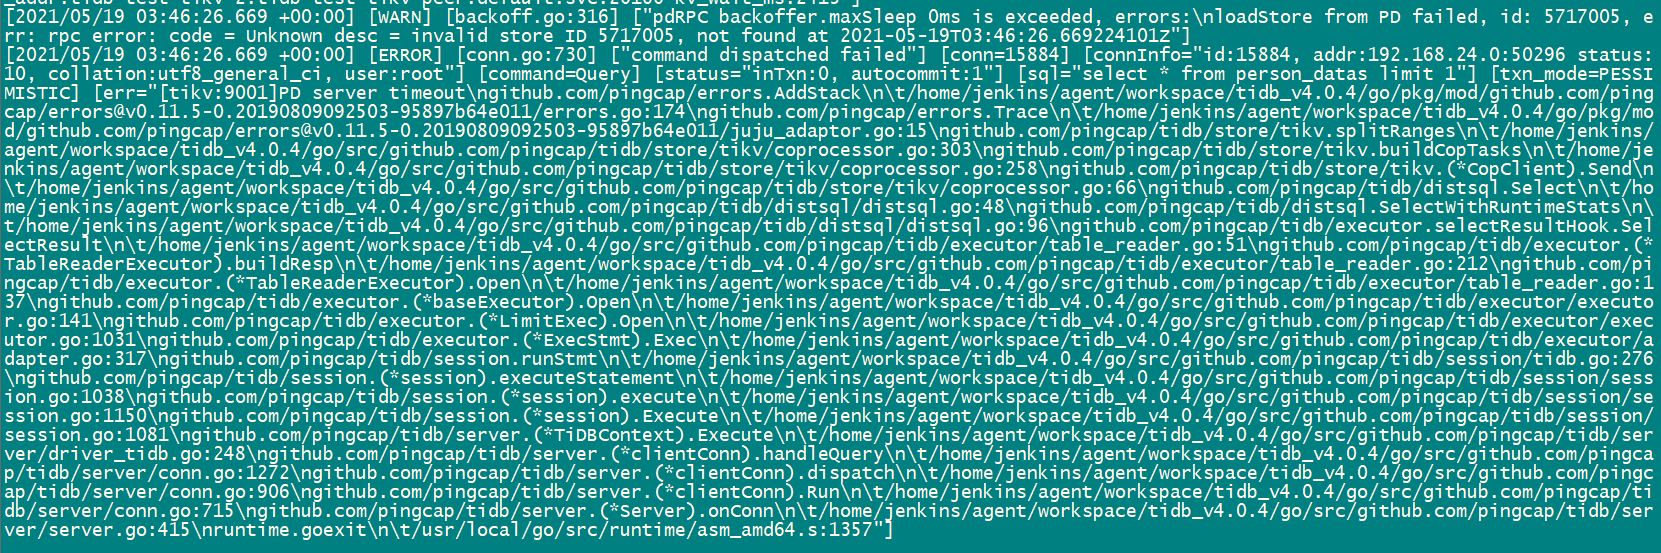
查看tidb日志 error日志如下:
因存储满,tikv做过扩容,没做缩容,增加了一台服务器 。目前是3副本,4 nodes 。tiflash available 为0 做过缩容节点删除操作,重新添加节点操作。
能否尝试重启一下集群然后在执行下 SQL 看下是否还有 PD server timeout 的问题?
从日志看,PD server timeout 是因为,想要访问 store id 571705 这个节点的信息,但是 PD 中并没有这个节点的信息,导致访问 pd 的 rpc 请求一直在重启,最后达到最大的重试超时时间,报了 PD server timeout 的错误。
至于 tidb 为什么要访问 store id 为 571705 的节点信息,怀疑是 region cache 引起的,重启集群的话,可以让 tidb 节点重新刷新 region cache 。
在 PD 日志中 grep 一下 571705 这个 store id 看下,看能不能看到历史的记录,确认一下是 tikv 节点还是 tiflash 节点
grep 3个pd pod没有发现这个571705 ,pod重启多次,log已丢失很多。可以删除所有 tiflash (replica 0)来验证
当前store情况:
/ # ./pd-ctl store
{
“count”: 4,
“stores”: [
{
“store”: {
“id”: 141064,
“address”: “tidb-test-tikv-3.tidb-test-tikv-peer.default.svc:20160”,
“labels”: [
{
“key”: “host”,
“value”: “mgmt12.hh-b.brainpp.cn”
}
],
“version”: “4.0.4”,
“status_address”: “tidb-test-tikv-3.tidb-test-tikv-peer.default.svc:20180”,
“git_hash”: “28e3d44b00700137de4fa933066ab83e5f8306cf”,
“start_timestamp”: 1621411882,
“deploy_path”: “/”,
“last_heartbeat”: 1621427225815682765,
“state_name”: “Up”
},
“status”: {
“capacity”: “650GiB”,
“available”: “314.4GiB”,
“used_size”: “266.9GiB”,
“leader_count”: 9540,
“leader_weight”: 1,
“leader_score”: 9540,
“leader_size”: 681245,
“region_count”: 13620,
“region_weight”: 1,
“region_score”: 972253,
“region_size”: 972253,
“start_ts”: “2021-05-19T08:11:22Z”,
“last_heartbeat_ts”: “2021-05-19T12:27:05.815682765Z”,
“uptime”: “4h15m43.815682765s”
}
},
{
“store”: {
“id”: 1,
“address”: “tidb-test-tikv-0.tidb-test-tikv-peer.default.svc:20160”,
“labels”: [
{
“key”: “host”,
“value”: “mgmt13.hh-b.brainpp.cn”
}
],
“version”: “4.0.4”,
“status_address”: “tidb-test-tikv-0.tidb-test-tikv-peer.default.svc:20180”,
“git_hash”: “28e3d44b00700137de4fa933066ab83e5f8306cf”,
“start_timestamp”: 1621411722,
“deploy_path”: “/”,
“last_heartbeat”: 1621427218230705969,
“state_name”: “Up”
},
“status”: {
“capacity”: “650GiB”,
“available”: “120.3GiB”,
“used_size”: “529.7GiB”,
“leader_count”: 5260,
“leader_weight”: 1,
“leader_score”: 5260,
“leader_size”: 387512,
“region_count”: 26804,
“region_weight”: 1,
“region_score”: 617922067.8012838,
“region_size”: 1938099,
“start_ts”: “2021-05-19T08:08:42Z”,
“last_heartbeat_ts”: “2021-05-19T12:26:58.230705969Z”,
“uptime”: “4h18m16.230705969s”
}
},
{
“store”: {
“id”: 12,
“address”: “tidb-test-tikv-2.tidb-test-tikv-peer.default.svc:20160”,
“labels”: [
{
“key”: “host”,
“value”: “mgmt12.hh-b.brainpp.cn”
}
],
“version”: “4.0.4”,
“status_address”: “tidb-test-tikv-2.tidb-test-tikv-peer.default.svc:20180”,
“git_hash”: “28e3d44b00700137de4fa933066ab83e5f8306cf”,
“start_timestamp”: 1621411841,
“deploy_path”: “/”,
“last_heartbeat”: 1621427231174412304,
“state_name”: “Up”
},
“status”: {
“capacity”: “650GiB”,
“available”: “314.4GiB”,
“used_size”: “307.3GiB”,
“leader_count”: 6424,
“leader_weight”: 1,
“leader_score”: 6424,
“leader_size”: 463125,
“region_count”: 13295,
“region_weight”: 1,
“region_score”: 966252,
“region_size”: 966252,
“start_ts”: “2021-05-19T08:10:41Z”,
“last_heartbeat_ts”: “2021-05-19T12:27:11.174412304Z”,
“uptime”: “4h16m30.174412304s”
}
},
{
“store”: {
“id”: 45,
“address”: “tidb-test-tikv-1.tidb-test-tikv-peer.default.svc:20160”,
“labels”: [
{
“key”: “host”,
“value”: “mgmt11.hh-b.brainpp.cn”
}
],
“version”: “4.0.4”,
“status_address”: “tidb-test-tikv-1.tidb-test-tikv-peer.default.svc:20180”,
“git_hash”: “28e3d44b00700137de4fa933066ab83e5f8306cf”,
“start_timestamp”: 1621411842,
“deploy_path”: “/”,
“last_heartbeat”: 1621417218284338225,
“state_name”: “Down”
},
“status”: {
“capacity”: “650GiB”,
“available”: “119.4GiB”,
“used_size”: “530.6GiB”,
“leader_count”: 5515,
“leader_weight”: 1,
“leader_score”: 5515,
“leader_size”: 406340,
“region_count”: 26786,
“region_weight”: 1,
“region_score”: 625211696.157073,
“region_size”: 1937939,
“start_ts”: “2021-05-19T08:10:42Z”,
“last_heartbeat_ts”: “2021-05-19T09:40:18.284338225Z”,
“uptime”: “1h29m36.284338225s”
}
}
]
}
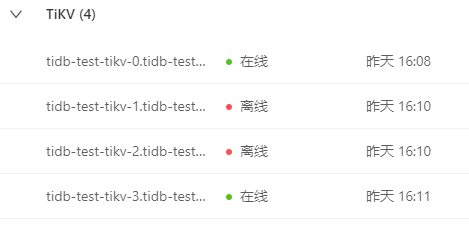
当前pod情况
上传一下完整的 tidb.log 日志文件看下
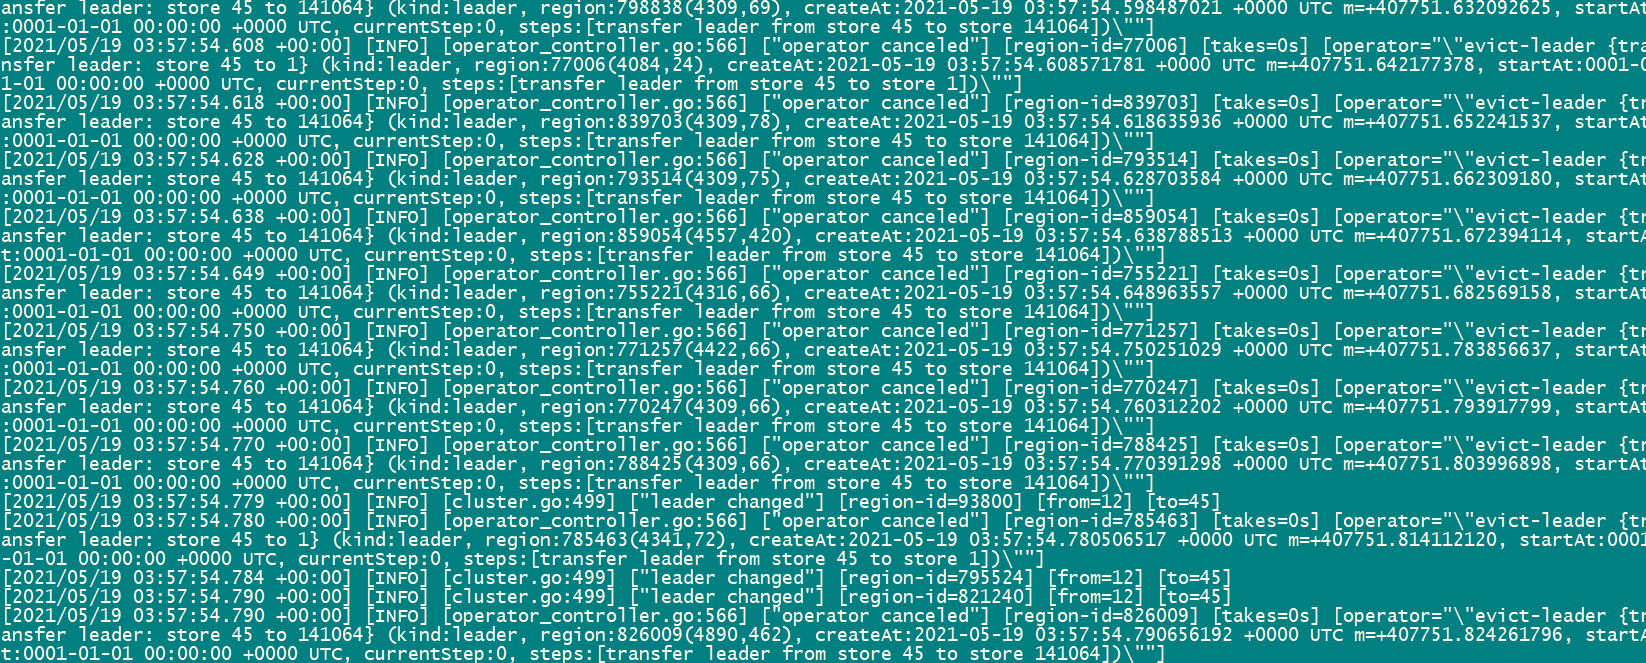
两个pod 的tidb log,包括昨天重启以后的所有日志。请帮分析
tidb.log (6.3 MB)
tikv 隔断时间会离线,重启pod后一段时间内会在线
重启pod之后,dashboard显示tikv正常。