【 TiDB 使用环境】线上
【 TiDB 版本】5.7.25-TiDB-v5.3.0
【遇到的问题】业务连不上
【复现路径】做过哪些操作出现的问题
【问题现象及影响】
业务那边反馈连不上tidb
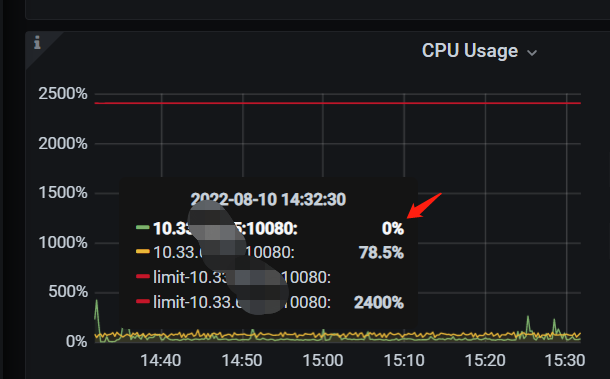
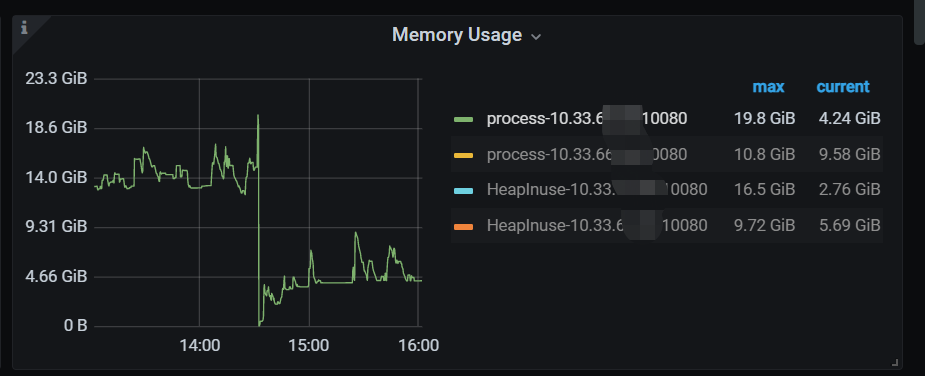
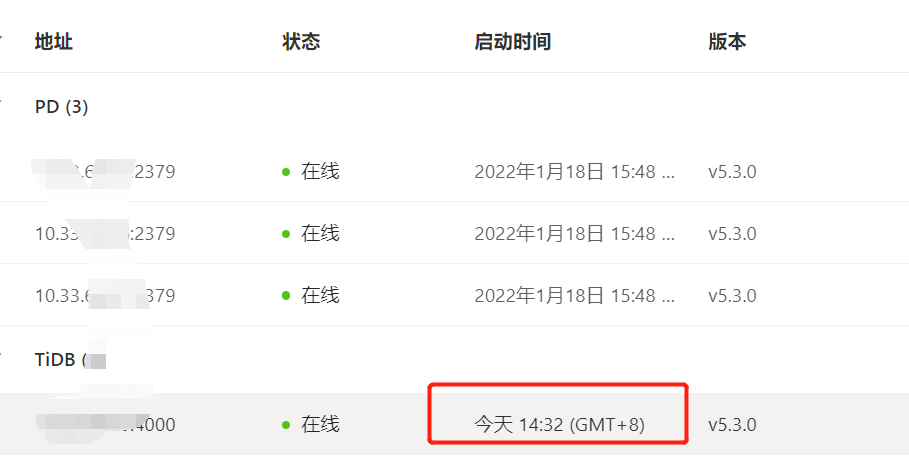
我去dashboard 上看到tidb重启了
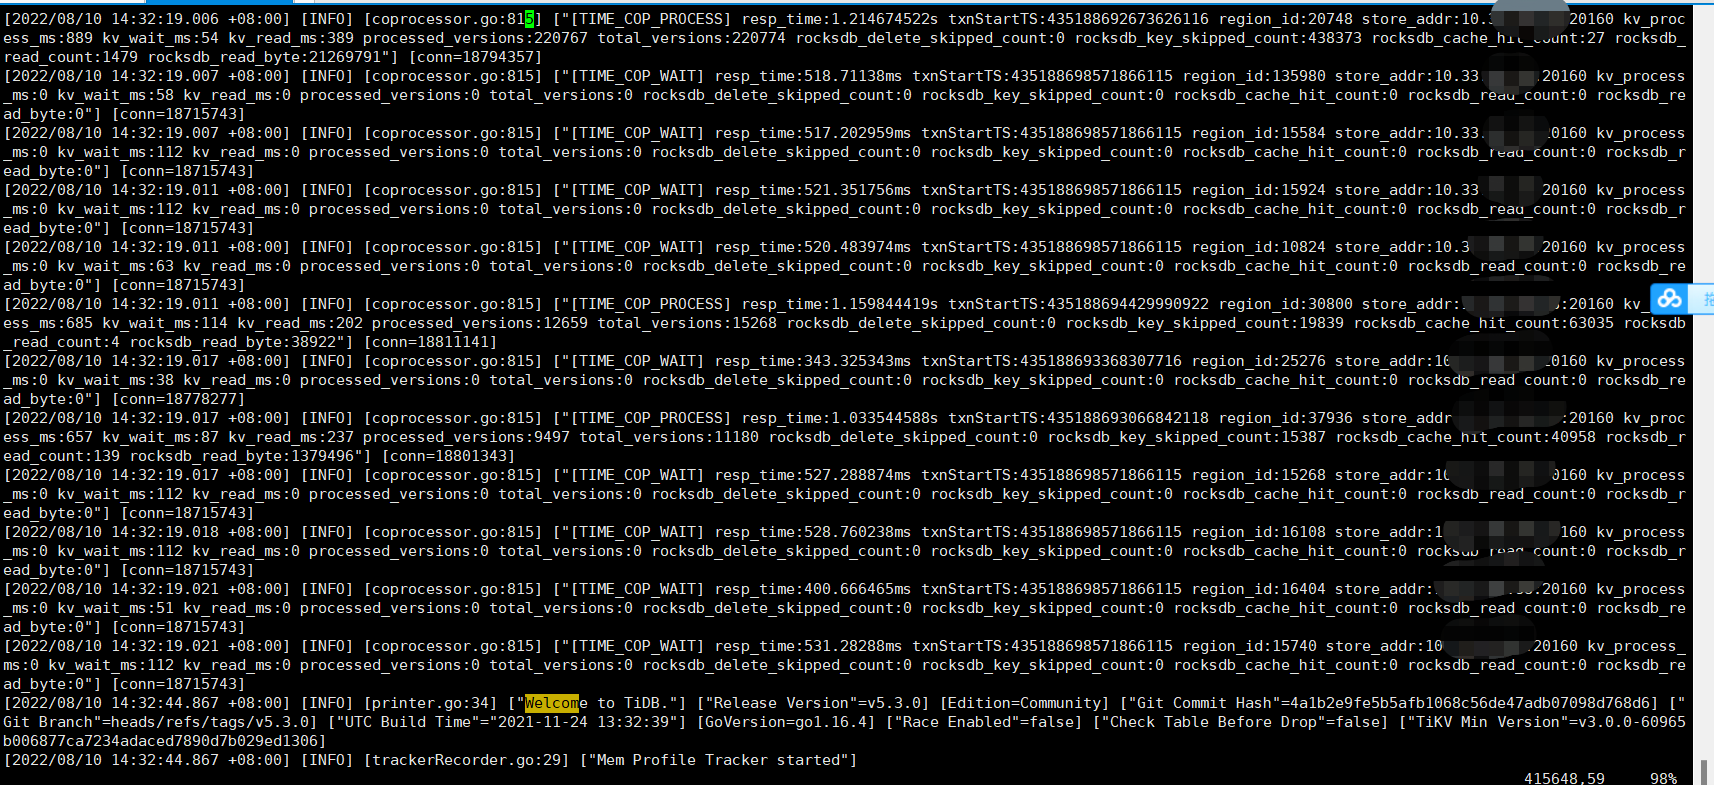
然后去找了tidb.log
如下:
2022/08/10 14:32:44.867 +08:00] [INFO] [trackerRecorder.go:29] [“Mem Profile Tracker started”]
[2022/08/10 14:32:44.868 +08:00] [INFO] [printer.go:48] [“loaded config”] [config=“{"host":"0.0.0.0","advertise-address":"10.33.xx.xx","port":4000,"cors":"","store":"tikv","path":"10.33…xx.xx:2379,10.33…xx.xx:2379,10.33…xx.xx:2379","socket":"/tmp/tidb-4000.sock","lease":"45s","run-ddl":true,"split-table":true,"token-limit":1000,"oom-use-tmp-storage":true,"tmp-storage-path":"/tmp/1003_tidb/MC4wLjAuMDo0MDAwLzAuMC4wLjA6MTAwODA=/tmp-storage","oom-action":"cancel","mem-quota-query":1073741824,"tmp-storage-quota":-1,"enable-batch-dml":false,"lower-case-table-names":2,"server-version":"","log":{"level":"info","format":"text","disable-timestamp":null,"enable-timestamp":null,"disable-error-stack":null,"enable-error-stack":null,"file":{"filename":"/httx/run/tidb/deploy/tidb-4000/log/tidb.log","max-size":300,"max-days":0,"max-backups":0},"enable-slow-log":true,"slow-query-file":"/httx/run/tidb/deploy/tidb-4000/log/tidb_slow_query.log","slow-threshold":300,"expensive-threshold":10000,"query-log-max-len":4096,"record-plan-in-slow-log":1},"security":{"skip-grant-table":false,"ssl-ca":"","ssl-cert":"","ssl-key":"","require-secure-transport":false,"cluster-ssl-ca":"","cluster-ssl-cert":"","cluster-ssl-key":"","cluster-verify-cn":null,"spilled-file-encryption-method":"plaintext","enable-sem":false,"auto-tls":false,"tls-version":"","rsa-key-size":4096,"secure-bootstrap":false},"status":{"status-host":"0.0.0.0","metrics-addr":"","status-port":10080,"metrics-interval":15,"report-status":true,"record-db-qps":false},"performance":{"max-procs":0,"max-memory":0,"server-memory-quota":0,"memory-usage-alarm-ratio":0.8,"stats-lease":"3s","stmt-count-limit":5000,"feedback-probability":0,"query-feedback-limit":512,"pseudo-estimate-ratio":0.8,"force-priority":"NO_PRIORITY","bind-info-lease":"3s","txn-entry-size-limit":6291456,"txn-total-size-limit":104857600,"tcp-keep-alive":true,"tcp-no-delay":true,"cross-join":true,"run-auto-analyze":true,"distinct-agg-push-down":false,"committer-concurrency":128,"max-txn-ttl":3600000,"mem-profile-interval":"1m","index-usage-sync-lease":"0s","plan-replayer-gc-lease":"10m","gogc":100,"enforce-mpp":false},"prepared-plan-cache":{"enabled":false,"capacity":1000,"memory-guard-ratio":0.1},"opentracing":{"enable":false,"rpc-metrics":false,"sampler":{"type":"const","param":1,"sampling-server-url":"","max-operations":0,"sampling-refresh-interval":0},"reporter":{"queue-size":0,"buffer-flush-interval":0,"log-spans":false,"local-agent-host-port":""}},"proxy-protocol":{"networks":"","header-timeout":5},"pd-client":{"pd-server-timeout":3},"tikv-client":{"grpc-connection-count":4,"grpc-keepalive-time":10,"grpc-keepalive-timeout":3,"grpc-compression-type":"none","commit-timeout":"41s","async-commit":{"keys-limit":256,"total-key-size-limit":4096,"safe-window":2000000000,"allowed-clock-drift":500000000},"max-batch-size":128,"overload-threshold":200,"max-batch-wait-time":0,"batch-wait-size":8,"enable-chunk-rpc":true,"region-cache-ttl":600,"store-limit":0,"store-liveness-timeout":"1s","copr-cache":{"capacity-mb":1000},"ttl-refreshed-txn-size":33554432,"resolve-lock-lite-threshold":16},"binlog":{"enable":true,"ignore-error":true,"write-timeout":"15s","binlog-socket":"","strategy":"range"},"compatible-kill-query":false,"plugin":{"dir":"/data/deploy/plugin","load":""},"pessimistic-txn":{"max-retry-count":256,"deadlock-history-capacity":10,"deadlock-history-collect-retryable":false},"check-mb4-value-in-utf8":true,"max-index-length":3072,"index-limit":64,"table-column-count-limit":1017,"graceful-wait-before-shutdown":0,"alter-primary-key":false,"treat-old-version-utf8-as-utf8mb4":true,"enable-table-lock":false,"delay-clean-table-lock":0,"split-region-max-num":1000,"stmt-summary":{"enable":true,"enable-internal-query":false,"max-stmt-count":3000,"max-sql-length":4096,"refresh-interval":1800,"history-size":24},"top-sql":{"receiver-address":""},"repair-mode":false,"repair-table-list":[],"isolation-read":{"engines":["tikv","tiflash","tidb"]},"max-server-connections":0,"new_collations_enabled_on_first_bootstrap":false,"experimental":{"allow-expression-index":false},"enable-collect-execution-info":true,"skip-register-to-dashboard":false,"enable-telemetry":true,"labels":{},"enable-global-index":false,"deprecate-integer-display-length":false,"enable-enum-length-limit":true,"stores-refresh-interval":60,"enable-tcp4-only":false,"enable-forwarding":false,"max-ballast-object-size":0,"ballast-object-size":0}”]
[2022/08/10 14:32:44.868 +08:00] [INFO] [client.go:352] [“[pd] create pd client with endpoints”] [pd-address=“[10.33…xx.xx:2379,10.33…xx.xx:2379,10.33…xx.xx:2379]”]
[2022/08/10 14:32:44.877 +08:00] [INFO] [base_client.go:349] [“[pd] switch leader”] [new-leader=http://10.33.xx.xx:2379] [old-leader=]
[2022/08/10 14:32:44.877 +08:00] [INFO] [base_client.go:104] [“[pd] init cluster id”] [cluster-id=7054449822183088374]
[2022/08/10 14:32:44.877 +08:00] [INFO] [client.go:648] [“[pd] tso dispatcher created”] [dc-location=global]
[2022/08/10 14:32:44.877 +08:00] [ERROR] [client.go:845] [“[pd] update connection contexts failed”] [dc=global] [error=“rpc error: code = Canceled desc = context canceled”]
[2022/08/10 14:32:44.877 +08:00] [INFO] [client.go:666] [“[pd] exit tso dispatcher”] [dc-location=global]
[2022/08/10 14:32:44.879 +08:00] [INFO] [main.go:340] [tidb-server] [“create pumps client success, ignore binlog error”=true]
[2022/08/10 14:32:44.879 +08:00] [INFO] [main.go:349] [“disable Prometheus push client”]
grafana 监控也显示 tidb cpu跌为0