顧問好,
v4.0.12 與v5.0.0皆是同樣的狀況
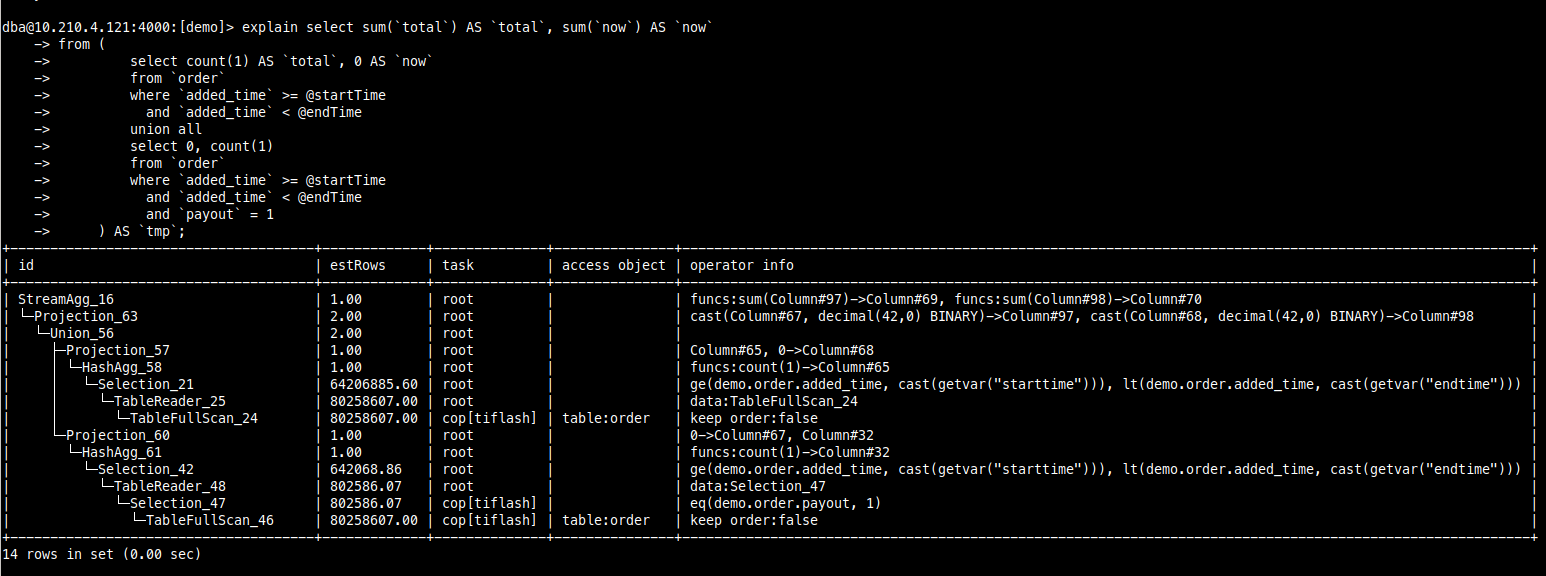
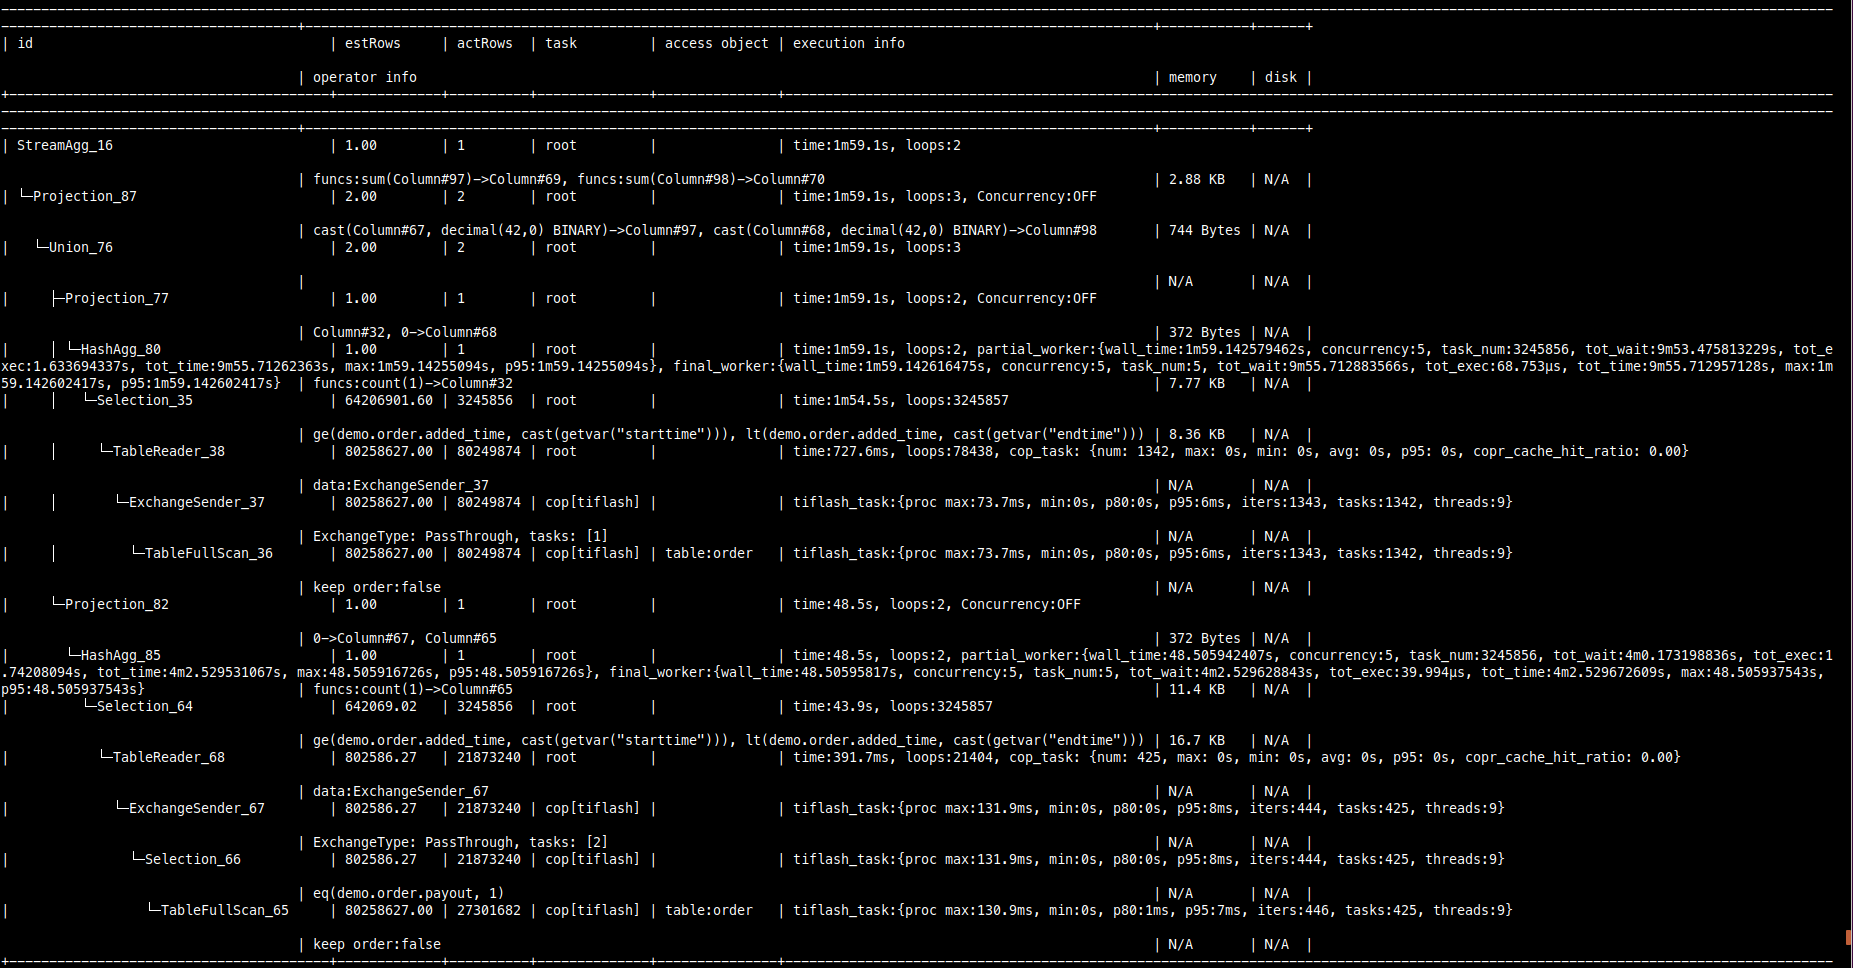
1.帶變數查詢(EXPLAIN ANALYZE)
±---------------------------------------±------------±---------±-------------±--------------±------------------------------------------------------------------------------------------------------------------------------------------------------------------------------------------------------------------------------------------------------------------------------------------------------------------------------------------------------------------------------------------------------------±---------------------------------------------------------------------------------------------------------±----------±-----+
| id | estRows | actRows | task | access object | execution info | operator info | memory | disk |
±---------------------------------------±------------±---------±-------------±--------------±------------------------------------------------------------------------------------------------------------------------------------------------------------------------------------------------------------------------------------------------------------------------------------------------------------------------------------------------------------------------------------------------------------±---------------------------------------------------------------------------------------------------------±----------±-----+
| StreamAgg_16 | 1.00 | 1 | root | | time:1m59.1s, loops:2 | funcs:sum(Column#97)->Column#69, funcs:sum(Column#98)->Column#70 | 2.88 KB | N/A |
| └─Projection_87 | 2.00 | 2 | root | | time:1m59.1s, loops:3, Concurrency:OFF | cast(Column#67, decimal(42,0) BINARY)->Column#97, cast(Column#68, decimal(42,0) BINARY)->Column#98 | 744 Bytes | N/A |
| └─Union_76 | 2.00 | 2 | root | | time:1m59.1s, loops:3 | | N/A | N/A |
| ├─Projection_77 | 1.00 | 1 | root | | time:1m59.1s, loops:2, Concurrency:OFF | Column#32, 0->Column#68 | 372 Bytes | N/A |
| │ └─HashAgg_80 | 1.00 | 1 | root | | time:1m59.1s, loops:2, partial_worker:{wall_time:1m59.142579462s, concurrency:5, task_num:3245856, tot_wait:9m53.475813229s, tot_exec:1.633694337s, tot_time:9m55.71262363s, max:1m59.14255094s, p95:1m59.14255094s}, final_worker:{wall_time:1m59.142616475s, concurrency:5, task_num:5, tot_wait:9m55.712883566s, tot_exec:68.753µs, tot_time:9m55.712957128s, max:1m59.142602417s, p95:1m59.142602417s} | funcs:count(1)->Column#32 | 7.77 KB | N/A |
| │ └─Selection_35 | 64206901.60 | 3245856 | root | | time:1m54.5s, loops:3245857 | ge(demo.order.added_time, cast(getvar(“starttime”))), lt(demo.order.added_time, cast(getvar(“endtime”))) | 8.36 KB | N/A |
| │ └─TableReader_38 | 80258627.00 | 80249874 | root | | time:727.6ms, loops:78438, cop_task: {num: 1342, max: 0s, min: 0s, avg: 0s, p95: 0s, copr_cache_hit_ratio: 0.00} | data:ExchangeSender_37 | N/A | N/A |
| │ └─ExchangeSender_37 | 80258627.00 | 80249874 | cop[tiflash] | | tiflash_task:{proc max:73.7ms, min:0s, p80:0s, p95:6ms, iters:1343, tasks:1342, threads:9} | ExchangeType: PassThrough, tasks: [1] | N/A | N/A |
| │ └─TableFullScan_36 | 80258627.00 | 80249874 | cop[tiflash] | table:order | tiflash_task:{proc max:73.7ms, min:0s, p80:0s, p95:6ms, iters:1343, tasks:1342, threads:9} | keep order:false | N/A | N/A |
| └─Projection_82 | 1.00 | 1 | root | | time:48.5s, loops:2, Concurrency:OFF | 0->Column#67, Column#65 | 372 Bytes | N/A |
| └─HashAgg_85 | 1.00 | 1 | root | | time:48.5s, loops:2, partial_worker:{wall_time:48.505942407s, concurrency:5, task_num:3245856, tot_wait:4m0.173198836s, tot_exec:1.74208094s, tot_time:4m2.529531067s, max:48.505916726s, p95:48.505916726s}, final_worker:{wall_time:48.50595817s, concurrency:5, task_num:5, tot_wait:4m2.529628843s, tot_exec:39.994µs, tot_time:4m2.529672609s, max:48.505937543s, p95:48.505937543s} | funcs:count(1)->Column#65 | 11.4 KB | N/A |
| └─Selection_64 | 642069.02 | 3245856 | root | | time:43.9s, loops:3245857 | ge(demo.order.added_time, cast(getvar(“starttime”))), lt(demo.order.added_time, cast(getvar(“endtime”))) | 16.7 KB | N/A |
| └─TableReader_68 | 802586.27 | 21873240 | root | | time:391.7ms, loops:21404, cop_task: {num: 425, max: 0s, min: 0s, avg: 0s, p95: 0s, copr_cache_hit_ratio: 0.00} | data:ExchangeSender_67 | N/A | N/A |
| └─ExchangeSender_67 | 802586.27 | 21873240 | cop[tiflash] | | tiflash_task:{proc max:131.9ms, min:0s, p80:0s, p95:8ms, iters:444, tasks:425, threads:9} | ExchangeType: PassThrough, tasks: [2] | N/A | N/A |
| └─Selection_66 | 802586.27 | 21873240 | cop[tiflash] | | tiflash_task:{proc max:131.9ms, min:0s, p80:0s, p95:8ms, iters:444, tasks:425, threads:9} | eq(demo.order.payout, 1) | N/A | N/A |
| └─TableFullScan_65 | 80258627.00 | 27301682 | cop[tiflash] | table:order | tiflash_task:{proc max:130.9ms, min:0s, p80:1ms, p95:7ms, iters:446, tasks:425, threads:9} | keep order:false | N/A | N/A |
±---------------------------------------±------------±---------±-------------±--------------±------------------------------------------------------------------------------------------------------------------------------------------------------------------------------------------------------------------------------------------------------------------------------------------------------------------------------------------------------------------------------------------------------------±---------------------------------------------------------------------------------------------------------±----------±-----+
16 rows in set (1 min 59.15 sec)
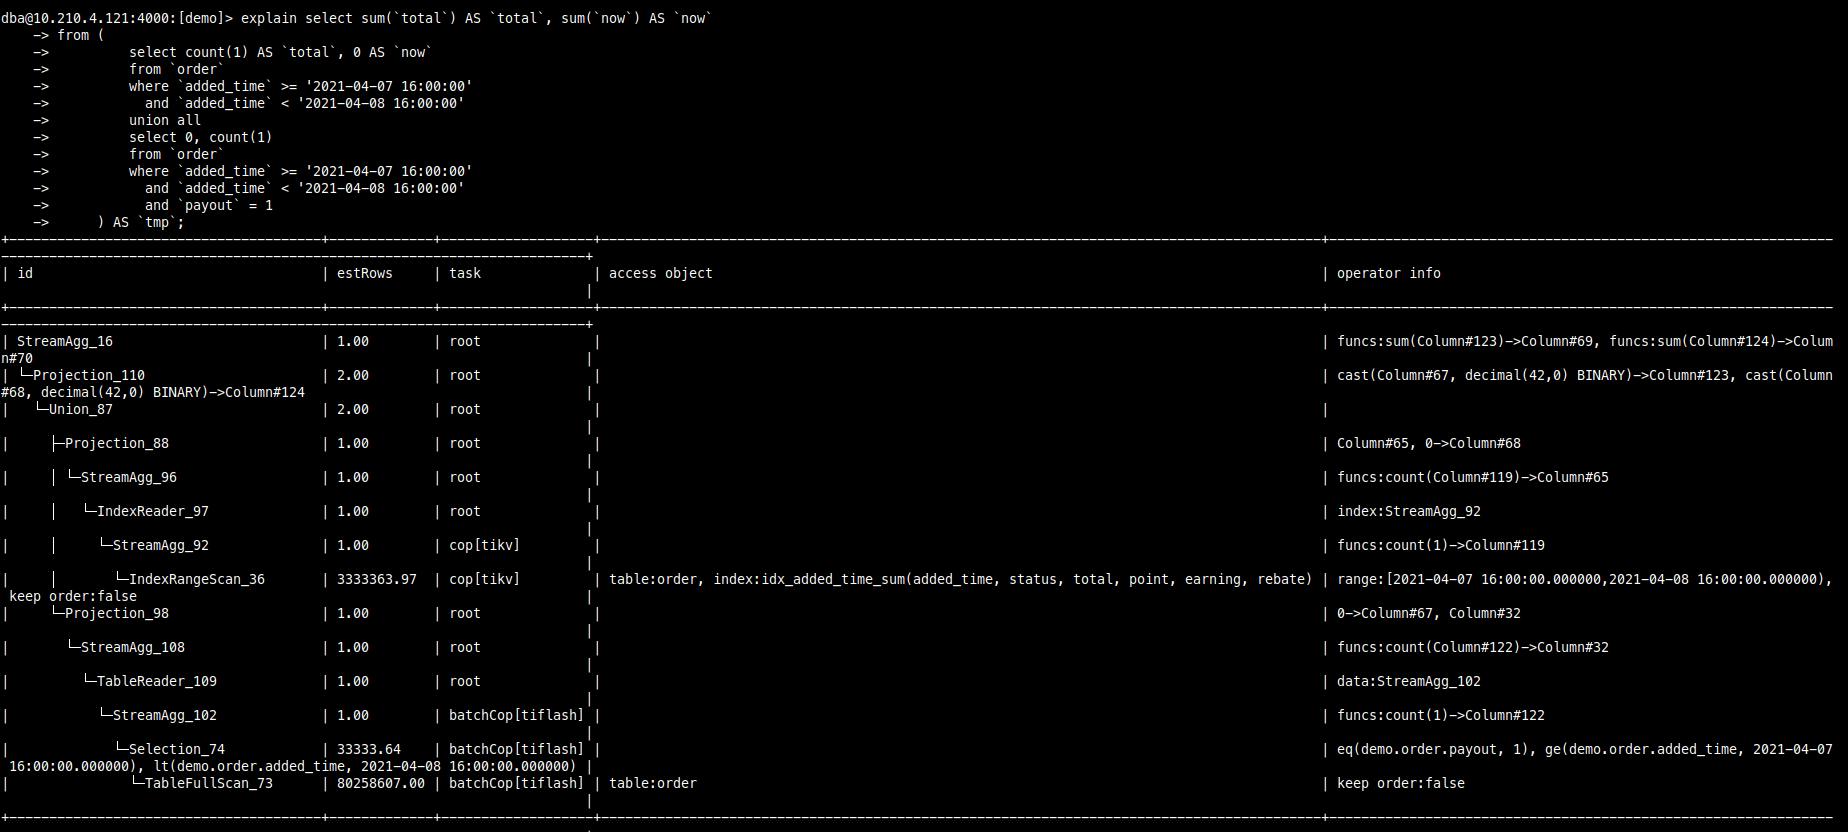
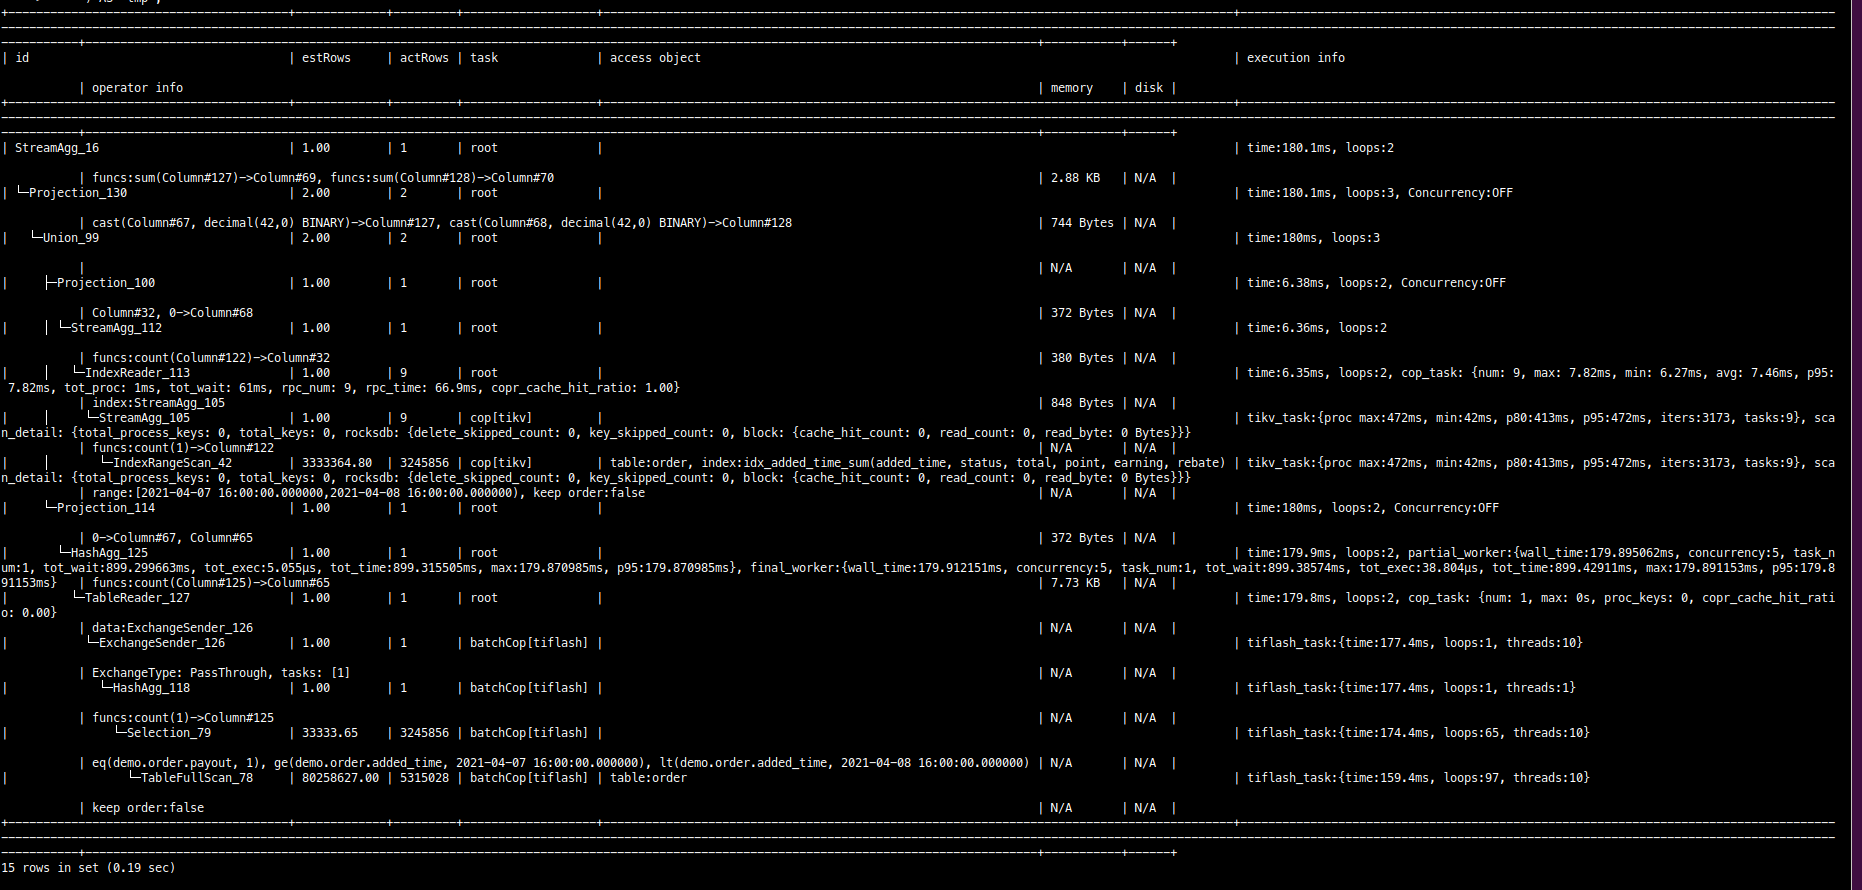
2. 直接給值查詢
±---------------------------------------±------------±--------±------------------±-----------------------------------------------------------------------------------------±---------------------------------------------------------------------------------------------------------------------------------------------------------------------------------------------------------------------------------------------------------------------------------------------------------------------------------------------------------------------±---------------------------------------------------------------------------------------------------------------------------------------±----------±-----+
| id | estRows | actRows | task | access object | execution info | operator info | memory | disk |
±---------------------------------------±------------±--------±------------------±-----------------------------------------------------------------------------------------±---------------------------------------------------------------------------------------------------------------------------------------------------------------------------------------------------------------------------------------------------------------------------------------------------------------------------------------------------------------------±---------------------------------------------------------------------------------------------------------------------------------------±----------±-----+
| StreamAgg_16 | 1.00 | 1 | root | | time:180.1ms, loops:2 | funcs:sum(Column#127)->Column#69, funcs:sum(Column#128)->Column#70 | 2.88 KB | N/A |
| └─Projection_130 | 2.00 | 2 | root | | time:180.1ms, loops:3, Concurrency:OFF | cast(Column#67, decimal(42,0) BINARY)->Column#127, cast(Column#68, decimal(42,0) BINARY)->Column#128 | 744 Bytes | N/A |
| └─Union_99 | 2.00 | 2 | root | | time:180ms, loops:3 | | N/A | N/A |
| ├─Projection_100 | 1.00 | 1 | root | | time:6.38ms, loops:2, Concurrency:OFF | Column#32, 0->Column#68 | 372 Bytes | N/A |
| │ └─StreamAgg_112 | 1.00 | 1 | root | | time:6.36ms, loops:2 | funcs:count(Column#122)->Column#32 | 380 Bytes | N/A |
| │ └─IndexReader_113 | 1.00 | 9 | root | | time:6.35ms, loops:2, cop_task: {num: 9, max: 7.82ms, min: 6.27ms, avg: 7.46ms, p95: 7.82ms, tot_proc: 1ms, tot_wait: 61ms, rpc_num: 9, rpc_time: 66.9ms, copr_cache_hit_ratio: 1.00} | index:StreamAgg_105 | 848 Bytes | N/A |
| │ └─StreamAgg_105 | 1.00 | 9 | cop[tikv] | | tikv_task:{proc max:472ms, min:42ms, p80:413ms, p95:472ms, iters:3173, tasks:9}, scan_detail: {total_process_keys: 0, total_keys: 0, rocksdb: {delete_skipped_count: 0, key_skipped_count: 0, block: {cache_hit_count: 0, read_count: 0, read_byte: 0 Bytes}}} | funcs:count(1)->Column#122 | N/A | N/A |
| │ └─IndexRangeScan_42 | 3333364.80 | 3245856 | cop[tikv] | table:order, index:idx_added_time_sum(added_time, status, total, point, earning, rebate) | tikv_task:{proc max:472ms, min:42ms, p80:413ms, p95:472ms, iters:3173, tasks:9}, scan_detail: {total_process_keys: 0, total_keys: 0, rocksdb: {delete_skipped_count: 0, key_skipped_count: 0, block: {cache_hit_count: 0, read_count: 0, read_byte: 0 Bytes}}} | range:[2021-04-07 16:00:00.000000,2021-04-08 16:00:00.000000), keep order:false | N/A | N/A |
| └─Projection_114 | 1.00 | 1 | root | | time:180ms, loops:2, Concurrency:OFF | 0->Column#67, Column#65 | 372 Bytes | N/A |
| └─HashAgg_125 | 1.00 | 1 | root | | time:179.9ms, loops:2, partial_worker:{wall_time:179.895062ms, concurrency:5, task_num:1, tot_wait:899.299663ms, tot_exec:5.055µs, tot_time:899.315505ms, max:179.870985ms, p95:179.870985ms}, final_worker:{wall_time:179.912151ms, concurrency:5, task_num:1, tot_wait:899.38574ms, tot_exec:38.804µs, tot_time:899.42911ms, max:179.891153ms, p95:179.891153ms} | funcs:count(Column#125)->Column#65 | 7.73 KB | N/A |
| └─TableReader_127 | 1.00 | 1 | root | | time:179.8ms, loops:2, cop_task: {num: 1, max: 0s, proc_keys: 0, copr_cache_hit_ratio: 0.00} | data:ExchangeSender_126 | N/A | N/A |
| └─ExchangeSender_126 | 1.00 | 1 | batchCop[tiflash] | | tiflash_task:{time:177.4ms, loops:1, threads:10} | ExchangeType: PassThrough, tasks: [1] | N/A | N/A |
| └─HashAgg_118 | 1.00 | 1 | batchCop[tiflash] | | tiflash_task:{time:177.4ms, loops:1, threads:1} | funcs:count(1)->Column#125 | N/A | N/A |
| └─Selection_79 | 33333.65 | 3245856 | batchCop[tiflash] | | tiflash_task:{time:174.4ms, loops:65, threads:10} | eq(demo.order.payout, 1), ge(demo.order.added_time, 2021-04-07 16:00:00.000000), lt(demo.order.added_time, 2021-04-08 16:00:00.000000) | N/A | N/A |
| └─TableFullScan_78 | 80258627.00 | 5315028 | batchCop[tiflash] | table:order | tiflash_task:{time:159.4ms, loops:97, threads:10} | keep order:false | N/A | N/A |
±---------------------------------------±------------±--------±------------------±-----------------------------------------------------------------------------------------±---------------------------------------------------------------------------------------------------------------------------------------------------------------------------------------------------------------------------------------------------------------------------------------------------------------------------------------------------------------------±---------------------------------------------------------------------------------------------------------------------------------------±----------±-----+
15 rows in set (0.19 sec)