【 TiDB 使用环境`】生产环境
【 TiDB 版本】
6.1.0
【遇到的问题】
tiflash重启
【问题现象及影响】
tiflash_error.log:

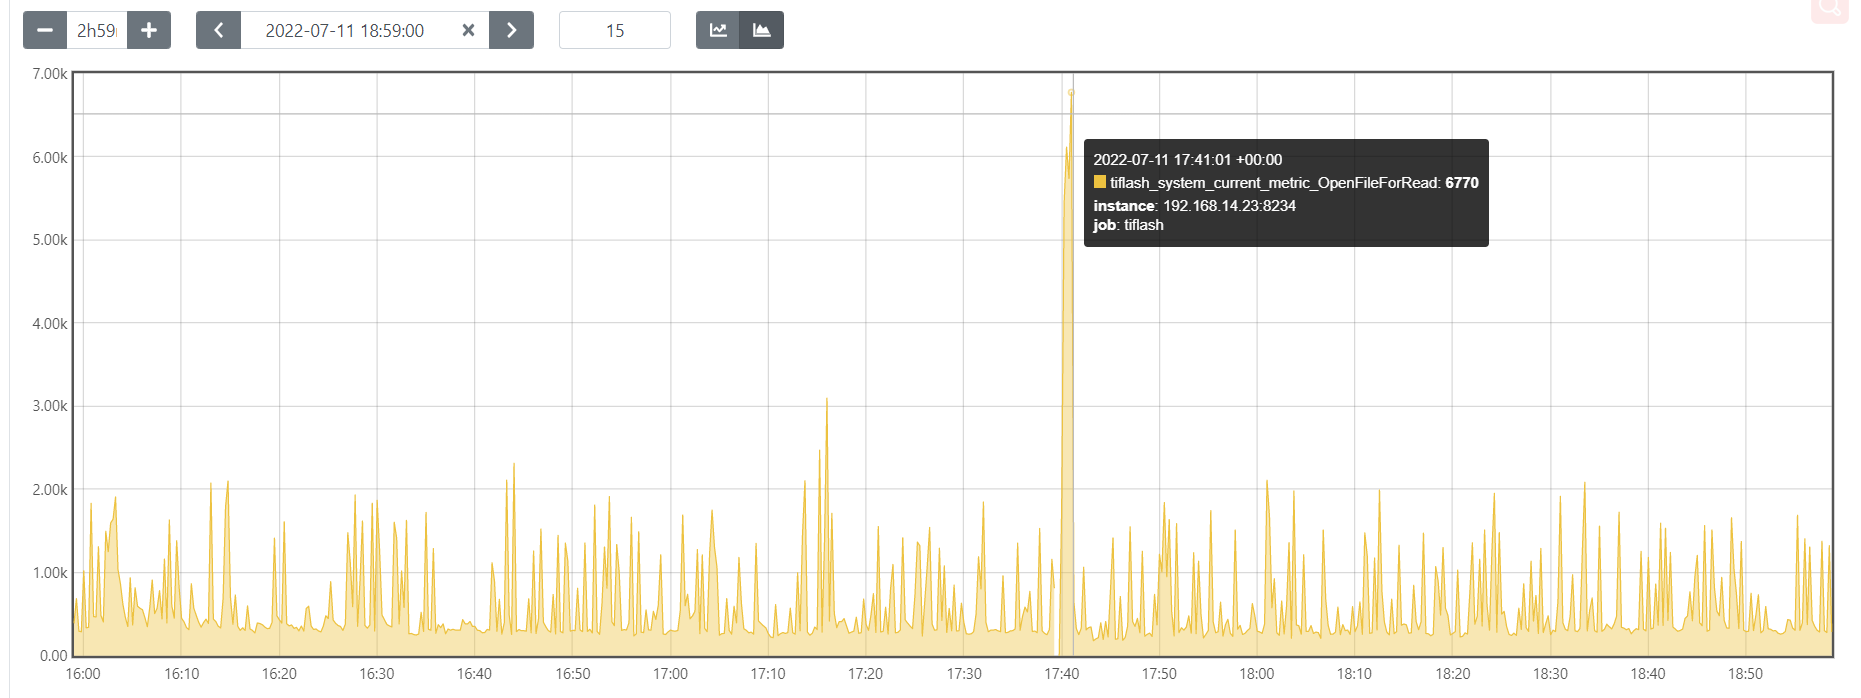
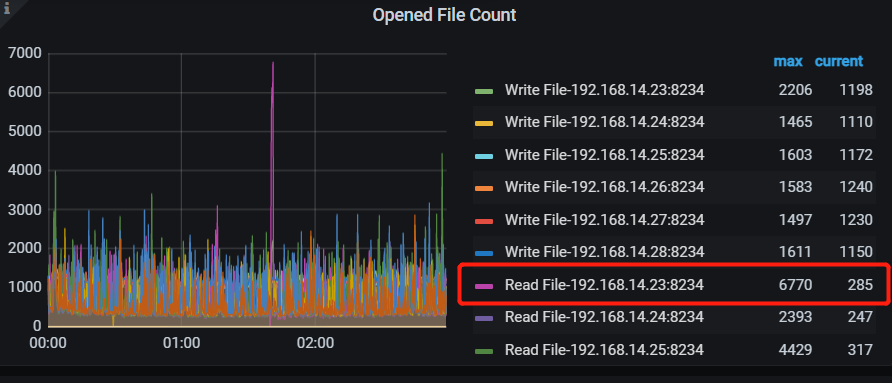
tiflash-summary :
tidb-cluster-node_exporter:
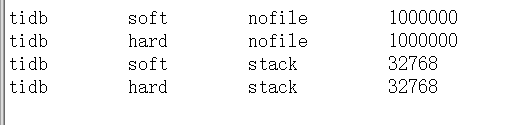
操作系统配置:
【 TiDB 使用环境`】生产环境
【 TiDB 版本】
6.1.0
【遇到的问题】
tiflash重启
【问题现象及影响】
tiflash_error.log:
操作系统配置:
系统的message里面有什么提示信息么?有没有oom-killer一类的提示?
不是oom造成的,message显示:main process exited, code=killed
根因排查:
至于规避,如果是这个根因,调成 unlimit 看能不能绕过?
1./var/log/messages 中,没有关于文件描述符的报错,只有这个:main process exited, code=killed, status=6/ABRT
2.操作系统资源已经做了配置,您看我写的操作系统配置的截图,配置是生效的,但 tiflash-summary 里的 Opened File Count 的最大值与操作系统配置值差距巨大,无法通过资源限制规避这个问题
目前的信息不容易往下分析…
麻烦确认下这是 tiflash 日志吗? 看着好像是 tikv 的日志。
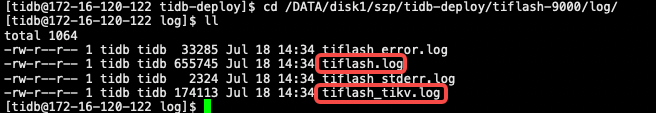
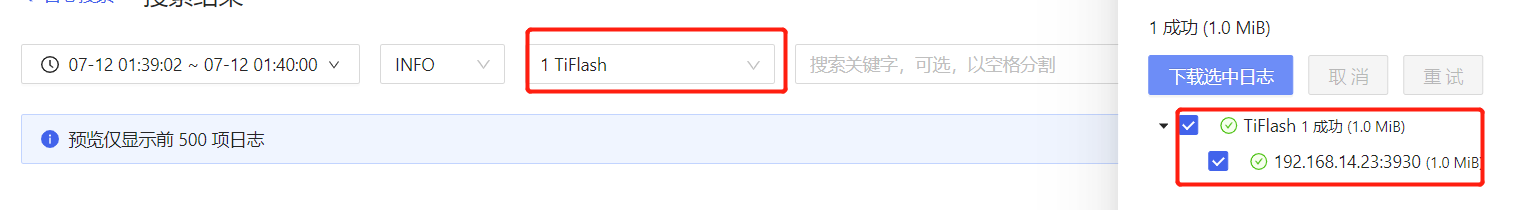
ng_monitor 导出的应该只是 tiflash_tikv.log,麻烦到该目录下把这 4 对应时间点的 log 全取出来。
是的,导出的是 tiflash_tikv.log , 当时的 tiflash.log 没有了
ok,没次重启都能成功,恢复正常?
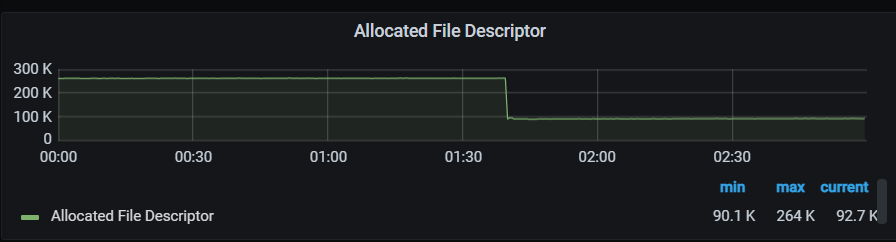
重启后句柄数都下去了,服务正常
ok,
可能是这个问题,还在确认中 --> https://github.com/pingcap/tiflash/issues/5292
1.操作系统版本:CentOS Linux release 7.9.2009 (Core)
2.持续性能分析是开启状态,没有手动 profiling
经判断基本跟这个 issue 相关 --> https://github.com/pingcap/tiflash/issues/5292
建议:
有任何新进展、现象也可以,贴到这里。感谢反馈
好的,感谢帮助~
此话题已在最后回复的 1 分钟后被自动关闭。不再允许新回复。