- 麻烦先反馈下store信息
- 检查下各个机器的防火墙策略,把端口都先放通。
- 如果是云主机,看看使用的是否是内部ip,如果是外部ip,安全组可能也要放开端口。
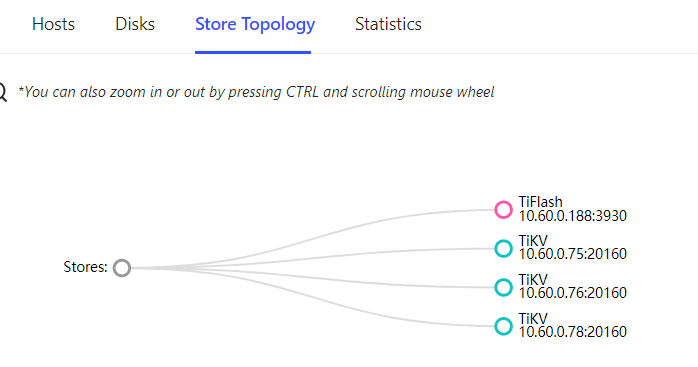
能不能看一下 pd-ctl 中 store 信息,完整的信息反馈下。
tiup ctl pd -u http://10.60.0.75:2379 store
Starting component ctl: /xdfapp/tidb/.tiup/components/ctl/v4.0.11/ctl pd -u http://10.60.0.75:2379 store
{
“count”: 4,
“stores”: [
{
“store”: {
“id”: 1,
“address”: “10.60.0.78:20160”,
“version”: “4.0.11”,
“status_address”: “10.60.0.78:20180”,
“git_hash”: “4ac5e7ea1839d63163e911e2e1164d663f49592b”,
“start_timestamp”: 1619696911,
“deploy_path”: “/xdfapp/tidb/tidb-deploy/tikv-20160/bin”,
“last_heartbeat”: 1621412507028457780,
“state_name”: “Up”
},
“status”: {
“capacity”: “95.54GiB”,
“available”: “45.68GiB”,
“used_size”: “73.8MiB”,
“leader_count”: 13,
“leader_weight”: 1,
“leader_score”: 13,
“leader_size”: 28,
“region_count”: 21,
“region_weight”: 1,
“region_score”: 36,
“region_size”: 36,
“start_ts”: “2021-04-29T19:48:31+08:00”,
“last_heartbeat_ts”: “2021-05-19T16:21:47.02845778+08:00”,
“uptime”: “476h33m16.02845778s”
}
},
{
“store”: {
“id”: 4,
“address”: “10.60.0.76:20160”,
“version”: “4.0.11”,
“status_address”: “10.60.0.76:20180”,
“git_hash”: “4ac5e7ea1839d63163e911e2e1164d663f49592b”,
“start_timestamp”: 1619696911,
“deploy_path”: “/xdfapp/tidb/tidb-deploy/tikv-20160/bin”,
“last_heartbeat”: 1621412506780597755,
“state_name”: “Up”
},
“status”: {
“capacity”: “95.54GiB”,
“available”: “70.96GiB”,
“used_size”: “74.19MiB”,
“leader_count”: 4,
“leader_weight”: 1,
“leader_score”: 4,
“leader_size”: 4,
“region_count”: 21,
“region_weight”: 1,
“region_score”: 36,
“region_size”: 36,
“start_ts”: “2021-04-29T19:48:31+08:00”,
“last_heartbeat_ts”: “2021-05-19T16:21:46.780597755+08:00”,
“uptime”: “476h33m15.780597755s”
}
},
{
“store”: {
“id”: 5,
“address”: “10.60.0.75:20160”,
“version”: “4.0.11”,
“status_address”: “10.60.0.75:20180”,
“git_hash”: “4ac5e7ea1839d63163e911e2e1164d663f49592b”,
“start_timestamp”: 1619696912,
“deploy_path”: “/xdfapp/tidb/tidb-deploy/tikv-20160/bin”,
“last_heartbeat”: 1621412503649446882,
“state_name”: “Up”
},
“status”: {
“capacity”: “95.54GiB”,
“available”: “63.75GiB”,
“used_size”: “73.72MiB”,
“leader_count”: 4,
“leader_weight”: 1,
“leader_score”: 4,
“leader_size”: 4,
“region_count”: 21,
“region_weight”: 1,
“region_score”: 36,
“region_size”: 36,
“start_ts”: “2021-04-29T19:48:32+08:00”,
“last_heartbeat_ts”: “2021-05-19T16:21:43.649446882+08:00”,
“uptime”: “476h33m11.649446882s”
}
},
{
“store”: {
“id”: 46,
“address”: “10.60.0.188:3930”,
“labels”: [
{
“key”: “engine”,
“value”: “tiflash”
}
],
“version”: “v4.0.11”,
“peer_address”: “10.60.0.188:20170”,
“status_address”: “10.60.0.188:20292”,
“git_hash”: “c17af8a365ca145c18ee0e38945a1f1956799acb”,
“start_timestamp”: 1619696919,
"deploy_path": “/xdfapp/tidb/tidb-deploy/tiflash-8001/bin/tiflash”,
“last_heartbeat”: 1621412501189641924,
“state_name”: “Up”
},
“status”: {
“capacity”: “492GiB”,
“available”: “492GiB”,
“used_size”: “10.93KiB”,
“leader_count”: 0,
“leader_weight”: 1,
“leader_score”: 0,
“leader_size”: 0,
“region_count”: 0,
“region_weight”: 1,
“region_score”: 0,
“region_size”: 0,
“start_ts”: “2021-04-29T19:48:39+08:00”,
“last_heartbeat_ts”: “2021-05-19T16:21:41.189641924+08:00”,
“uptime”: “476h33m2.189641924s”
}
}
]
}

这个默认没有配置
#MaxSessions 10
是要去掉注释,改成20吗?
改成30先试试看,记得重启service
修改完了,也重启了,还是报一样的
我去tiflash服务器看了一下tiflash的日志,包含让如下:
-
tiflash_error.log日志
-bash-4.2$ tail -100 tiflash_error.log
2021.04.29 19:48:39.110204 [ 1 ] Application: The configuration “path” is deprecated. Check [storage] section for new style.
2021.04.29 19:48:49.666621 [ 4 ] pingcap.tikv: region {6,1,2} find error: peer is not leader for region 6, leader may Some(id: 47 store_id: 4)
2021.05.14 16:12:35.348554 [ 23 ] ServerErrorHandler: Poco::Exception. Code: 1000, e.code() = 107, e.displayText() = Net Exception: Socket is not connected, e.what() = Net Exception -
tiflash.log日志
[2021/05/19 18:23:17.695 +08:00] [DEBUG] [] [“SchemaSyncService: Performing GC using safe point 425045287720714240”] [thread_id=11]
[2021/05/19 18:23:17.695 +08:00] [DEBUG] [] [“SchemaSyncService: Performed GC using safe point 425045287720714240”] [thread_id=11]
[2021/05/19 18:33:19.781 +08:00] [DEBUG] [] [“SchemaSyncService: Performing GC using safe point 425045445007114240”] [thread_id=17]
[2021/05/19 18:33:19.781 +08:00] [DEBUG] [] [“SchemaSyncService: Performed GC using safe point 425045445007114240”] [thread_id=17]
[2021/05/19 18:43:19.099 +08:00] [DEBUG] [] [“SchemaSyncService: Performing GC using safe point 425045602293514240”] [thread_id=12]
[2021/05/19 18:43:19.100 +08:00] [DEBUG] [] [“SchemaSyncService: Performed GC using safe point 425045602293514240”] [thread_id=12]
[2021/05/19 18:44:45.799 +08:00] [DEBUG] [] [“grpc: /tmp/tzg/release-centos7/prepare-environments/grpc/src/core/lib/iomgr/tcp_posix.cc, line number : 1261, log msg : cannot set inq fd=20 errno=92”] [thread_id=14]
[2021/05/19 18:44:47.325 +08:00] [DEBUG] [] [“grpc: /tmp/tzg/release-centos7/prepare-environments/grpc/src/core/lib/iomgr/tcp_posix.cc, line number : 1261, log msg : cannot set inq fd=20 errno=92”] [thread_id=6] -
tiflash_cluster_manager.log日志正常
2021-05-19 17:48:45,234 TiFlashManager: all replicas are available at global schema version 22
2021-05-19 17:53:45,214 TiFlashManager: all replicas are available at global schema version 22
2021-05-19 17:58:45,211 TiFlashManager: all replicas are available at global schema version 22
2021-05-19 18:03:45,223 TiFlashManager: all replicas are available at global schema version 22
2021-05-19 18:08:45,242 TiFlashManager: all replicas are available at global schema version 22
2021-05-19 18:13:45,226 TiFlashManager: all replicas are available at global schema version 22
2021-05-19 18:18:45,224 TiFlashManager: all replicas are available at global schema version 22
2021-05-19 18:23:45,217 TiFlashManager: all replicas are available at global schema version 22
2021-05-19 18:28:45,222 TiFlashManager: all replicas are available at global schema version 22
2021-05-19 18:33:45,219 TiFlashManager: all replicas are available at global schema version 22
2021-05-19 18:38:45,231 TiFlashManager: all replicas are available at global schema version 22
2021-05-19 18:43:45,210 TiFlashManager: all replicas are available at global schema version 22
2021-05-19 18:48:45,204 TiFlashManager: all replicas are available at global schema version 22
都是这样的
其它的就没发现报错了
好的,在分析了,有进展会同步
Hi @Johnpan 非常抱歉,之前一直在处理其它 issue。
你这个问题和 tiflash的磁盘信息在dashboard不显示 - #48,来自 yilong 这个案例有点类似。
能麻烦帮忙确认以下事情吗?
-
在 “Disks” tab 下该主机的磁盘信息是否显示正确?
-
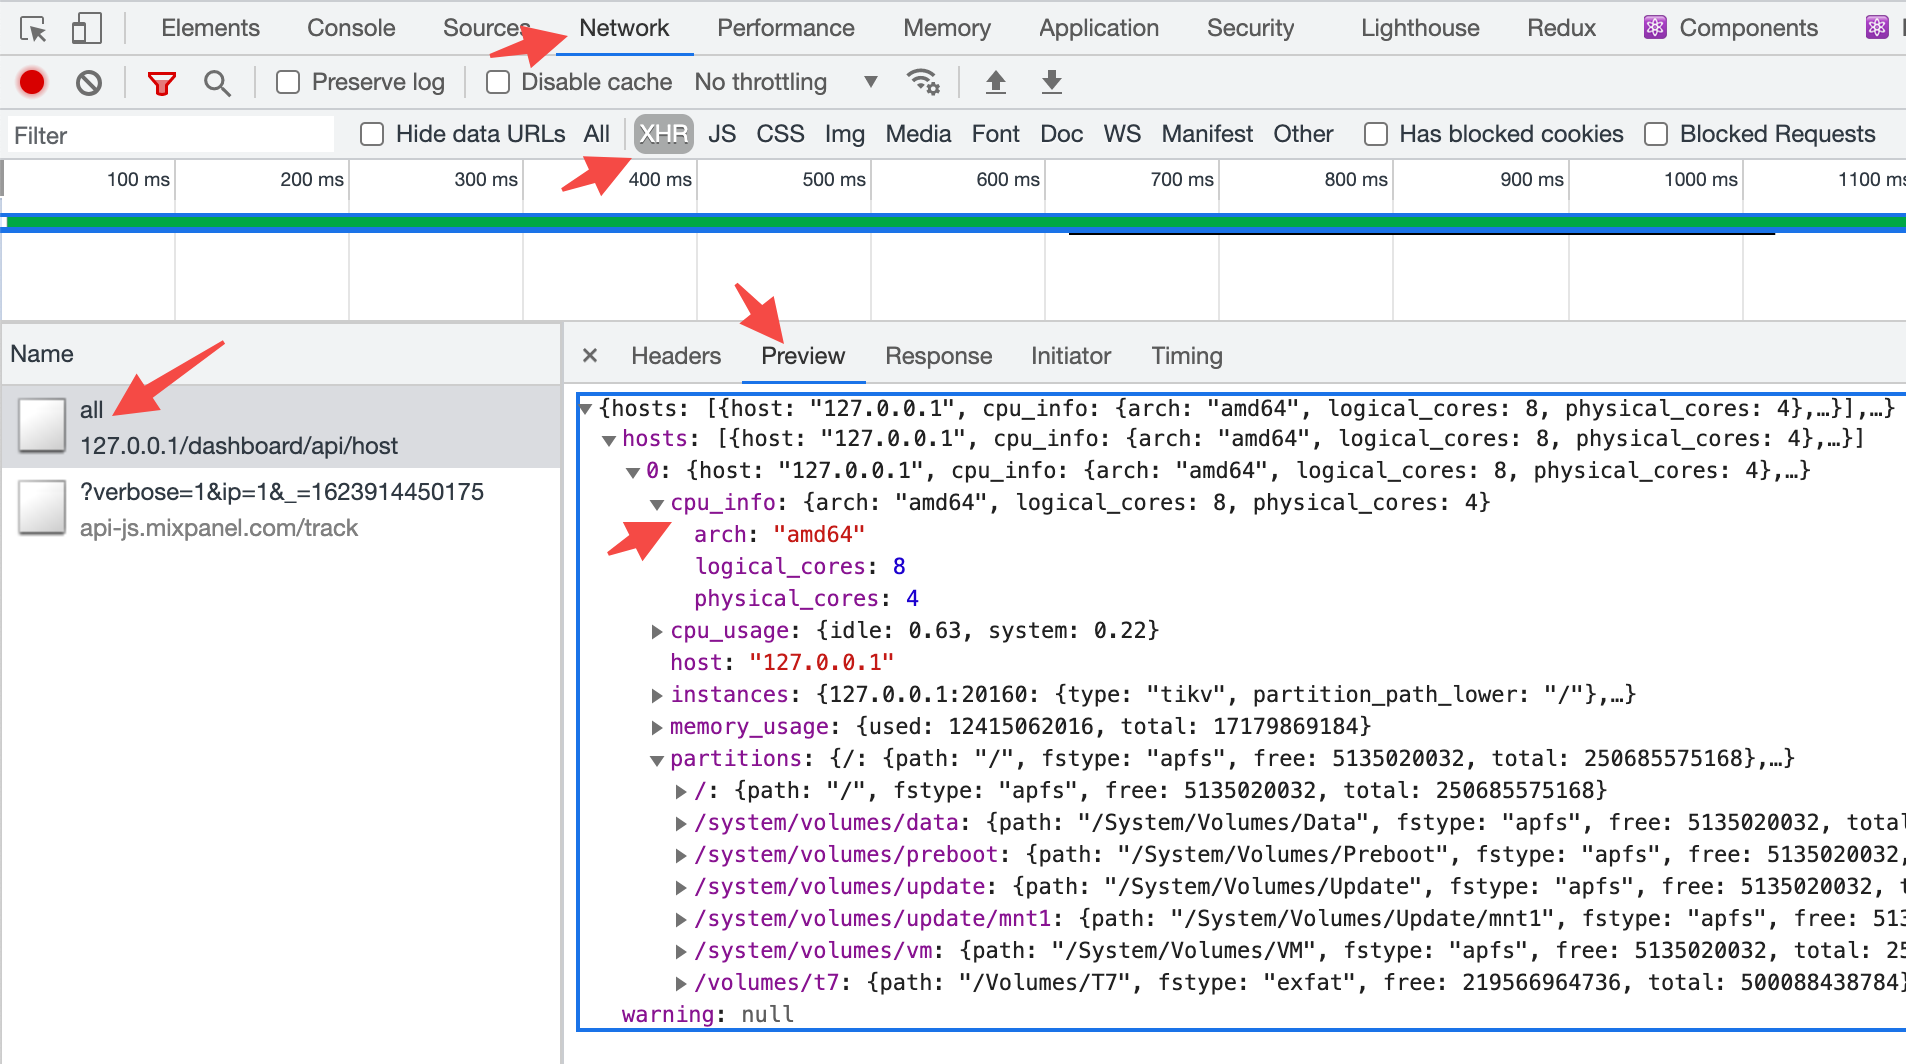
在 “Hosts” tab 下,点击鼠标右键,选择菜单中的 “Inspect”,打开浏览器的控制台,切到换 “Network” tab,选择 /all 请求,查看它的返回详情,重点看 cup_info 字段。
-
用 MySQL client 连接数据库,执行以下两条 SQL 语句看结果里是否有 DEVICE_TYPE 和 DEVICE_NAME 为 cpu 的行记录 (注意将下面命令中的中文引号改成英文引号)。
select * from INFORMATION_SCHEMA.CLUSTER_LOAD where TYPE=‘tiflash’;
select * from INFORMATION_SCHEMA.CLUSTER_HARDWARE where TYPE=‘tiflash’; -
机器环境信息是怎么样的,比如操作系统,部署目录,lsblk,以及是不是云环境。
谢谢!