为提高效率,请提供以下信息,问题描述清晰能够更快得到解决:
【TiDB 版本】
4.0.11
【问题描述】
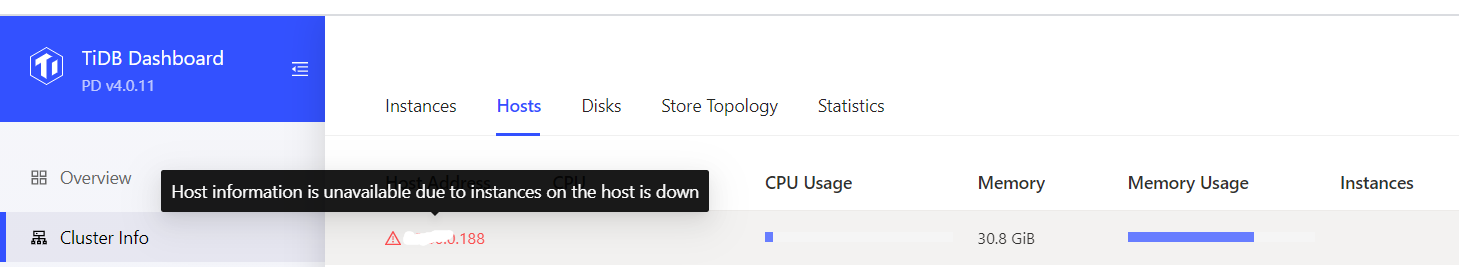
新部署的集群,包含TiFlash,还没开始使用,在PD web上看Cluster Info集群信息中的host项中TiFlash所在主机是标红的告警,“host information is unavailable due to instances on the host is down”,用tidb cluster display看tiflash是up状态的
为提高效率,请提供以下信息,问题描述清晰能够更快得到解决:
【TiDB 版本】
4.0.11
【问题描述】
新部署的集群,包含TiFlash,还没开始使用,在PD web上看Cluster Info集群信息中的host项中TiFlash所在主机是标红的告警,“host information is unavailable due to instances on the host is down”,用tidb cluster display看tiflash是up状态的
1.可以在 tiflash 所在的主机上核实下进程是否存活,以及 tiflash 日志中有无报错信息;
2.如果上面一步检查都没有问题的话,麻烦再检查下 tiflash 和 pd 节点间的 ntp 同步是否正常,如果时间相差较大的话也可能会出现这个问题。
您好,谢谢回复
麻烦检查下 pd 和 tiflash 主机之间是否设置了防火墙或者 SELinux ,检测下端口连通性是否有问题
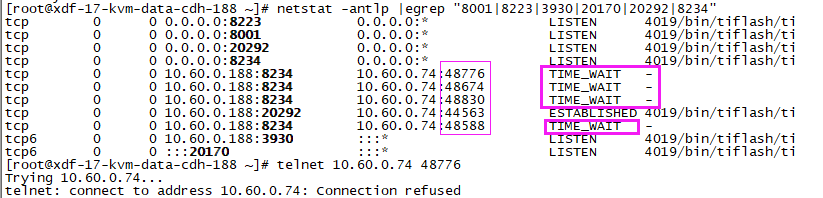
检查了,防火墙和selinux都关着的,pd到tiflash节点的网络都OK,telnet没问题
tiflash的网络端口我设置的是8000/8223/3930/20170/20292/8234,telnet都OK的
我是用TiUP离线安装的集群,只在topology.yaml上配置了tiflash的信息,然后启动,是不是还要配置啥呢
下面是我的配置文件中tiflash的配置:
tiflash:
profiles.default.max_memory_usage: 0
profiles.default.max_memory_usage_for_all_queries: 0
tiflash_servers:
麻烦检查下有无设置参数 replication.enable-placement-rules ,可以参考官方文档检查下:
https://docs.pingcap.com/zh/tidb/stable/tiflash-deployment-topology
设置了的,就是按照官网的模板配置的,下面是我的前面的部分配置:
global:
user: “tidb”
ssh_port: 22
deploy_dir: “/xdfapp/tidb/tidb-deploy”
data_dir: “/xdfapp/tidb/tidb-data”
monitored:
node_exporter_port: 8100
blackbox_exporter_port: 9115
server_configs:
tidb:
log.slow-threshold: 300
tikv:
readpool.storage.use-unified-pool: false
readpool.coprocessor.use-unified-pool: true
pd:
schedule.leader-schedule-limit: 4
schedule.region-schedule-limit: 2048
schedule.replica-schedule-limit: 64
replication.enable-placement-rules: true
tiflash:
profiles.default.max_memory_usage: 0
profiles.default.max_memory_usage_for_all_queries: 0
我找到tiflash的日志了,具体有下面一个告警和错误,似乎是tiflash的存储路径设置不支持?
我的设置是:
tiflash_servers:
下面是日志信息:
tiflash_error.log日志
Application: The configuration “path” is deprecated. Check [storage] section for new style.
tiflash.log日志
[ERROR] [] [“ServerErrorHandler: Code: 101, e.displayText() = DB::NetException: Unexpected packet from client, e.what() = DB::NetException, Stack trace:\
\
0. bin/tiflash/tiflash(StackTrace::St
ackTrace()+0x15) [0x35a7aa5]\
1. bin/tiflash/tiflash(DB::Exception::Exception(std::__cxx11::basic_string<char, std::char_traits, std::allocator > const&, int)+0x25) [0x359e635]\
2. bin/tiflash/tiflash(DB::TCPHandler::receiv
eHello()+0xc5) [0x35e8475]\
3. bin/tiflash/tiflash(DB::TCPHandler::runImpl()+0x1a8) [0x35eac88]\
4. bin/tiflash/tiflash(DB::TCPHandler::run()+0x1b) [0x35ec67b]\
5. bin/tiflash/tiflash(Poco::Net::TCPServerConnection::start()+0xe) [0x7ae
9f9e]\
6. bin/tiflash/tiflash(Poco::Net::TCPServerDispatcher::run()+0x165) [0x7aea365]\
7. bin/tiflash/tiflash(Poco::PooledThread::run()+0x76) [0x7c42b56]\
8. bin/tiflash/tiflash(Poco::ThreadImpl::runnableEntry(void*)+0x37) [0x7c3ea07]
\
9. bin/tiflash/tiflash() [0x8477b1e]\
10. /lib64/libpthread.so.0(+0x7ea4) [0x7f7795c22ea4]\
11. /lib64/libc.so.6(clone+0x6c) [0x7f77956498dc]\
”] [thread_id=23]
麻烦把 tiflash 的几个完整日志都提供下吧
tiflash.log (337.8 KB) tiflash_cluster_manager.log (27.5 KB) tiflash_error.log (2.3 KB) tiflash_tikv.log (139.2 KB)
1.从当前日志看进程是正常存活的,你可以先同步一张表测试下,看下 tiflash 是否可以正常同步数据;
2.上面 dashboard 中 hosts 中除了 tiflash 外其他 tikv 节点都是正常的吗?如果是的话可以对比下主机上配置有何不同。
1.查看表数据是否同步到 tiflash 及同步完成情况,可以参考下:
https://docs.pingcap.com/zh/tidb/stable/use-tiflash#查看表同步进度
2.可以通过 pd-ctl 查看下 store 信息,看下 tiflash 节点状态。
嗯,我看了,用法是tiup ctl {tidb/pd/tikv/binlog/etcd} [flags]
没有看tiflash的,而且我tiup cluster display 查看集群状态,tiflash是正常的
在 pd ctl 中可以查看 store 信息,会展示 tiflash