为提高效率,请提供以下信息,问题描述清晰能够更快得到解决:
【TiDB 版本】
v4.10
【问题描述】
子查询索引不工作,走了全表扫描
有两张表,
任务表:
create  table task(
    id bigint primary key not null ,
    name varchar(255)
);

INSERT INTO task (id, name) VALUES (1, '1');
INSERT INTO task (id, name) VALUES (2, '2');
INSERT INTO task (id, name) VALUES (3, '3');
任务参与者:
create  table task_participant(
    id bigint primary key not null ,
    task_id bigint not null,
    user_id bigint not null,
    name varchar(255) not null
);
INSERT INTO task_participant (id, task_id, user_id, name) VALUES (1, 2, 1, '张三');
INSERT INTO task_participant (id, task_id, user_id, name) VALUES (2, 2, 2, '李四');
INSERT INTO task_participant (id, task_id, user_id, name) VALUES (3, 1, 2, '李四');
其中task_id对应task表的id,在task_id上建立索引
create index IDX_TASK_ID_TASK_PARTICIPANT on task_participant(task_id);
原系统中有类似sql,执行时发现很慢
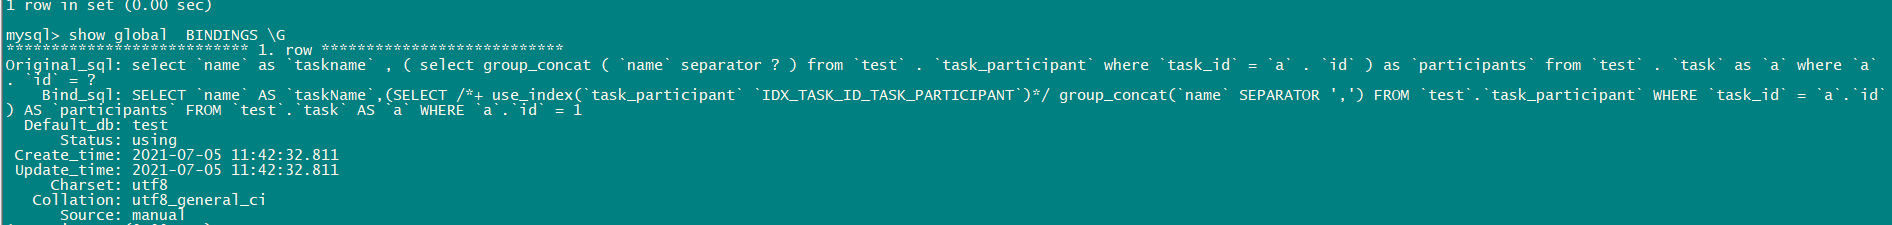
select name as taskName, (select group_concat(name) from task_participant where task_id = a.id) as participants from task a where a.id=1;
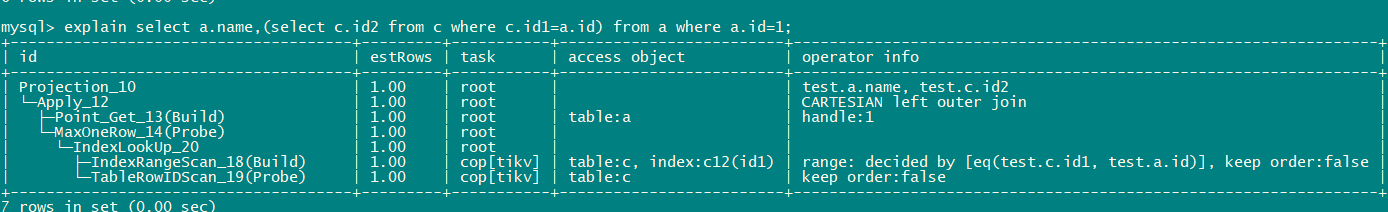
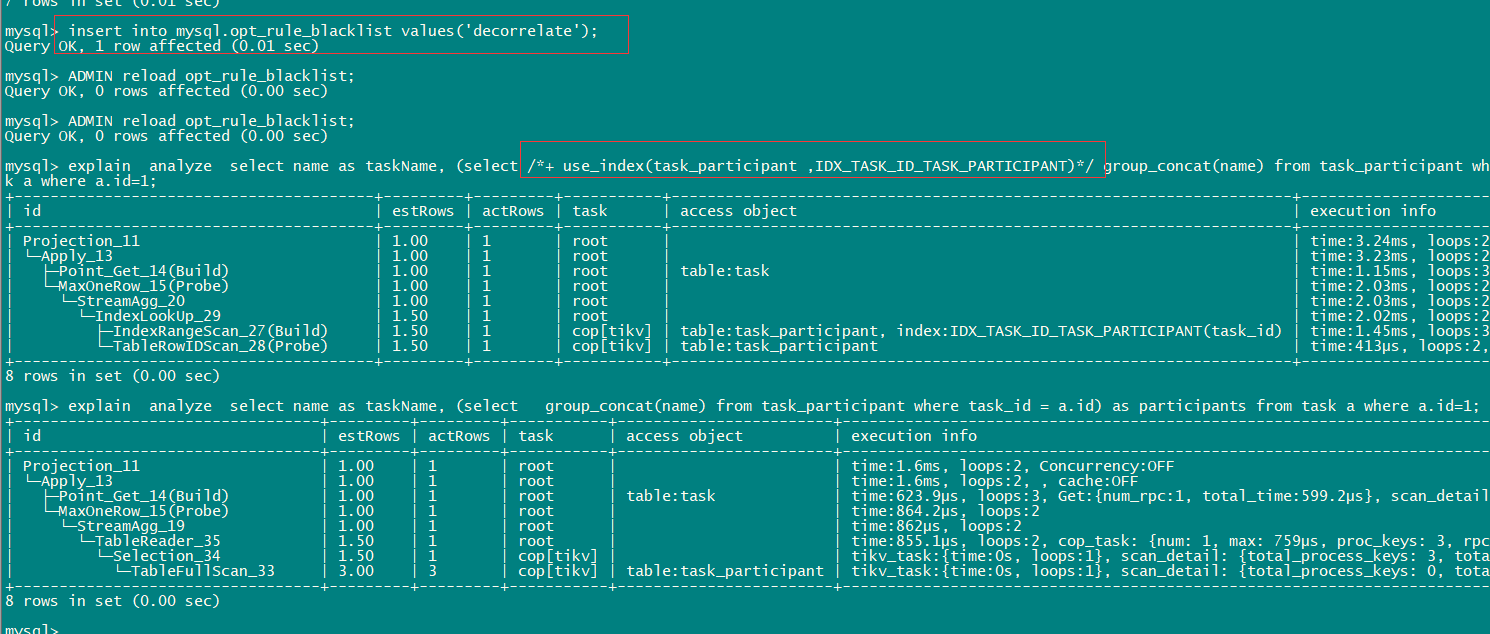
查看执行计划
explain analyze select name as taskName, (select group_concat(name) from task_participant where task_id = a.id) as participants from task a where a.id=1;
id estRows actRows task access object execution info operator info memory disk
HashJoin_13 1.00 1 root "" time:1.13667ms, loops:2, build_hash_table:{total:892.342µs, fetch:885.217µs, build:7.125µs}, probe:{concurrency:5, total:5.099145ms, max:1.055399ms, probe:7.865µs, fetch:5.09128ms} left outer join, equal:[eq(exam.task.id, exam.task_participant.task_id)] 8.26953125 KB 0 Bytes
├─Point_Get_21(Build) 1.00 1 root table:task time:789.893µs, loops:2, Get:{num_rpc:1, total_time:749.872µs} handle:1 N/A N/A
└─HashAgg_22(Probe) 2.40 2 root "" time:1.034225ms, loops:3, PartialConcurrency:4, FinalConcurrency:4 "group by:exam.task_participant.task_id, funcs:group_concat(exam.task_participant.name separator "","")->Column#7, funcs:firstrow(exam.task_participant.task_id)->exam.task_participant.task_id" 6.78125 KB N/A
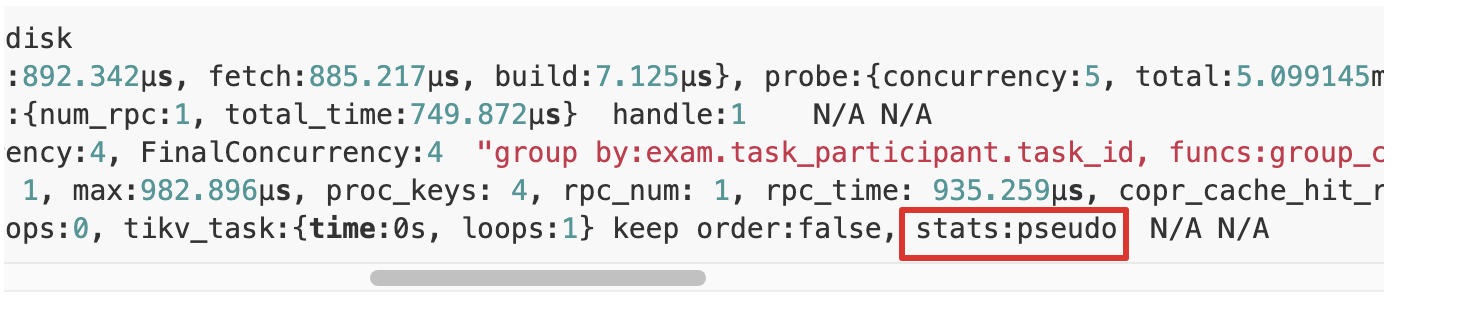
└─TableReader_28 3.00 3 root "" time:866.684µs, loops:2, cop_task: {num: 1, max:982.896µs, proc_keys: 4, rpc_num: 1, rpc_time: 935.259µs, copr_cache_hit_ratio: 0.00} data:TableFullScan_27 262 Bytes N/A
└─TableFullScan_27 3.00 3 cop[tikv] table:task_participant time:0ns, loops:0, tikv_task:{time:0s, loops:1} keep order:false, stats:pseudo N/A N/A
发现表task_participant没有使用task_id上的索引,走了全表扫描
若提问为性能优化、故障排查类问题,请下载脚本运行。终端输出的打印结果,请务必全选并复制粘贴上传。