为提高效率,提问时请提供以下信息,问题描述清晰可优先响应。
- 【TiDB 版本】:4.0.4
- 【问题描述】:
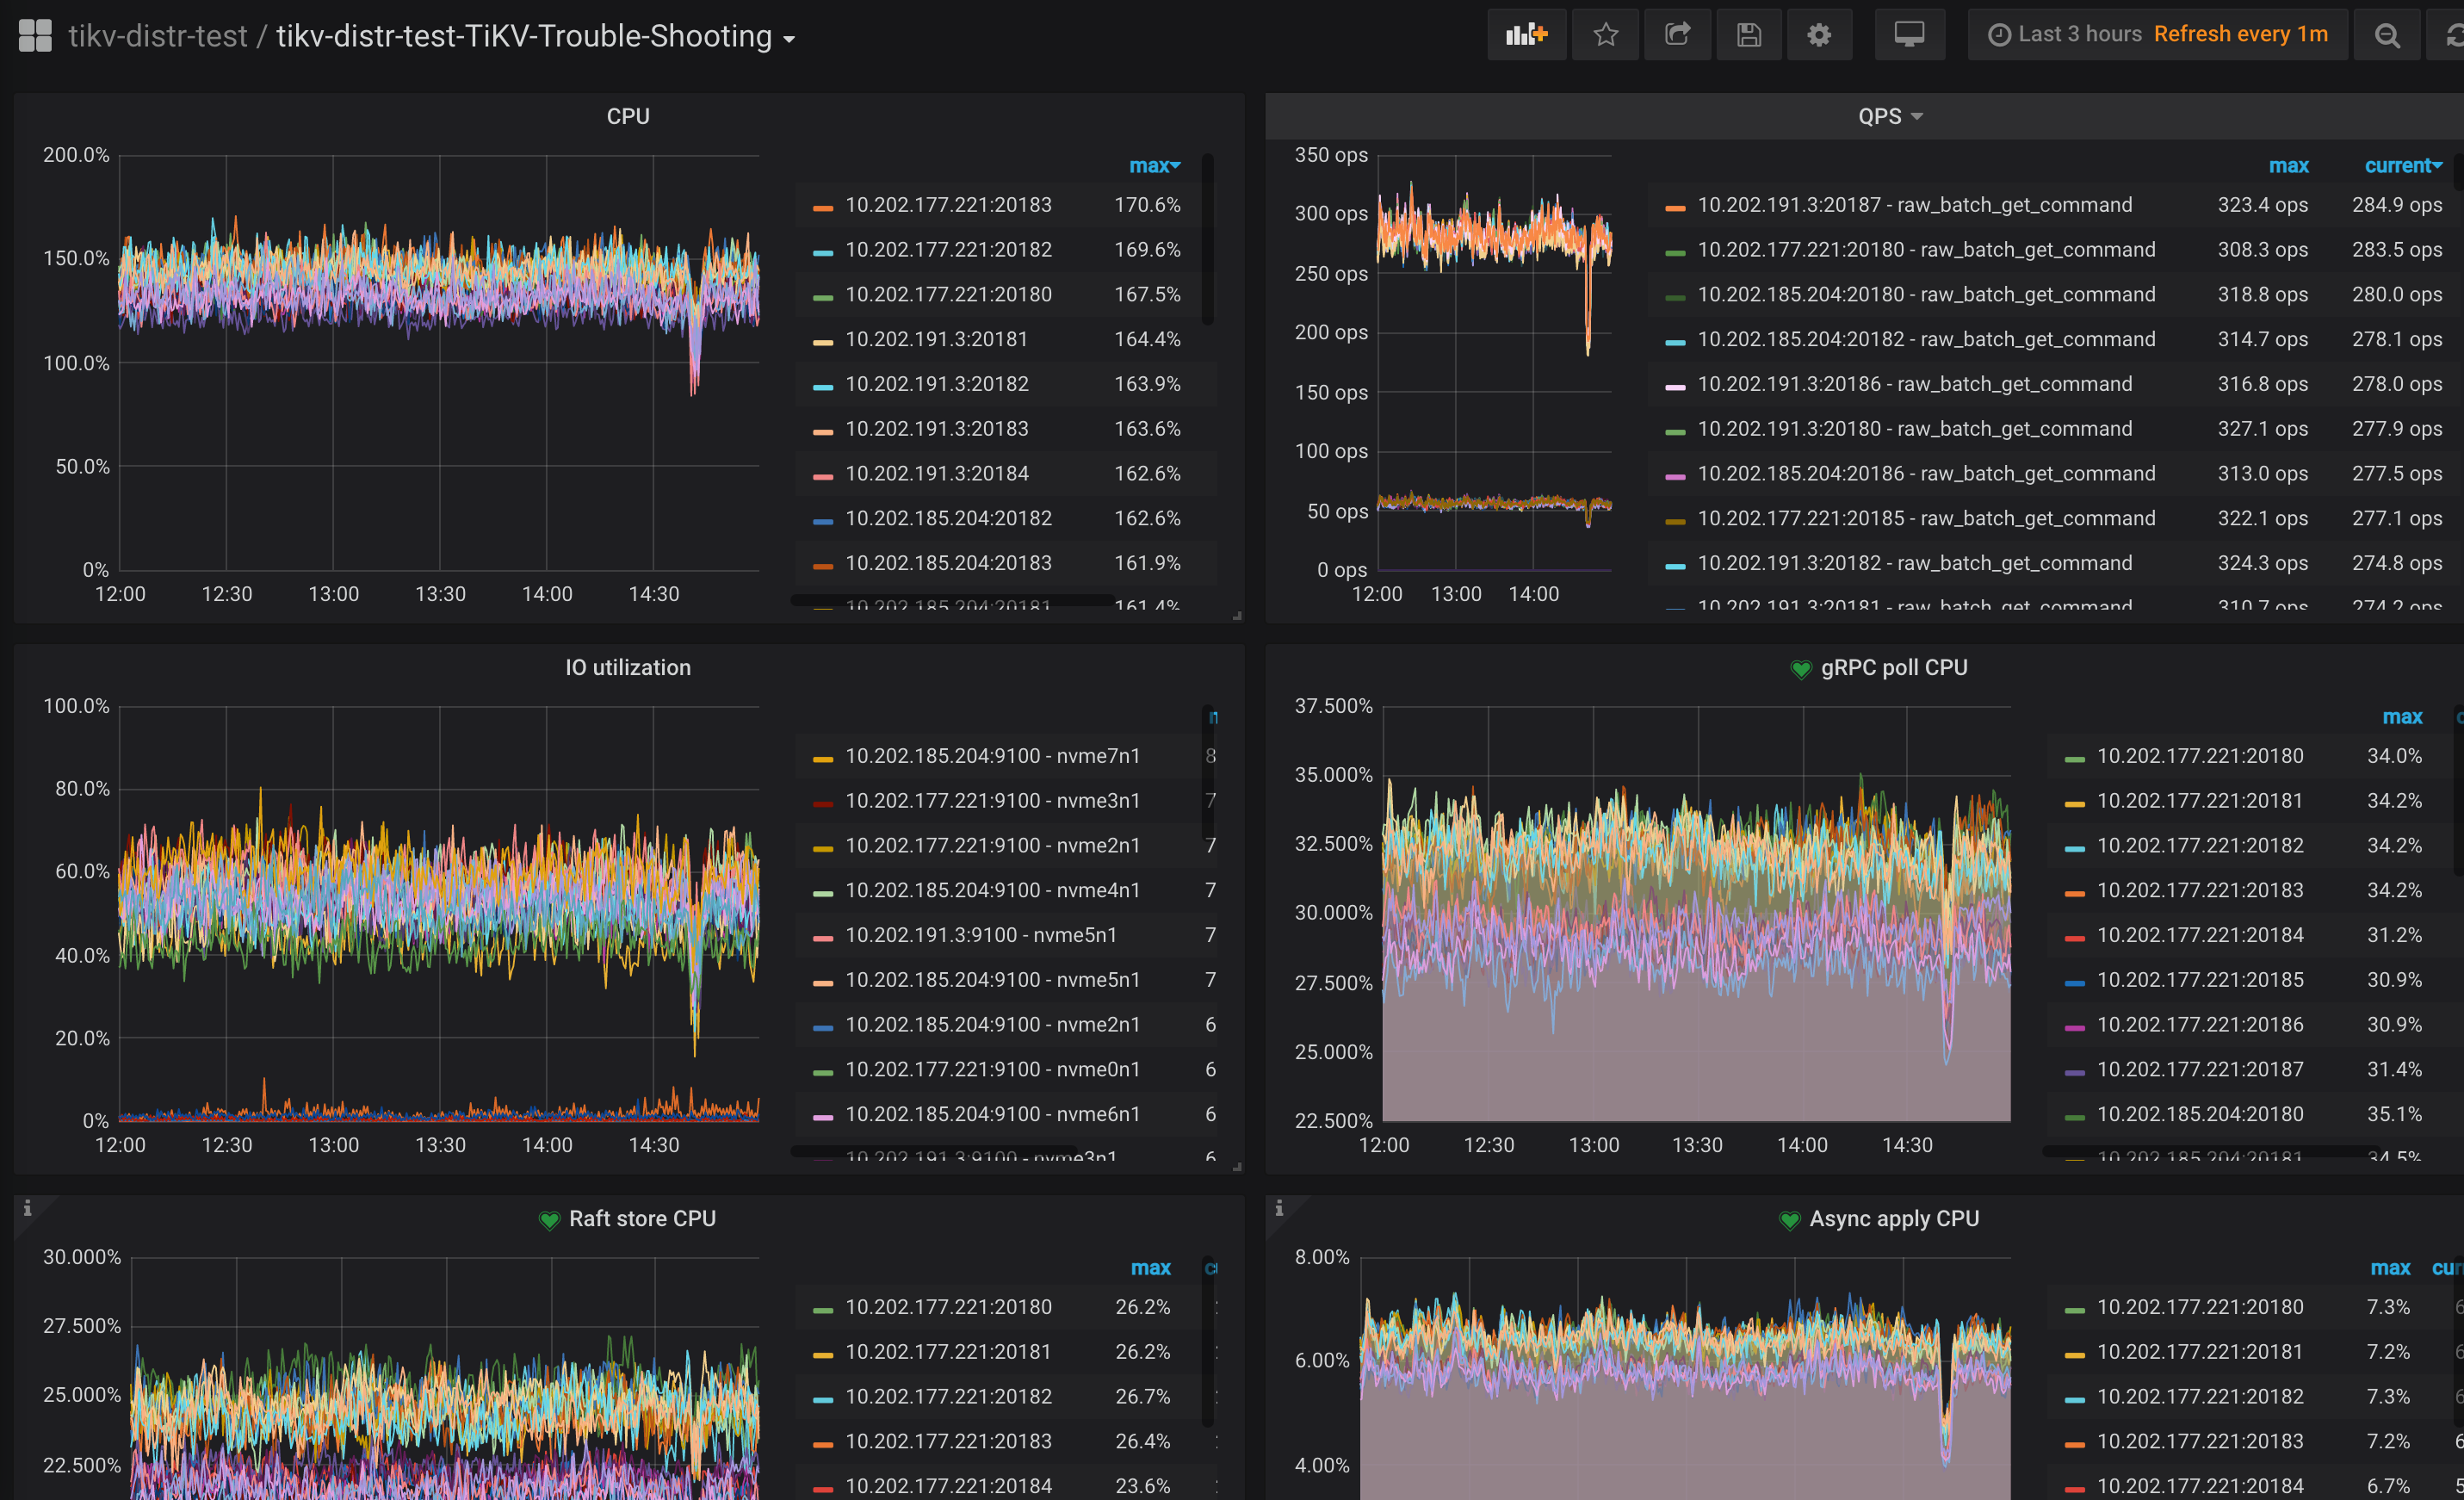
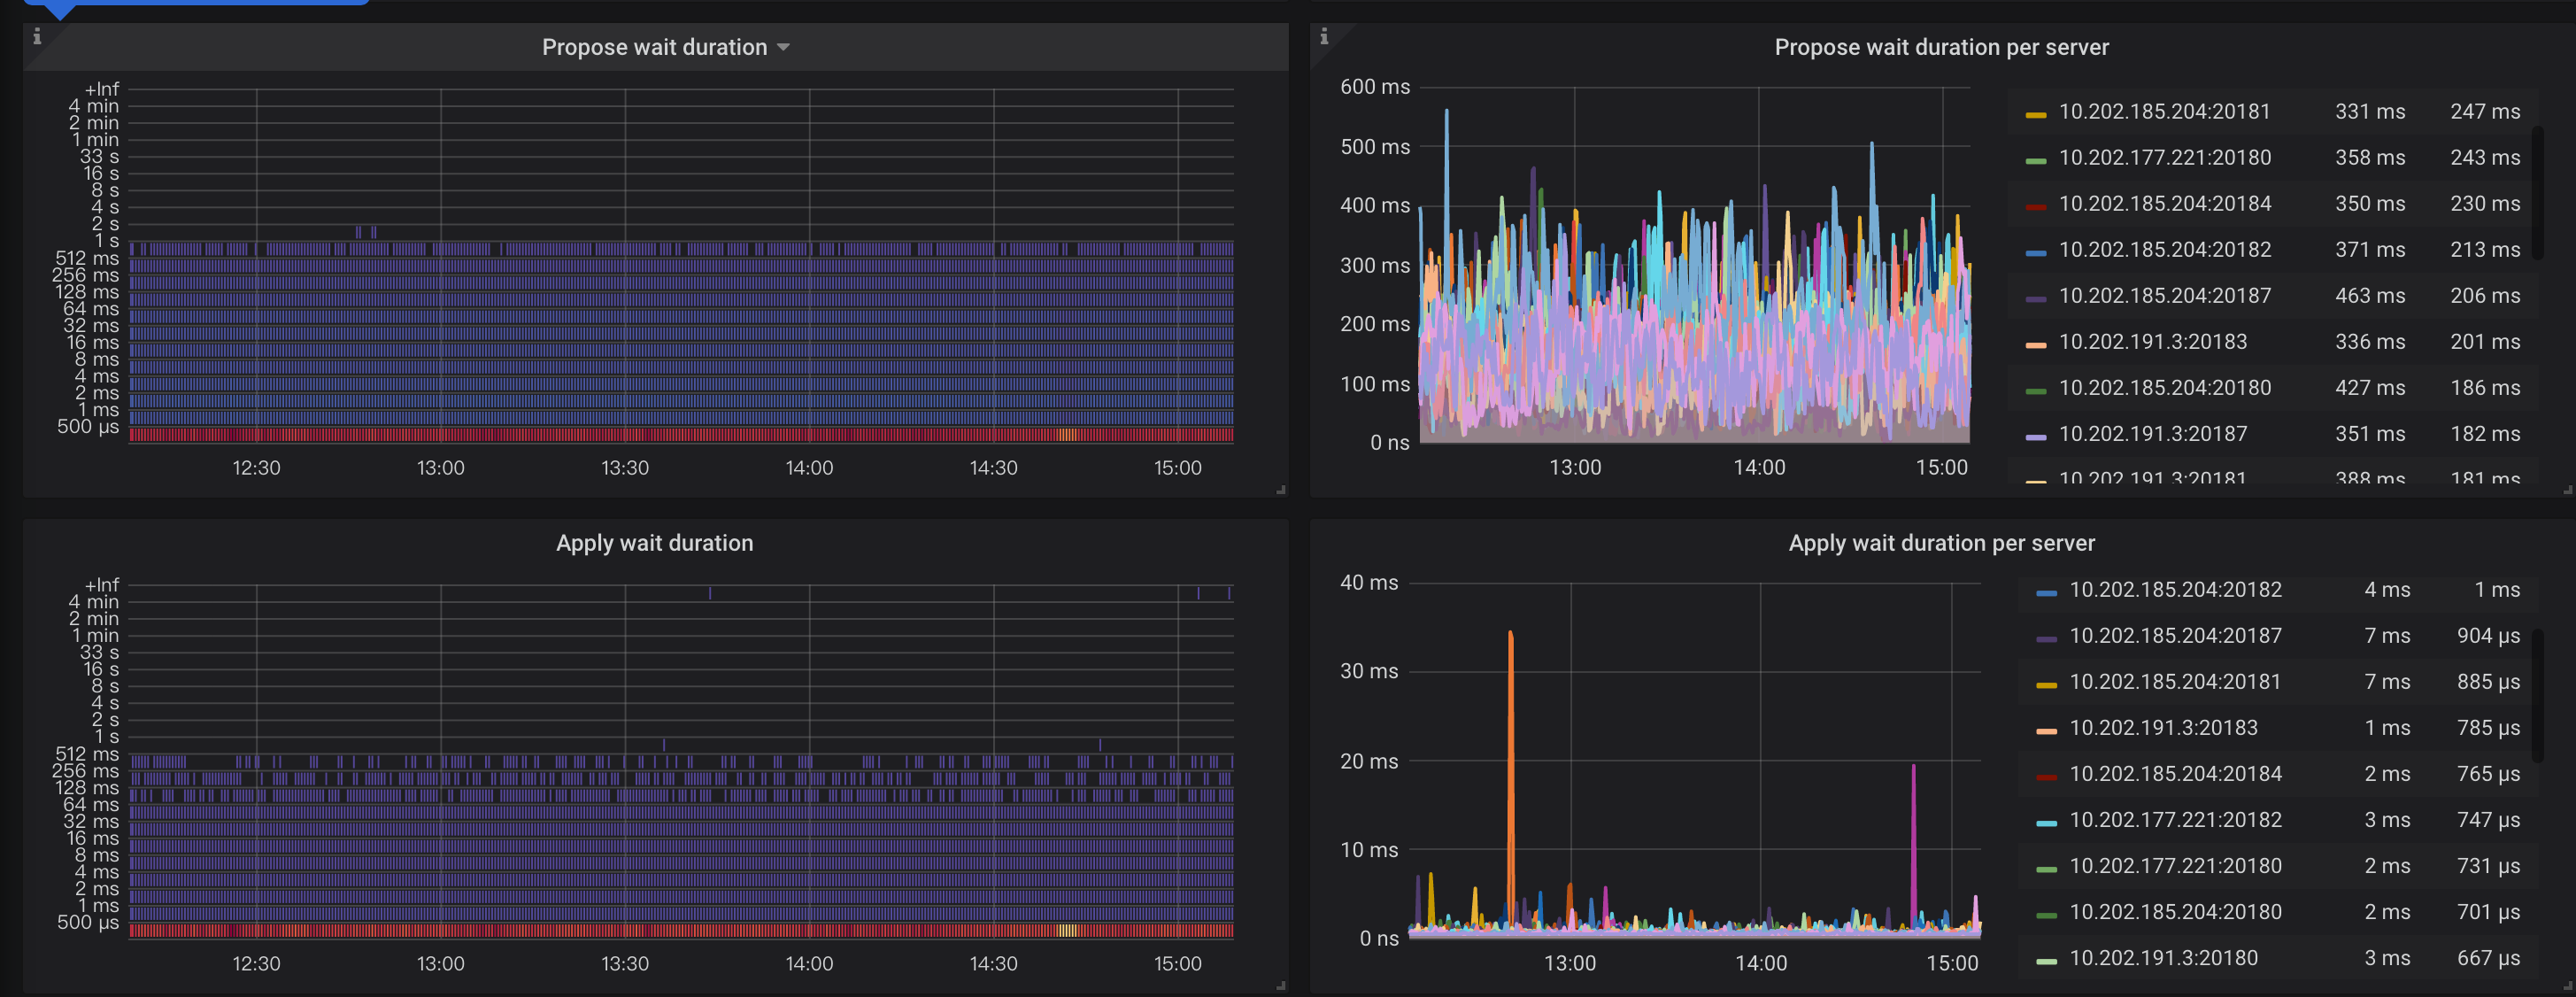
我们部署了一个 tikv + pd 的cluster 用来测试,在目前的 load 下 我们发现 write grpc p99 比较高(~200ms)
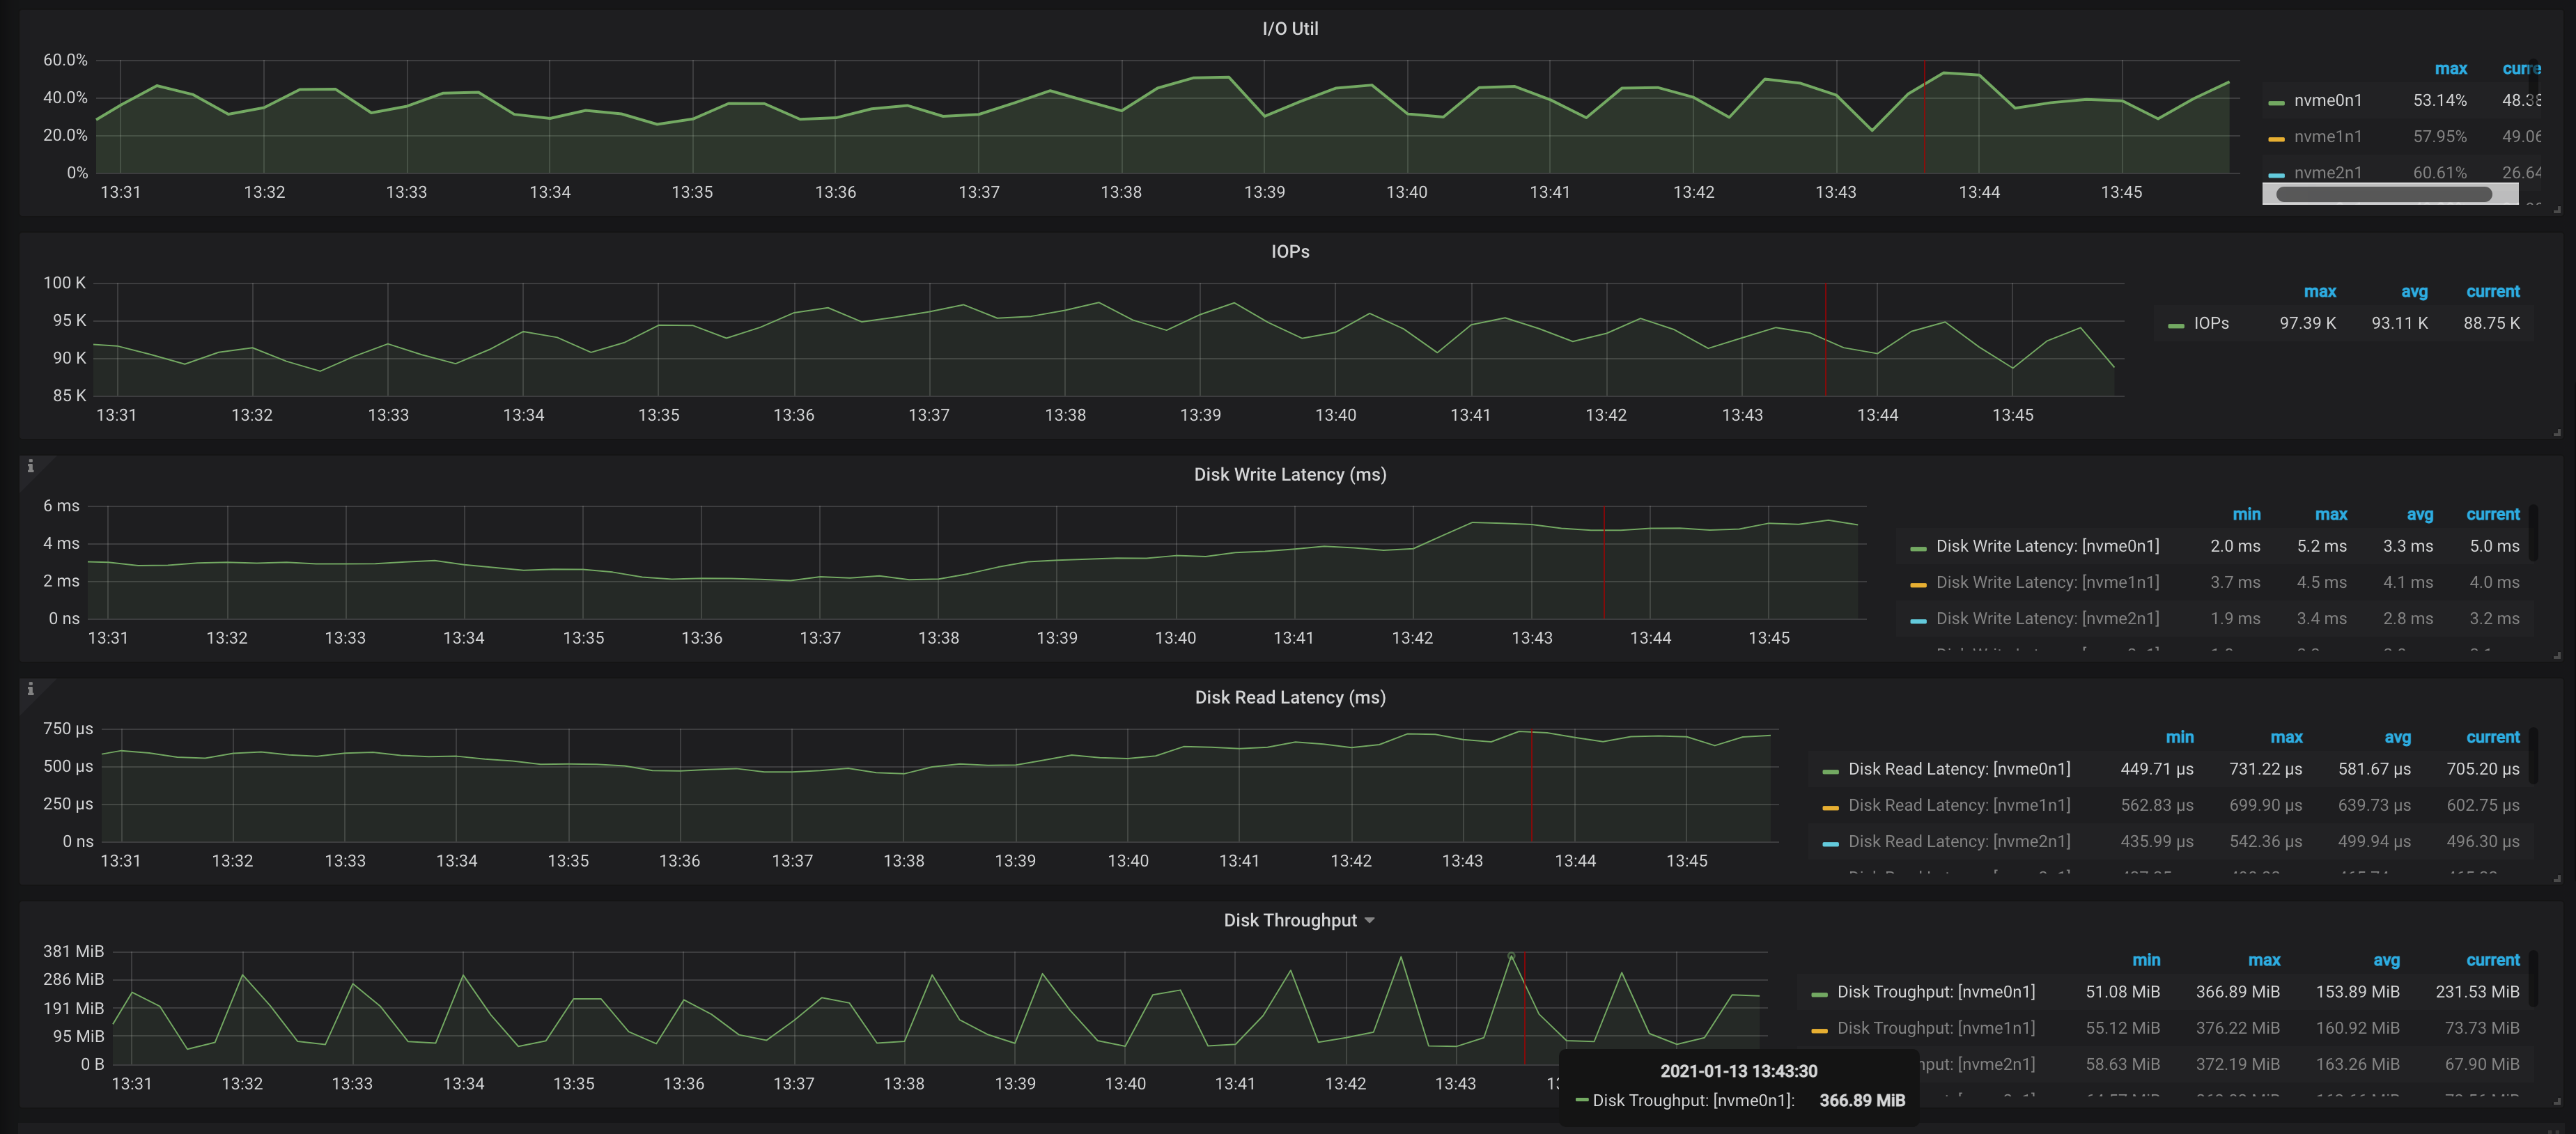
我想咨询一下下面这个图的情况 disk 是瓶颈吗
为提高效率,提问时请提供以下信息,问题描述清晰可优先响应。
我们部署了一个 tikv + pd 的cluster 用来测试,在目前的 load 下 我们发现 write grpc p99 比较高(~200ms)
我想咨询一下下面这个图的情况 disk 是瓶颈吗
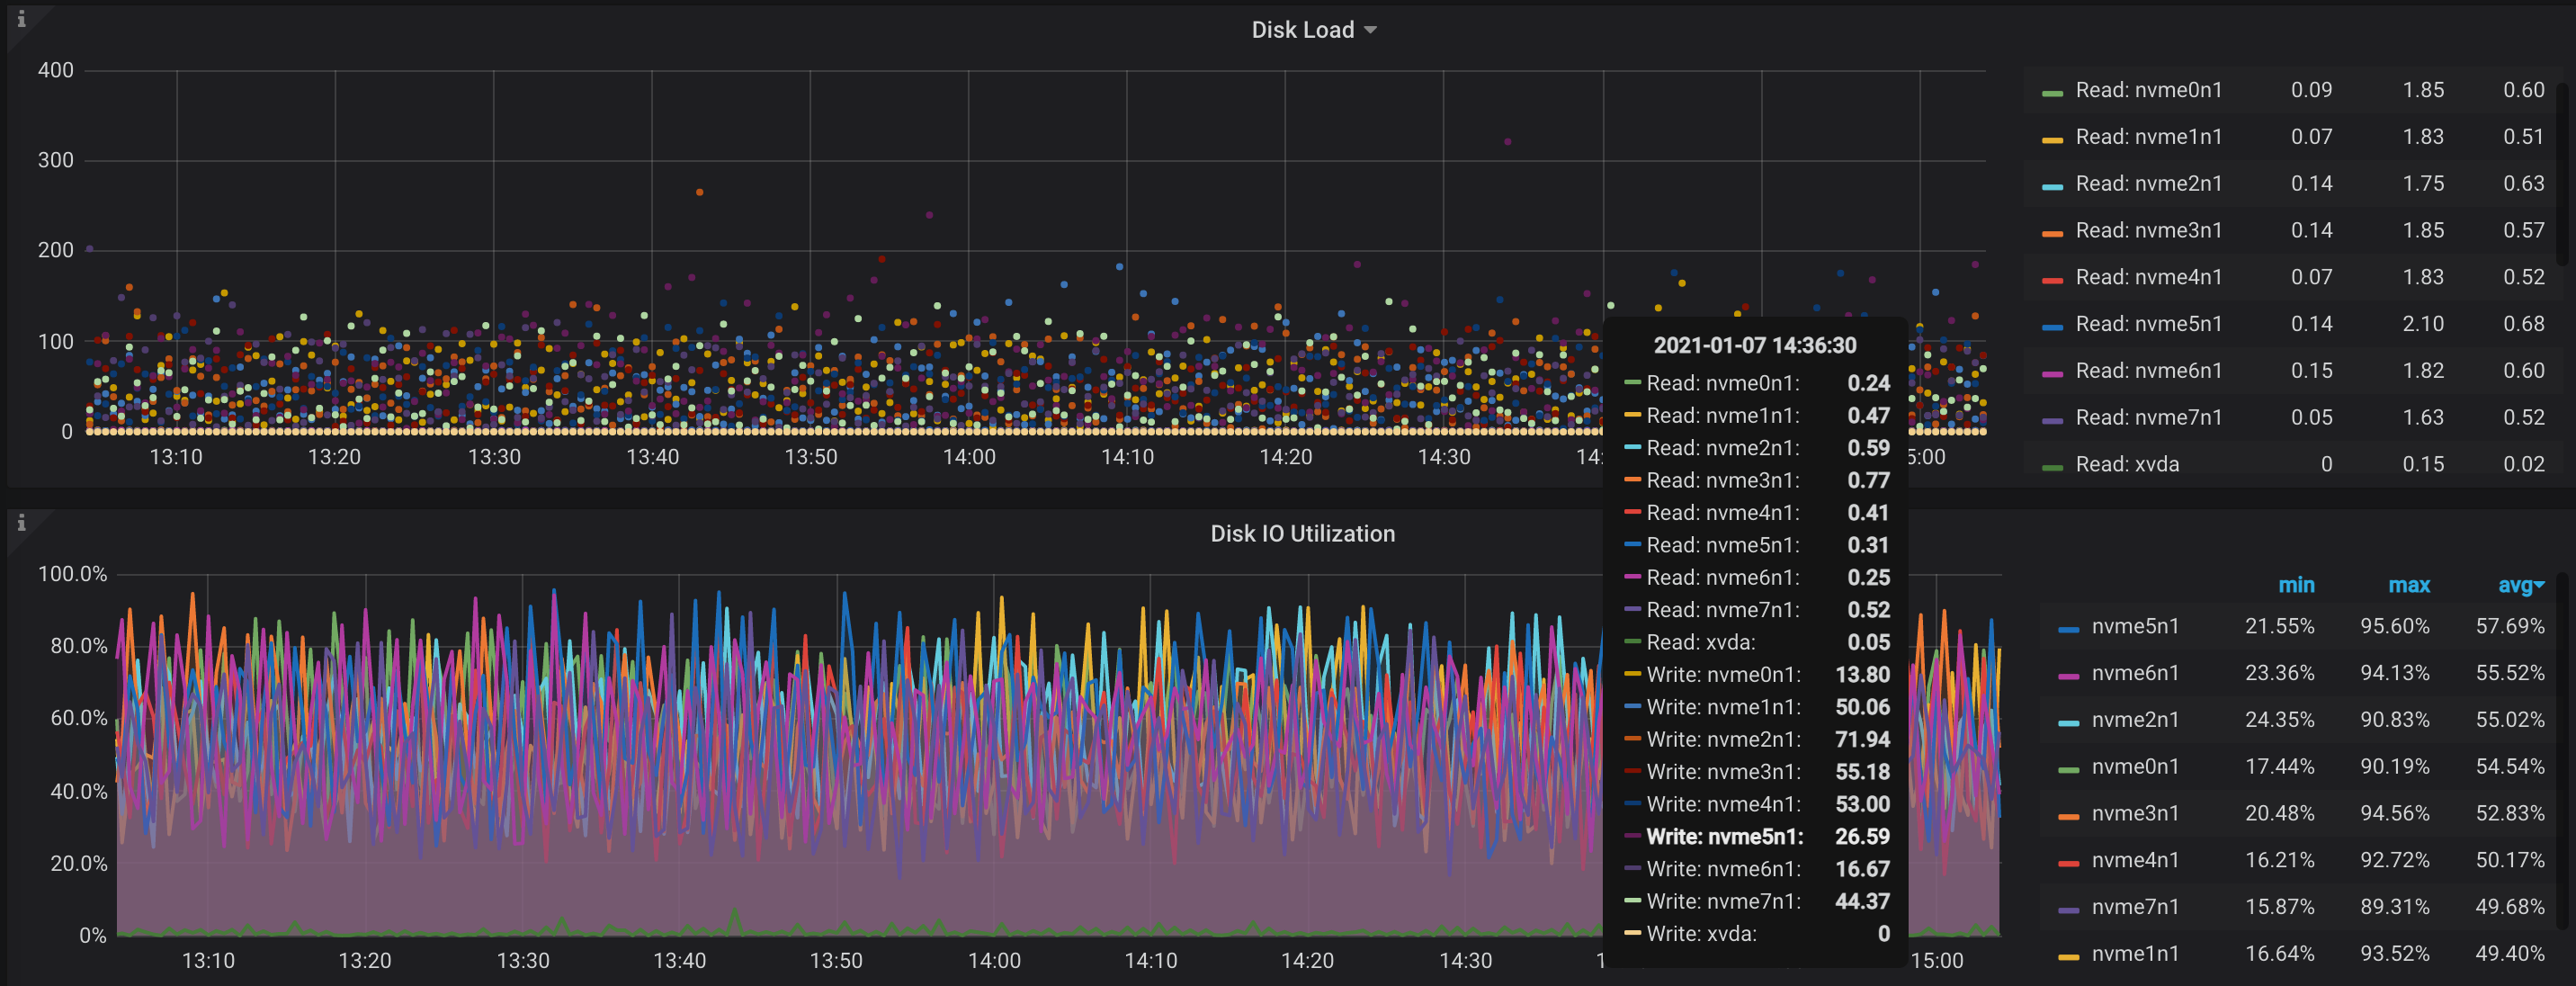
看磁盘使用率是比较高
具体可以看下 RocksDB-KV 和 Raft-KV 中的监控,那个是对于 rocksdb 的 kv 操作监控数据
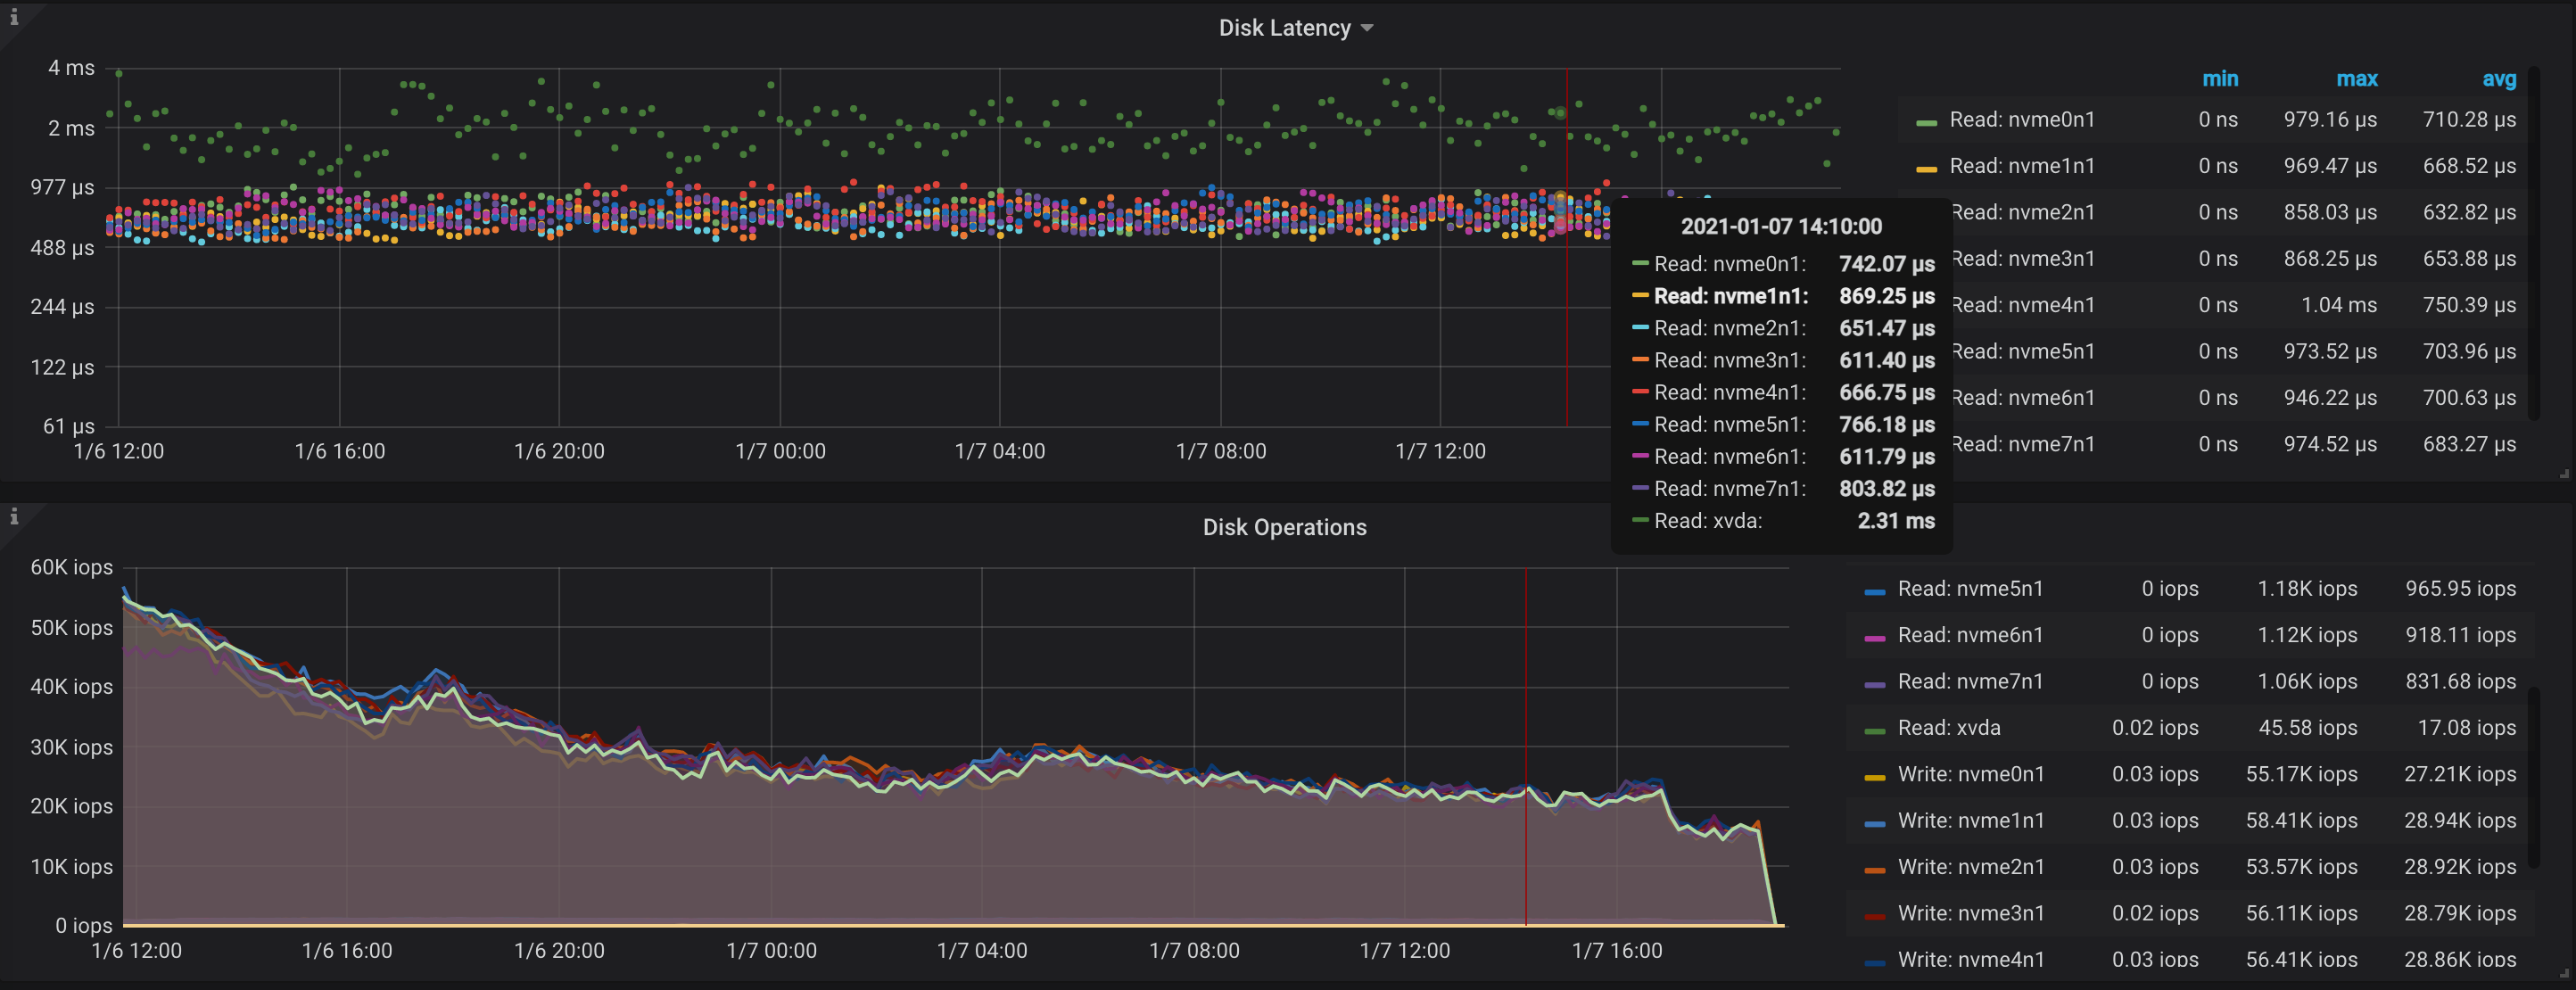
另外可以看下 node_exporter 监控中的磁盘延迟情况。
磁盘延迟感觉还好
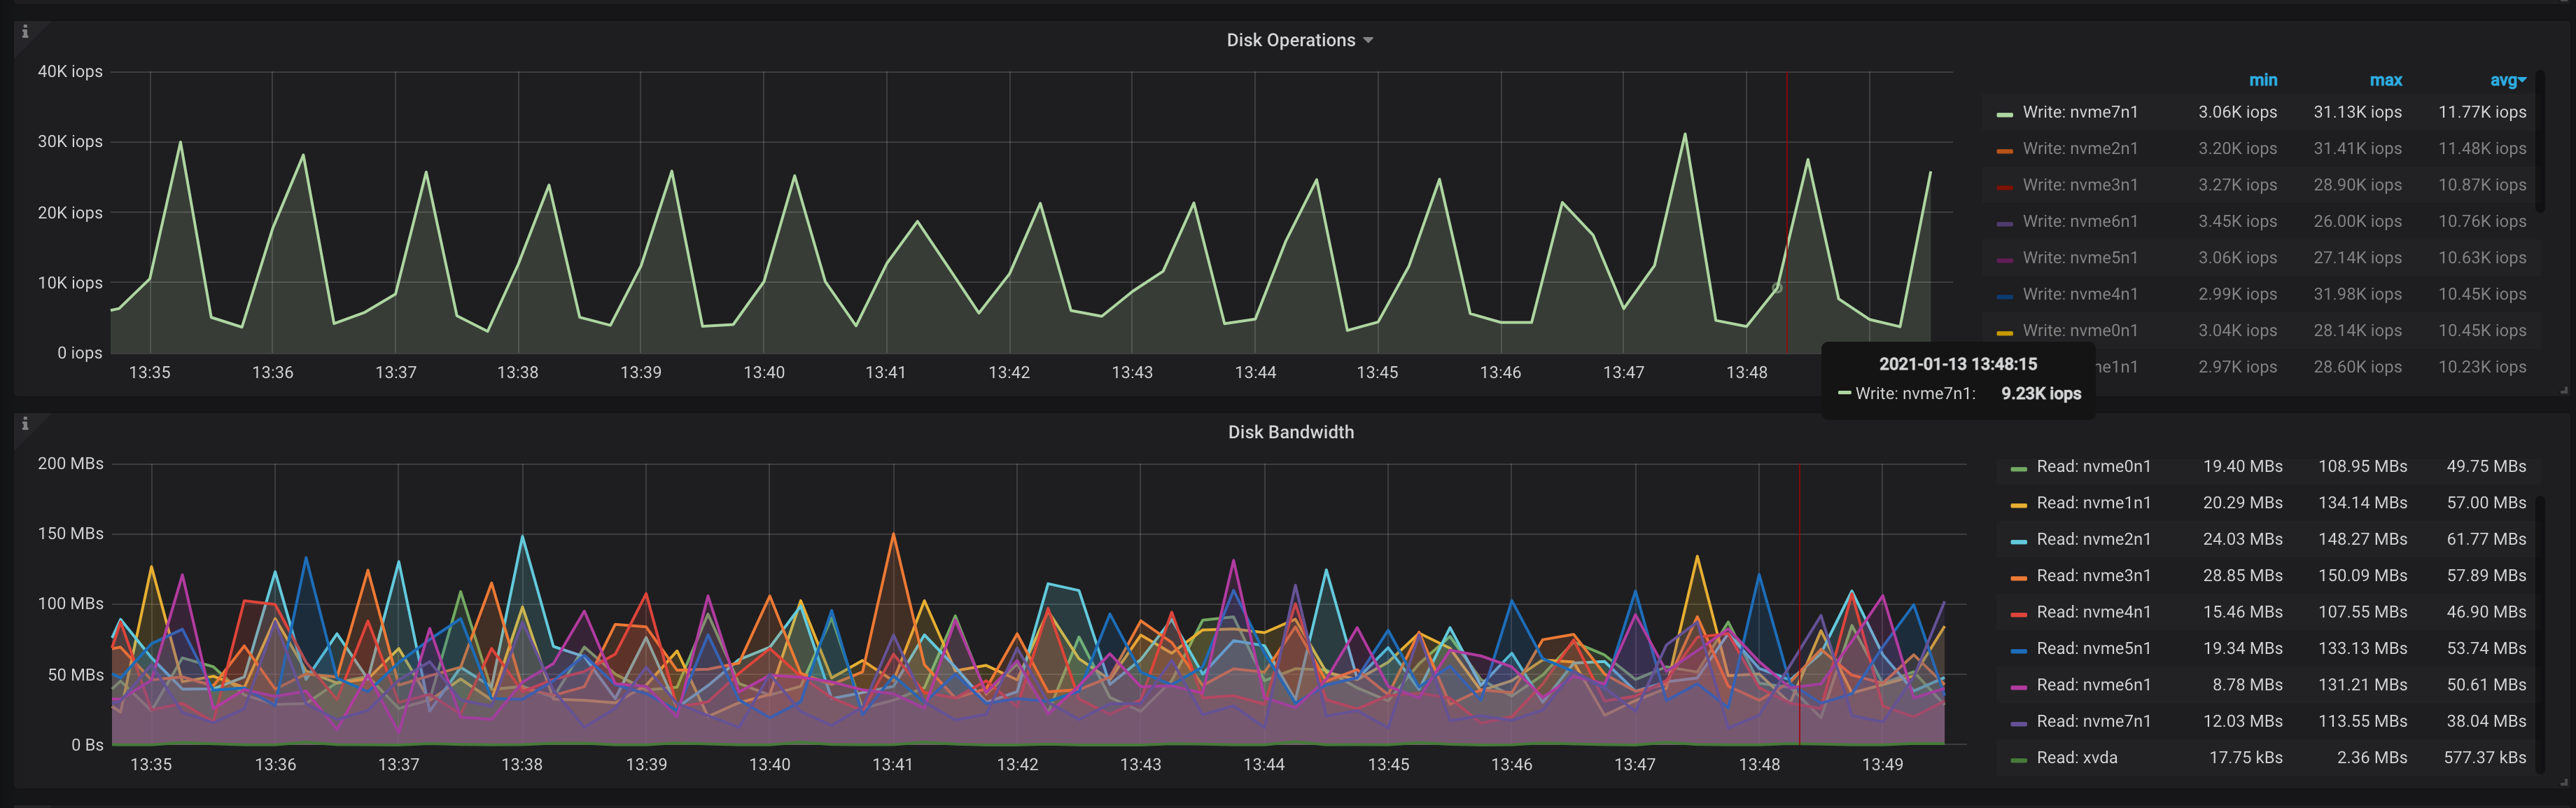
要确认是不是磁盘瓶颈的话,可以通过 fio 工具压测一下磁盘的基准性能看。通过监控看磁盘的 IOPS 量还是比较大的。
我看 disk performance 中的 单次 read write average size 都很大 几十 M,我用 fio 测的时候是不是应该使用 比较大的 block size 测试
可以参考这个 FAQ 压测一下:
https://docs.pingcap.com/zh/tidb/stable/deploy-and-maintain-faq#如何用-fio-命令测试-tikv-实例的磁盘性能
感谢 Gangshen,我测完再回复!
嗯嗯好的
来了,测试结果是这样的,我们的磁盘是 aws i3.x16xlarge,fio 测试结果是这样的 (见下)。我大概分析了一下你看对不对,混合读写情况下 读写 iops 都只有 6k 一共 12k,并且写比读稳定(写是顺序的),读 p99 在 3ms 内 写 p99 在 1ms 内,吞吐上来讲,目前使用率90+% 吞吐都为 210MB 每秒。
测试命令
我使用了默认的输出格式而不是 json,并且把 file name 设置为 ssd 盘目录下的一个文件。
read 测试结果
fio randread test: (g=0): rw=randread, bs=32K-32K/32K-32K/32K-32K, ioengine=psync, iodepth=4
...
fio-2.2.10
Starting 4 threads
fio randread test: Laying out IO file(s) (1 file(s) / 10240MB)
Jobs: 4 (f=4): [r(4)] [86.4% done] [6493MB/0KB/0KB /s] [208K/0/0 iops] [eta 00m:03s]
fio randread test: (groupid=0, jobs=4): err= 0: pid=37578: Tue Jan 12 19:37:08 2021
  read : io=40960MB, bw=2103.1MB/s, iops=67326, runt= 19468msec
    clat (usec): min=3, max=1235, avg=58.29, stdev=82.59
     lat (usec): min=3, max=1235, avg=58.38, stdev=82.60
    clat percentiles (usec):
     |  1.00th=[    7],  5.00th=[    8], 10.00th=[    9], 20.00th=[   10],
     | 30.00th=[   10], 40.00th=[   11], 50.00th=[   12], 60.00th=[   13],
     | 70.00th=[   15], 80.00th=[  181], 90.00th=[  199], 95.00th=[  215],
     | 99.00th=[  253], 99.50th=[  270], 99.90th=[  310], 99.95th=[  326],
     | 99.99th=[  366]
    bw (KB  /s): min=161280, max=2273408, per=22.44%, avg=483394.95, stdev=427744.49
    lat (usec) : 4=0.01%, 10=18.34%, 20=55.72%, 50=0.87%, 100=0.06%
    lat (usec) : 250=23.88%, 500=1.12%, 750=0.01%
    lat (msec) : 2=0.01%
  cpu          : usr=3.29%, sys=31.60%, ctx=327735, majf=0, minf=129
  IO depths    : 1=100.0%, 2=0.0%, 4=0.0%, 8=0.0%, 16=0.0%, 32=0.0%, >=64=0.0%
     submit    : 0=0.0%, 4=100.0%, 8=0.0%, 16=0.0%, 32=0.0%, 64=0.0%, >=64=0.0%
     complete  : 0=0.0%, 4=100.0%, 8=0.0%, 16=0.0%, 32=0.0%, 64=0.0%, >=64=0.0%
     issued    : total=r=1310720/w=0/d=0, short=r=0/w=0/d=0, drop=r=0/w=0/d=0
     latency   : target=0, window=0, percentile=100.00%, depth=4

Run status group 0 (all jobs):
   READ: io=40960MB, aggrb=2103.1MB/s, minb=2103.1MB/s, maxb=2103.1MB/s, mint=19468msec, maxt=19468msec

Disk stats (read/write):
  nvme0n1: ios=327670/0, merge=0/0, ticks=56764/0, in_queue=56724, util=96.50%
fio mixed randread and sequential write test: (g=0): rw=randrw, bs=32K-32K/32K-32K/32K-32K, ioengine=psync, iodepth=4
...
fio-2.2.10
Starting 4 threads
fio mixed randread and sequential write test: Laying out IO file(s) (1 file(s) / 10240MB)
Jobs: 4 (f=4): [m(4)] [100.0% done] [249.7MB/251.3MB/0KB /s] [7987/8032/0 iops] [eta 00m:00s]
fio mixed randread and sequential write test: (groupid=0, jobs=4): err= 0: pid=37479: Tue Jan 12 19:33:24 2021
  read : io=12731MB, bw=217274KB/s, iops=6789, runt= 60001msec
    clat (usec): min=7, max=4332, avg=261.95, stdev=509.64
     lat (usec): min=7, max=4332, avg=262.10, stdev=509.64
    clat percentiles (usec):
     |  1.00th=[   11],  5.00th=[   12], 10.00th=[   12], 20.00th=[   13],
     | 30.00th=[   14], 40.00th=[   15], 50.00th=[  181], 60.00th=[  201],
     | 70.00th=[  231], 80.00th=[  270], 90.00th=[  498], 95.00th=[ 1336],
     | 99.00th=[ 2704], 99.50th=[ 2960], 99.90th=[ 3344], 99.95th=[ 3440],
     | 99.99th=[ 3632]
    bw (KB  /s): min=41984, max=70080, per=24.97%, avg=54259.30, stdev=5804.31
  write: io=12740MB, bw=217423KB/s, iops=6794, runt= 60001msec
    clat (usec): min=17, max=6065, avg=47.02, stdev=26.67
     lat (usec): min=17, max=6066, avg=48.13, stdev=26.73
    clat percentiles (usec):
     |  1.00th=[   21],  5.00th=[   24], 10.00th=[   25], 20.00th=[   26],
     | 30.00th=[   29], 40.00th=[   32], 50.00th=[   38], 60.00th=[   47],
     | 70.00th=[   55], 80.00th=[   66], 90.00th=[   82], 95.00th=[   96],
     | 99.00th=[  127], 99.50th=[  141], 99.90th=[  169], 99.95th=[  181],
     | 99.99th=[  211]
    bw (KB  /s): min=41536, max=70336, per=24.98%, avg=54313.90, stdev=6044.73
    lat (usec) : 10=0.07%, 20=23.74%, 50=31.44%, 100=16.61%, 250=15.70%
    lat (usec) : 500=7.45%, 750=1.05%, 1000=0.78%
    lat (msec) : 2=1.60%, 4=1.57%, 10=0.01%
  cpu          : usr=1.32%, sys=33.38%, ctx=1288454, majf=0, minf=297
  IO depths    : 1=100.0%, 2=0.0%, 4=0.0%, 8=0.0%, 16=0.0%, 32=0.0%, >=64=0.0%
     submit    : 0=0.0%, 4=100.0%, 8=0.0%, 16=0.0%, 32=0.0%, 64=0.0%, >=64=0.0%
     complete  : 0=0.0%, 4=100.0%, 8=0.0%, 16=0.0%, 32=0.0%, 64=0.0%, >=64=0.0%
     issued    : total=r=407396/w=407675/d=0, short=r=0/w=0/d=0, drop=r=0/w=0/d=0
     latency   : target=0, window=0, percentile=100.00%, depth=4

Run status group 0 (all jobs):
   READ: io=12731MB, aggrb=217274KB/s, minb=217274KB/s, maxb=217274KB/s, mint=60001msec, maxt=60001msec
  WRITE: io=12740MB, aggrb=217423KB/s, minb=217423KB/s, maxb=217423KB/s, mint=60001msec, maxt=60001msec

Disk stats (read/write):
  nvme0n1: ios=211737/502981, merge=0/0, ticks=97036/65396, in_queue=162168, util=94.89%
avg iops 也不是很高
所以基于我对 fio 性能分析 以及 现在 disk 的表现来看,我认为目前 disk 不是瓶颈,你觉得合理吗
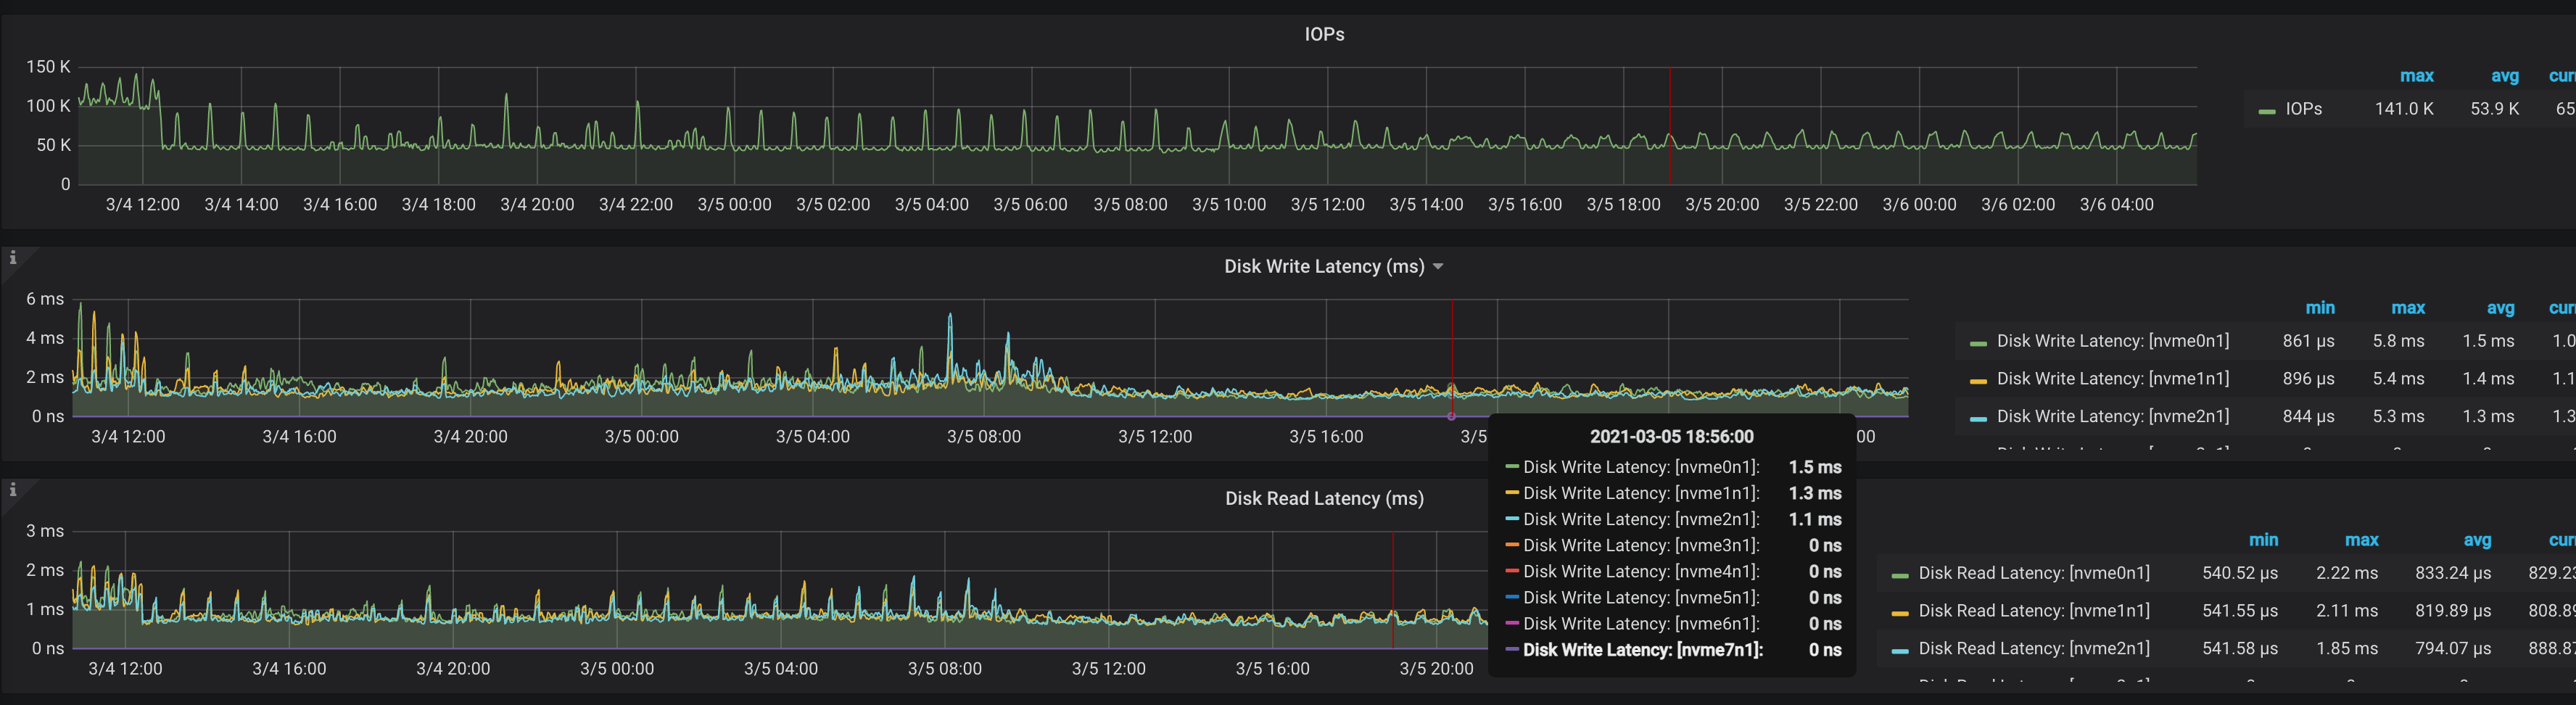
Disk write latency 如果是 SSD 的话,3ms 这个延迟就有点高
看磁盘 Disk Throughput 吞吐在抖动高峰也达到了 fio 压测的带宽值
另外 SSD 因为是多通道写入的,所以 IO Util 这个监控在 SSD 磁盘上不是特别具有参考意义
在更多的测试下我们发现,一方面我们的 value 比较大 ~1M,~1.5ms 的 disk write latency 是没有明显瓶颈的,如果抖动明显并且在3ms 左右的话则明显打到瓶颈
方便共享上传下测试报告吗?多谢。
感谢。
此话题已在最后回复的 1 分钟后被自动关闭。不再允许新回复。