课程名称:课程版本(101/201/301)+ 3.7.2 The lifecycle of a SQL and relevant metrics(TiDB 的 SQL 的生命周期和关键监控指标)
学习时长:10
课程内容:
一、 sql 在 tidb 的流程
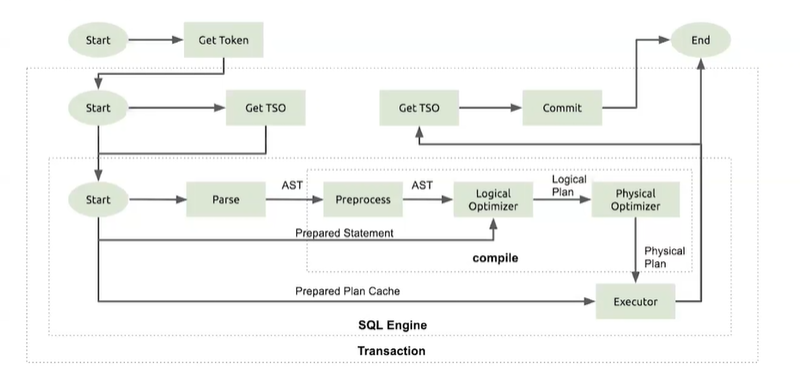
-
在执行前
- Get Token
- Token limits the concurrency of SQLS
- Relates to config ‘token-timit’
- Grafana: Get Token Duration
- Get TSO
- Get timestamp from PD asynchronously
- Dashboard (SQL Statements & Slow Queries)
- Grafana: PD TSO Wait Duration (relate to load on TiDB itself)
- Grafana: PD TSO RPC Duration (latency between TiDB and PD & load on PD)
- Get Token
-
Parse and Compile
- Parse
- Dashboard (sQL Statements & Slow Queries)
- Grafana: Parse Duration
- compile
- Preprocess(validator & type infer)+ Optimize
- Dashboard (SQL Statements & Slow Queries)
- Grafana: Compile Duration
- Prepared Statements
- Saves cost of parsing and preprocessing
- Grafana: Prepare Statement Count
- Prepared Plan Cache
- Saves cost of optimizing
- Grafana: Plan Cache Hits
- Parse
-
执行
- Execution Duration
- Expensive Executors OPS
- HashAgg / Sort / lndexLookUp …
- Relates to system variables `tidb_{operator}_concurrency
- KV Request
- KV Request Duration 99
- TiClient Region Error OPS
- Lock Resolve OPS
-
DistSQL : tidb 向tikv 发送请求接收数据的接口
- DistSQL Duration
- Requests are sent concurrently
- Relates to system variable 'tidb_distsql_scan_concurrency
- Scan Keys
- Dashboard (SQL Statements & Slow Queries)
- Grafana: Scan Keys
- Coprocessor & Get & Batch Get
- KV Request OPS
- DistSQL Duration
-
事务
- KV Transaction Duration
- Local Latch
- waits for memory lock in TiDB before prewriting
- Suitable for high conflicting scenarios and disabled by default
- Dashboard (SQL Statements & Slow Queries)
- Grafana: Local Latch Wait Time
- Transaction Retry
- Some errors are retriable, e.g. write conflicts
- Dashboard (SQL Statements & Slow Queries)。
- Grafana: Transaction Retry Num
二、 Tikv组件内的流程
-
KV 请求
- gRPC Message Duration (indicates all time cost in TiKV)
- kv_get / kv_batch_get / coprocessor
- KV Duration in TiDB ~= gRPC Message Duration + network RTT
- gRPC Message Duration (indicates all time cost in TiKV)
-
事务
- Prewrite & Commit
- Dashboard (SQL Statements & Slow Queries)
- Resolve Lock
- Dashboard (SQL Statements & Slow Queries)
- Lock Resolve OPS
- Prewrite & Commit
-
Raft Store : Raft store uses Raft to keep replicas consistent.
- Raft propose
- Propose wait duration
- Apply wait duration
- Raft lO
- Append log duration
- Apply log duration
- Commit log duration
- Raft propose
-
Coprocessor
- Coprocessor Execution Time
- Dashboard (SQL Statements & Slow Queries)
- Request Duration
- coprocessor Wait Time
- Dashboard (SQL Statements & Slow Queries)
- Wait Duration
- Can be optimized through coprocessor cache
- Coprocessor Execution Time
-
RocksDB : Each TikV instance has 2 RocksDB instances: Raft and KV.
- Read
- Get / Seek duration
- Memtable hit
- Block cache hit
- SST read duration
- Write
- Write duration
- Compaction
- Compaction operations
- Compaction duration
- Read

三、
学习过程中遇到的问题或延伸思考:
- 问题 1:
- 问题 2:
- 延伸思考 1:
- 延伸思考 2: