课程名称:课程版本(101/201/301)+ 3.7.1 Metrics that DBAs should notice(运维中的关键监控)
学习时长:20
课程内容:
一、系统指标
- overview page, System lnfo
- CPU usage
- 小于 80%
- CPU load
- Should be less than the number of CPU Vcores
- Memory Available
- Tikv nodes: memory usage < 60%
- TiDB nodes: 20% free memoryo
- Network Traffic
- Should not exceed the bandwidth of the Network card
- IO Util
- lf reach 80%+, it may become the bottleneck
- CPU usage
二、TiDB
- 延迟
- Query Summary
- Duration: .99 latency should less than 100ms for OLTP workloado
- Slow query: there should not be too many slow queries.
- ldeal CPS: invisible metric, can make is visible by editing the grafana
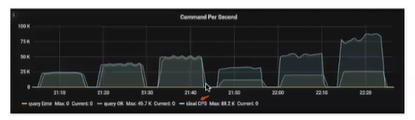
左侧说明延迟在TiDB端 可以通过增加Tidb 增加QPS 与 右侧说明延迟在客户端
- Server
- Get token duration: better <1ms, or please check the ‘token-limit’ configuration is larger than total count of connections
·
- Get token duration: better <1ms, or please check the ‘token-limit’ configuration is larger than total count of connections
- Executor
- Parse duration: better < 10ms
- Compile duration: better < 30ms
- KV Errors
- Lock Resolve OPS: better < 500 for
expiredandnot_expired, or there may be too many conflicts - kv Backoff OPS: better < 500 for both ‘txnLockFast’ and `txnLock’
- Lock Resolve OPS: better < 500 for
- PD Client
- PD TSO .99 wait Duration: better < 5ms
- Query Summary
三、TiKV
- Cluster
- Region: better < 50K, or the region merge feature and the hibernate region feature are necessary
- gRPC
- .99 gRPC message duration: better <100ms (expect complicated coprocessor requests)
- Thread CPU
- Raft store CPU: better < 75%*
raftstore.store-pool-size - Async apply CPU: better < 75%*
raftstore.apply-pool-size - Scheduler worker CPU: better<80%*
storage.scheduler-worker-pool-size - gRPC poll CPU: better <80%*
server.grpc-concurrency - Unified read pool CPu: better<80%*
readpool.unified.max-thread-count - Storage ReadPool CPu: better <80%*
readpool.storage.normal-concurrency
- Raft store CPU: better < 75%*
- Raft lQ
- Append log duration: .99 latency better < 10ms
- Apply log duration:.99 latency better < 30ms
- Commit log duration: .99 latency better < 30ms
- Also should notice the .999 latency for above metrics
- Raft propose
- Propose wait duration:.99 latency better < 20ms
- Apply wait duration: .99 latency better < 50ms
- Also should notice the .999 latency for above metrics
- Errors
- Server is busy: 最好不要出现
四、PD
- etcd
- 99% WAL Fsync duration: better < 5ms (刷盘满的话会导致慢)
- Heartbeat
- 99% Region heartbeat latency: better < 5ms
五、dashboard
- Summary
- QPS/Latency
- Top SQL
- Latest Slow Query
- keyviz
- Pay attention to hot spot issue
- SQL statements
- Execute count/Avg latency
- Slow Query
- Execute plan
学习过程中遇到的问题或延伸思考:
- 问题 1:
- 问题 2:
- 延伸思考 1:
- 延伸思考 2: