tiflash 副本不可用,同步数据进度为0

tidb 集群版本:v4.0.8
tiflash 以扩容的方式接入集群,从pd的日志看到啥接入成功的

现象:
1 2020/12/25 18:12:42 同步数据表A,设置副本1,同步成功,副本可用
2 2020/12/25 18:13:42 同步数据表B,设置副本1,同步进度一直卡在0.5,副本不可用
3 2020/12/26 15:30:57 移除数据表B的副本
4 2020/12/26 15:31:27 同步数据表C,设置副本1,同步进度一直为0,副本不可用

已按官网步骤进行排查(未发现异常)
1 Placement Rules 已开启
2 通过 TiFlash-Summary 监控面板下的 UpTime 检查操作系统中 TiFlash 进程正常


3 通过 pd-ctl 查看 TiFlash proxy 状态正常
image
4 查看 pd buddy 可以正常打印日志

5 检查配置的副本数是否小于等于集群 TiKV 节点数,目前配置tiflash表副本1,tikv节点数为3
6 机器剩余磁盘空间是足够的
image

tiflash 日志有报错


这个报错日志是在我同步数据表B后出现的

问题
1 请问这个错误日志是什么意思?该如何解决?
2 是否是这个错误影响我的数据表同步进度呢?

1 个赞

麻烦通过 admin show ddl 看下当前集群的 ddl 进度,看下是不是有 DDL 卡主了。


请问这个是有 DDL 卡住?


这个表 50 多万数据,同步进度一直是 0.5

上面查询的结果是查找的 DDL owner 信息, admin show ddl jobs (参考:https://docs.pingcap.com/zh/tidb/dev/sql-statement-admin#admin-与-ddl-相关的扩展语句 ) 看下输出的结果中是否有 job 一直在 running 状态,另外可以看下 tilfash 其他日志是否有明显的 error 信息。

感谢回复~
无 job 一直 running


table_id = 209 昨晚 22:25 开始设置的同步,到目前进度一直卡在 0.5

日志如下:
tiflash_error.log

tiflash_cluster_manager.log 日志正常

tiflash.log 有 warn

tiflash_tikv.log 有一条 warn

请确认下 tiflash_cluster_manager.log 日志中是否有类似 “report to tidb: id 209” 的日志,以及其最后的日志是什么时间点打印的。

超级多,一直在打印这个日志

  1. 先在 TiDB 中使用 SHOW TABLE <table_name> REGIONS; 确认下 table_id 为 209 的表存在哪两个 REGION_ID
  2. 使用 grep 'region_id=<region_id>' tiflash_tikv.log* 查找下 tiflash_tikv 的日志,分别确认下是否有这两个 region id 相关的日志,分别是什么时间点发生的

时间点:
table_id = 209 2020/12/29 22:25 开始重新设置的同步
grep ‘region_id=1924’ tiflash_tikv.log* 无日志
grep ‘region_id=2028’ tiflash_tikv.log* 无日志
grep ‘region_id=1928’ tiflash_tikv.log* 无日志
grep ‘region_id=13380’ tiflash_tikv.log* 无日志

grep ‘region_id=13376’ tiflash_tikv.log*
[2020/12/29 22:25:45.870 +08:00] [INFO] [peer.rs:197] [“replicate peer”] [peer_id=13598] [region_id=13376]
[2020/12/29 22:25:45.870 +08:00] [INFO] [raft.rs:783] [“became follower at term 0”] [term=0] [raft_id=13598] [region_id=13376]
[2020/12/29 22:25:45.870 +08:00] [INFO] [raft.rs:285] [newRaft] [peers=“[]”] [“last term”=0] [“last index”=0] [applied=0] [commit=0] [term=0] [raft_id=13598] [region_id=13376]
[2020/12/29 22:25:45.870 +08:00] [INFO] [raw_node.rs:222] [“RawNode created with id 13598.”] [id=13598] [raft_id=13598] [region_id=13376]
[2020/12/29 22:25:45.870 +08:00] [INFO] [raft.rs:1003] [“received a message with higher term from 13379”] [“msg type”=MsgHeartbeat] [message_term=6] [term=0] [from=13379] [raft_id=13598] [region_id=13376]
[2020/12/29 22:25:45.870 +08:00] [INFO] [raft.rs:783] [“became follower at term 6”] [term=6] [raft_id=13598] [region_id=13376]
[2020/12/29 22:25:50.419 +08:00] [INFO] [raft.rs:1957] [“[commit: 0, lastindex: 0, lastterm: 0] starts to restore snapshot [index: 9, term: 6]”] [snapshot_term=6] [snapshot_index=9] [last_term=0] [last_index=0] [commit=0] [raft_id=13598] [region_id=13376]
[2020/12/29 22:25:50.419 +08:00] [INFO] [raft_log.rs:487] [“log [committed=0, applied=0, unstable.offset=1, unstable.entries.len()=0] starts to restore snapshot [index: 9, term: 6]”] [snapshot_term=6] [snapshot_index=9] [log=“committed=0, applied=0, unstable.offset=1, unstable.entries.len()=0”] [raft_id=13598] [region_id=13376]
[2020/12/29 22:25:50.419 +08:00] [INFO] [raft.rs:1893] [“[commit: 9, term: 6] restored snapshot [index: 9, term: 6]”] [snapshot_term=6] [snapshot_index=9] [commit=9] [term=6] [raft_id=13598] [region_id=13376]
[2020/12/29 22:25:50.419 +08:00] [INFO] [peer_storage.rs:985] [“begin to apply snapshot”] [peer_id=13598] [region_id=13376]
[2020/12/29 22:25:50.419 +08:00] [INFO] [peer_storage.rs:1025] [“apply snapshot with state ok”] [state=“applied_index: 9 truncated_state { index: 9 term: 6 }”] [region=“id: 13376 start_key: 7480000000000000FFD15F728000000000FF58381A0000000000FA end_key: 7480000000000000FFD200000000000000F8 region_epoch { conf_ver: 8 version: 105 } peers { id: 13377 store_id: 1 } peers { id: 13378 store_id: 4 } peers { id: 13379 store_id: 5 } peers { id: 13598 store_id: 13595 is_learner: true }”] [peer_id=13598] [region_id=13376]
[2020/12/29 22:25:50.423 +08:00] [INFO] [peer.rs:2409] [“snapshot is applied”] [region=“id: 13376 start_key: 7480000000000000FFD15F728000000000FF58381A0000000000FAend_key: 7480000000000000FFD200000000000000F8 region_epoch { conf_ver: 8 version: 105 } peers { id: 13377 store_id: 1 } peers { id: 13378 store_id: 4 } peers { id:13379 store_id: 5 } peers { id: 13598 store_id: 13595 is_learner: true }”] [peer_id=13598] [region_id=13376]
[2020/12/29 22:25:51.729 +08:00] [INFO] [region.rs:318] [“pre handle snapshot”] [time_takes=1.306598447s] [state=“applied_index: 9 truncated_state { index: 9 term:6 }”] [peer_id=13598] [region_id=13376]
[2020/12/29 22:25:51.736 +08:00] [INFO] [region.rs:364] [“begin apply snap data”] [region_id=13376]
[2020/12/29 22:25:51.736 +08:00] [INFO] [region.rs:393] [“apply data with pre handled snap”] [region_id=13376]
[2020/12/29 22:25:52.512 +08:00] [INFO] [region.rs:420] [“apply new data”] [time_takes=775.809528ms] [region_id=13376]
[2020/12/29 22:26:28.235 +08:00] [INFO] [peer.rs:639] [“deleting applied snap file”] [snap_file=13376_6_9] [peer_id=13598] [region_id=13376]

使用以下命令 tiup ctl pd -u http://<pd-ip>:<pd-port> region 1924,分别确认 Region 1924 和 13376 在 PD 中的 peer 信息。
另外想确认下,集群中是一直只有 1个 TiFlash 节点吗?

非常感谢~

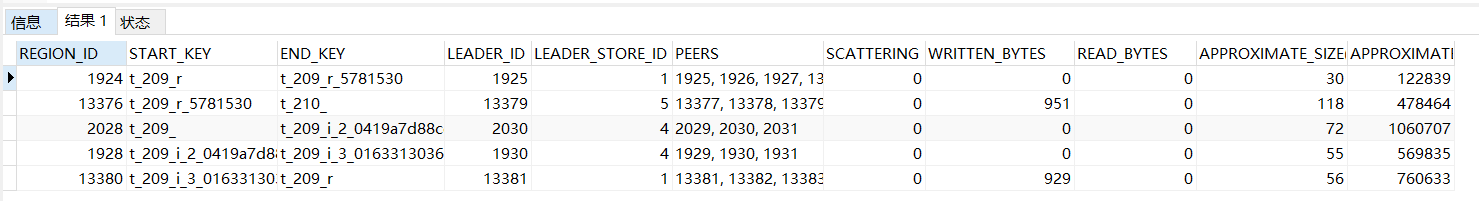
tiup ctl pd -u http://: region 1924
{
“id”: 1924,
“start_key”: “7480000000000000FFD15F720000000000FA”,
“end_key”: “7480000000000000FFD15F728000000000FF58381A0000000000FA”,
“epoch”: {
“conf_ver”: 8,
“version”: 106
},
“peers”: [
{
“id”: 1925,
“store_id”: 1
},
{
“id”: 1926,
“store_id”: 4
},
{
“id”: 1927,
“store_id”: 5
},
{
“id”: 13597,
“store_id”: 13595,
“is_learner”: true
}
],
“leader”: {
“id”: 1925,
“store_id”: 1
},
“down_peers”: [
{
“peer”: {
“id”: 13597,
“store_id”: 13595,
“is_learner”: true
},
“down_seconds”: 77657
}
],
“pending_peers”: [
{
“id”: 13597,
“store_id”: 13595,
“is_learner”: true
}
],
“written_bytes”: 0,
“read_bytes”: 0,
“written_keys”: 0,
“read_keys”: 0,
“approximate_size”: 30,
“approximate_keys”: 122839
}

tiup ctl pd -u http://: region 13376
{
“id”: 13376,
“start_key”: “7480000000000000FFD15F728000000000FF58381A0000000000FA”,
“end_key”: “7480000000000000FFD200000000000000F8”,
“epoch”: {
“conf_ver”: 8,
“version”: 105
},
“peers”: [
{
“id”: 13377,
“store_id”: 1
},
{
“id”: 13378,
“store_id”: 4
},
{
“id”: 13379,
“store_id”: 5
},
{
“id”: 13598,
“store_id”: 13595,
“is_learner”: true
}
],
“leader”: {
“id”: 13379,
“store_id”: 5
},
“written_bytes”: 951,
“read_bytes”: 0,
“written_keys”: 2,
“read_keys”: 0,
“approximate_size”: 118,
“approximate_keys”: 478464
}

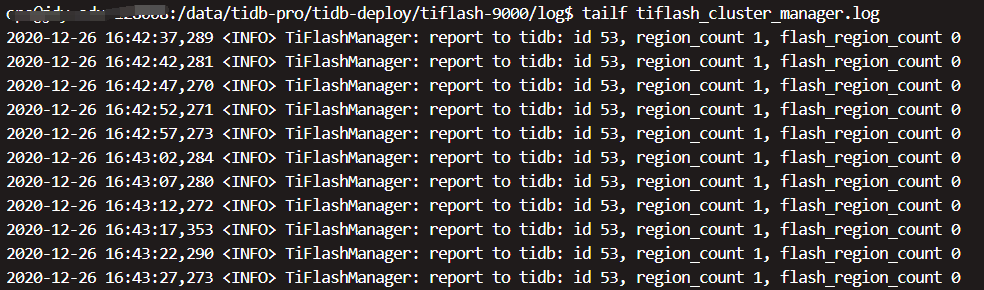
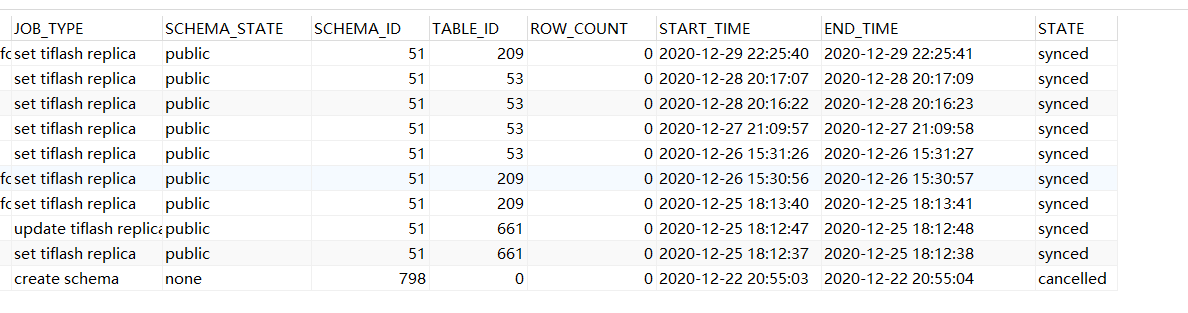
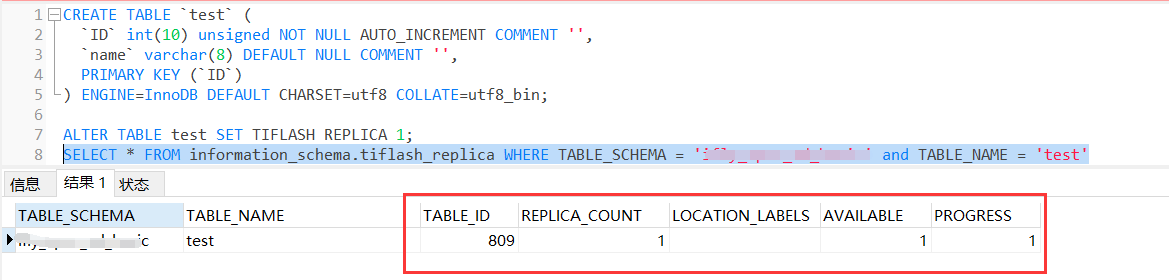
集群中一直只有 1个 TiFlash 节点,但这个节点部署过两次
2020/12/25 18点 第一次部署成功,然后同步数据表副本不可用,未排查出原因后强制下线了。
2020/12/29 22点 第二次部署成功

老师,请问这个同步的问题有解吗?捉急~

echo "DBGInvoke dump_all_region(209,true)" | curl "http://<tiflash-ip>:<tiflash-http-port>/?query=" --data-binary @- > tiflash_regions.log

麻烦用这个命令,导出下 tiflash 中 的 region 信息。tiflash-http-port 为 tiup cluster display 结果中 Ports 一列的第二个端口,默认值为 8123。

另外还有两件事情希望帮助确认下:

  1. 目前如果新建一个表,插入一条数据,设置 tiflash 副本后,能够正常同步吗?
  2. 12/25 时的 “强制下线”,具体是进行了哪些操作?

可以正常同步

我觉得这个和强制下线应该没啥关系。因为在第一次部署成功后,同步数据就存在和目前一样的问题。
我简述一下具体下线操作:
1 tiup cluster scale-in tidb-pro --node tiflash:port
2 tiup cluster display tidb-pro 查看节点一直存在且状态为 offline
3 tiup cluster scale-in tidb-pro -N tiflash:port --force
4 tiup cluster display tidb-pro 查看节点不存在了
5 重新扩容启动 tiflash 失败
6 tiup ctl pd -u http://172.21.52.86:2379 store 查看 store 一直存在
7 手动操作缩容:
tiup ctl pd -u store delete <store_id> 执行这个命令后发现 store 仍然存在
curl -X POST ‘http:///pd/api/v1/store/<store_id>/state?state=Tombstone’ 执行这个命名后 store 彻底清除了
8 重新执行扩容操作部署 tiflash 成功
9 再次同步数据表,仍然出现同步卡住的问题

目前应该是 PD 认为有一些 region 已经在 TiFlash 上存在 peer,但是实际上 TiFlash 上没有该 peer,PD也一直没有把新的数据调度到 TiFlash。表现在 PD 中显示为 down_peers。可以尝试在PD中手动进行 remove-peer 操作,把失效的 peer 移除掉,然后等待自行重新补 peer 即可。

https://docs.pingcap.com/zh/tidb/stable/pd-control#operator-check--show--add--remove
tiup ctl pd -u http://<pd-ip>:<pd-port> operator add remove-peer <region-id> <tiflash-store-id>

根据上面的您提供 pd 中的信息,可以进行这样的操作 tiup ctl pd -u http://<pd-ip>:<pd-port> operator add remove-peer 1924 13595

感谢,我来试试