课程名称: 3.1.1 TiDB Cluster Monitoring(本地化部署的 TiDB 集群监控)
学习时长:
3h
课程收获:
- 了解 TiDB 的监控系统的架构
- 了解 Overview 面板的各项参数的意义
- 了解报警规则与报警邮件的配置
课程内容:
本课程简要介绍了 TiDB 的监控系统及其报警组件的架构及使用。 首先从 TiDB 的基础监控 Overview 面板开始,获得集群的所有组件状态信息,PD 的调度信息,TiDB/TiKV 的计算及 IO 信息,来做一个初步的健康检查。然后介绍了报警组件 Alert Manager 的报警规则及如何配置发送报警邮件。
监控技术栈
TiDB 使用开源时序数据库 Prometheus 作为监控和性能指标信息存储方案,使用 Grafana 作为可视化组件进行展示。
Prometheus 在 TiDB 中的应用
Prometheus 是一个拥有多维度数据模型的、灵活的查询语句的时序数据库。Prometheus 作为热门的开源项目,拥有活跃的社区及众多的成功案例。
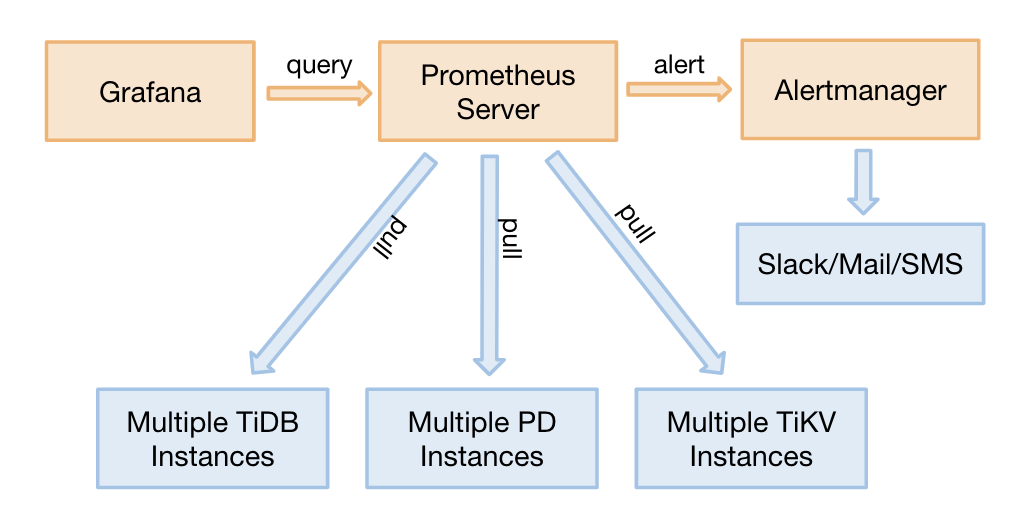
Prometheus 提供了多个组件供用户使用。目前,TiDB 使用了以下组件:
- Prometheus Server:用于收集和存储时间序列数据。
- Client 代码库:用于定制程序中需要的 Metric。
- Alertmanager:用于实现报警机制。
其结构如下图所示:
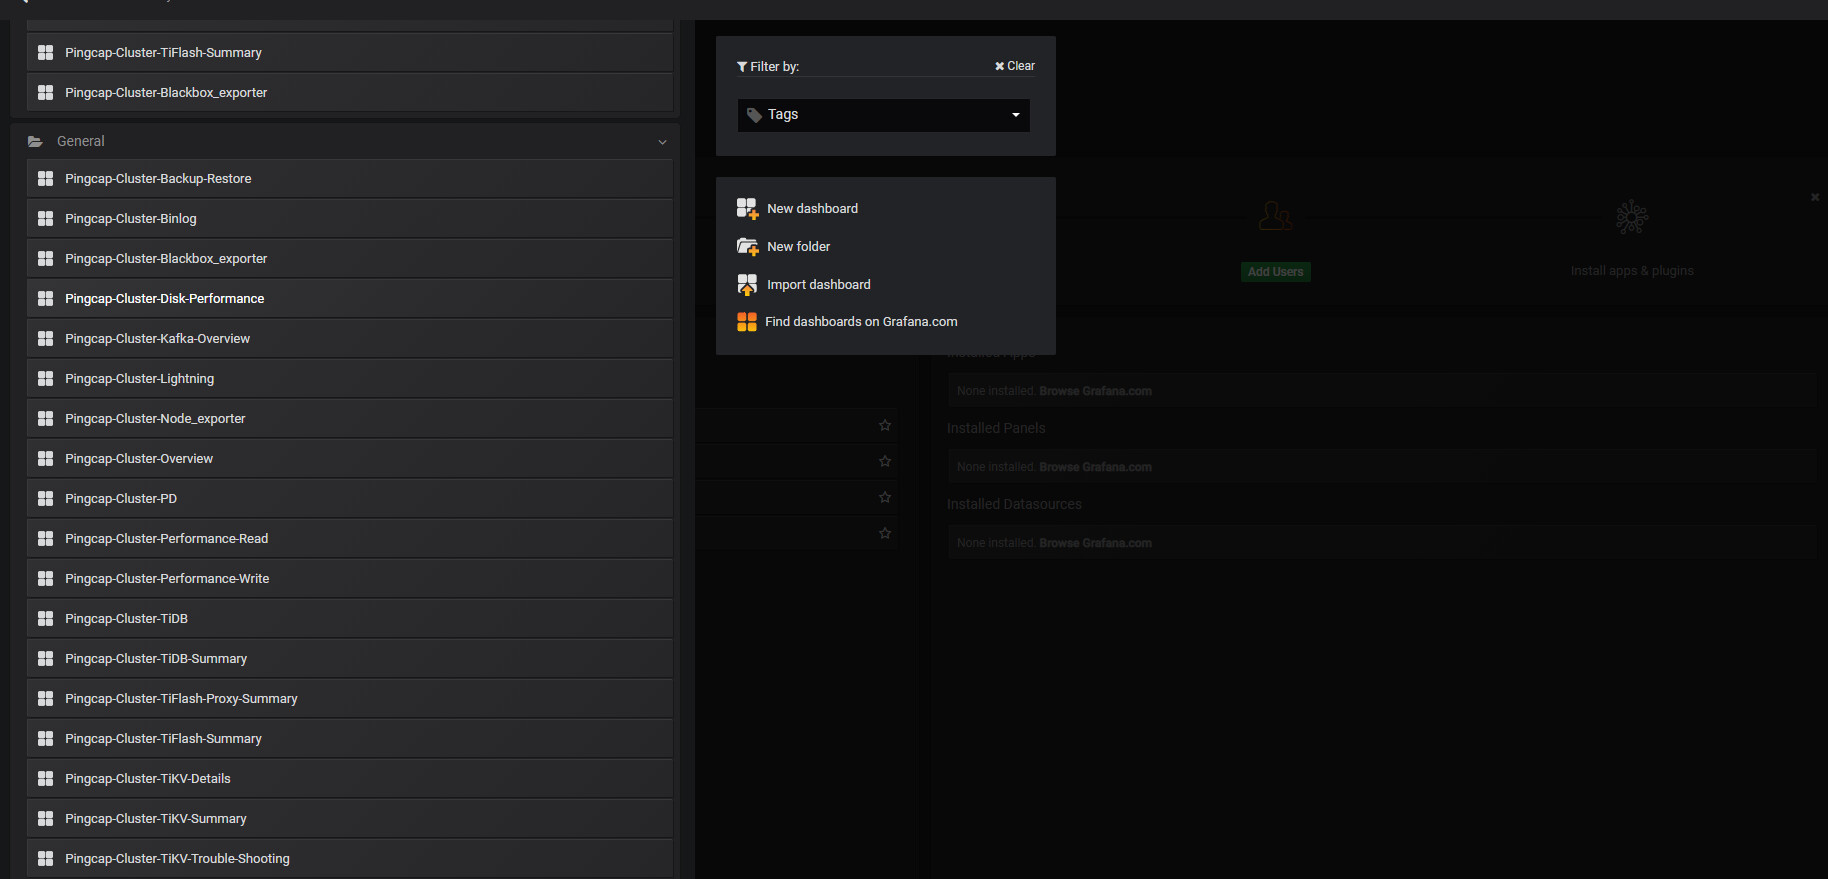
Grafana 在 TiDB 中的应用
Grafana 是一个开源的 metric 分析及可视化系统。TiDB 使用 Grafana 来展示 TiDB 集群各组件的相关监控,监控项分组如下图所示:
监控指标梳理
OverView
| No. | 备注 | Service | Panel Name | Description | Normal Range |
|---|---|---|---|---|---|
| 1 | Services Port Status | Services Up | 各服务在线节点数量 | ||
| 2 | PD | PD role | 当前 PD 的角色 | ||
| 3 | PD | Storage capacity | TiDB 集群总可用数据库空间大小 | ||
| 4 | PD | Current storage size | TiDB 集群目前已用数据库空间大小,TiKV 多副本的空间占用也会包含在内 | ||
| 5 | PD | Normal stores | 处于正常状态的节点数目 |
其余由于内容太多,这里不一一列出,本地用excel表格保存,方便快速查看。
大家可以自己根据官方帮助文档去整理学习。
告警规则梳理
| No. | Panel Name | Level | Rule Name | Alert Rule | Description | Solution |
|---|---|---|---|---|---|---|
| 1 | TiDB | Emergency | TiDB_schema_error | increase(tidb_session_schema_lease_error_total{type=“outdated”}[15m]) > 0 | TiDB 在一个 Lease 时间内没有重载到最新的 Schema 信息。如果 TiDB 无法继续对外提供服务,则报警。 | 该问题通常由于 TiKV Region 不可用或超时导致,需要看 TiKV 的监控指标定位问题。 |
| 2 | TiDB | Emergency | TiDB_tikvclient_region_err_total | increase(tidb_tikvclient_region_err_total[10m]) > 6000 | TiDB 访问 TiKV 时发生了 Region 错误。如果在 10 分钟之内该错误多于 6000 次,则报警。 | 查看 TiKV 的监控状态。 |
| 3 | TiDB | Emergency | TiDB_domain_load_schema_total | increase(tidb_domain_load_schema_total{type=“failed”}[10m]) > 10 | TiDB 重载最新的 Schema 信息失败的总次数。如果在 10 分钟之内重载失败次数超过 10 次,则报警。 | 该问题通常由于 TiKV Region 不可用或超时导致,需要看 TiKV 的监控指标定位问题。 |
| 4 | TiDB | Emergency | TiDB_monitor_keep_alive | increase(tidb_monitor_keep_alive_total[10m]) < 100 | 表示 TiDB 的进程是否仍然存在。如果在 10 分钟之内 tidb_monitor_keep_alive_total 增加次数少于 100,则 TiDB 的进程可能已经退出,此时会报警。 | 检查 TiDB 进程是否 OOM。 检查机器是否发生了重启。 |
| 5 | TiDB | Critical | TiDB_server_panic_total | increase(tidb_server_panic_total[10m]) > 0 | 发生崩溃的 TiDB 线程的数量。当出现崩溃的时候会报警。该线程通常会被恢复,否则 TiDB 会频繁重启。 | 收集 panic 日志,定位原因。 |
| 6 | TiDB | Warning | TiDB_memory_abnormal | go_memstats_heap_inuse_bytes{job=“tidb”} > 10 | 对 TiDB 内存使用量的监控。如果内存使用大于 10 G,则报警。 | 通过 HTTP API 来排查 goroutine 泄露的问题。 |
| 7 | TiDB | Warning | TiDB_query_duration | histogram_quantile(0.99, sum(rate(tidb_server_handle_query_duration_seconds_bucket[1m])) BY (le, instance)) > 1 | TiDB 处理请求的延时。如果 .99 的延迟大于 1 秒,则报警。 | 查看 TiDB 的日志,搜索 SLOW_QUERY 和 TIME_COP_PROCESS 关键字,查找慢 SQL。 |
| 8 | TiDB | Warning | TiDB_server_event_error | increase(tidb_server_event_total{type=~“server_start|server_hang”}[15m]) > 0 | TiDB 服务中发生的事件数量。当出现以下事件的时候会报警: start:TiDB 服务启动。 hang:当发生了 Critical 级别的事件时(目前只有 Binlog 写不进去一种情况),TiDB 进入 hang 模式,并等待人工 Kill。 | 重启 TiDB 以恢复服务。 检查 TiDB Binlog 服务是否正常。 |
| 9 | TiDB | Warning | TiDB_tikvclient_backoff_total | increase(tidb_tikvclient_backoff_total[10m]) > 10 | TiDB 访问 TiKV 发生错误时发起重试的次数。如果在 10 分钟之内重试次数多于 10 次,则报警。 | 查看 TiKV 的监控状态。 |
| 10 | TiDB | Warning | TiDB_monitor_time_jump_back_error | increase(tidb_monitor_time_jump_back_total[10m]) > 0 | 如果 TiDB 所在机器的时间发生了回退,则报警。 | 排查 NTP 配置。 |
| 11 | TiDB | Warning | TiDB_ddl_waiting_jobs | sum(tidb_ddl_waiting_jobs) > 5 | 如果 TiDB 中等待执行的 DDL 任务的数量大于 5,则报警。 | 通过 admin show ddl 语句检查是否有耗时的 add index 操作正在执行 |
| 12 | PD | Emergency | PD_cluster_offline_tikv_nums | (sum ( pd_cluster_status{type=“store_down_count”} ) by (instance) > 0) and (sum(etcd_server_is_leader) by (instance) > 0) | PD 长时间(默认配置是 30 分钟)没有收到 TiKV 心跳。 | 检查 TiKV 进程是否正常、网络是否隔离以及负载是否过高,并尽可能地恢复服务。 如果确定 TiKV 无法恢复,可做下线处理。 |
| 13 | PD | Critical | PD_etcd_write_disk_latency | histogram_quantile(0.99, sum(rate(etcd_disk_wal_fsync_duration_seconds_bucket[1m])) by (instance,job,le)) > 1 | etcd 写盘慢,这很容易引起 PD leader 超时或者 TSO 无法及时存盘等问题,从而导致整个集群停止服务。 | 排查写入慢的原因。可能是由于其他服务导致系统负载过高。可以检查 PD 本身是否占用了大量 CPU 或 IO 资源。 可尝试重启 PD 或手动 transfer leader 至其他的 PD 来恢复服务。 如果由于环境原因无法恢复,可将有问题的 PD 下线替换。 |
| 14 | PD | Critical | PD_miss_peer_region_count | sum(pd_regions_status{type=“miss_peer_region_count”}) > 100 | Region 的副本数小于 max-replicas 配置的值。这通常是由于 TiKV 宕机等问题导致一段时间内一些 Region 缺副本,下线 TiKV 节点也会导致少量 Region 缺副本(对于有 pending peer 的 Region 会走先减后加的流程)。 | 查看是否有 TiKV 宕机或在做下线操作,尝试定位问题产生的原因。 观察 region health 面板,查看 miss_peer_region_count 是否在不断减少。 |
| 15 | PD | Warning | PD_cluster_lost_connect_tikv_nums | sum(pd_cluster_status{type=“store_disconnected_count”}) > 0 | PD 在 20 秒之内未收到 TiKV 上报心跳。正常情况下是每 10 秒收到 1 次心跳 | 排查是否在重启 TiKV。 检查 TiKV 进程是否正常、网络是否隔离以及负载是否过高,并尽可能地恢复服务。 如果确定 TiKV 无法恢复,可做下线处理。 如果确定 TiKV 可以恢复,但在短时间内还无法恢复,可以考虑延长 max-down-time 配置,防止超时后 TiKV 被判定为无法恢复并开始搬移数据。 |
| 16 | PD | Warning | PD_cluster_low_space | sum(pd_cluster_status{type=“store_low_space_count”}) > 0 | 表示 TiKV 节点空间不足。 | 检查集群中的空间是否普遍不足。如果是,则需要扩容。 检查 Region balance 调度是否有问题。如果有问题,会导致数据分布不均衡。 检查是否有文件占用了大量磁盘空间,比如日志、快照、core dump 等文件。 降低该节点的 Region weight 来减少数据量。 无法释放空间时,可以考虑主动下线该节点,防止由于磁盘空间不足而宕机。 |
| 17 | PD | Warning | PD_etcd_network_peer_latency | histogram_quantile(0.99, sum(rate(etcd_network_peer_round_trip_time_seconds_bucket[1m])) by (To,instance,job,le)) > 1 | PD 节点之间网络延迟高,严重情况下会导致 leader 超时和 TSO 存盘超时,从而影响集群服务。 | 检查网络状况和系统负载情况。 如果由于环境原因无法恢复,可将有问题的 PD 下线替换。 |
| 18 | PD | Warning | PD_tidb_handle_requests_duration | histogram_quantile(0.99, sum(rate(pd_client_request_handle_requests_duration_seconds_bucket{type=“tso”}[1m])) by (instance,job,le)) > 0.1 | PD 处理 TSO 请求耗时过长,一般是由于负载过高。 | 检查服务器负载状况。 使用 pprof 抓取 PD 的 CPU profile 进行分析。 手动切换 PD leader。 如果是环境问题,则将有问题的 PD 下线替换。 |
| 19 | PD | Warning | PD_down_peer_region_nums | sum(pd_regions_status{type=“down_peer_region_count”}) > 0 | Raft leader 上报有不响应 peer 的 Region 数量。 | 检查是否有 TiKV 宕机,或刚发生重启,或者繁忙。 观察 region health 面板,检查 down_peer_region_count 是否在不断减少。 检查是否有 TiKV 之间网络不通。 |
| 20 | PD | Warning | PD_pending_peer_region_count | sum(pd_regions_status{type=“pending_peer_region_count”}) > 100 | Raft log 落后的 Region 过多。由于调度产生少量的 pending peer 是正常的,但是如果持续很高,就可能有问题。 | 观察 region health 面板,检查 pending_peer_region_count 是否在不断减少。 检查 TiKV 之间的网络状况,特别是带宽是否足够。 |
| 21 | PD | Warning | PD_leader_change | count(changes(pd_server_tso{type=“save”}[10m]) > 0) >= 2 | 近期发生了 PD leader 切换。 | 排除人为因素,比如重启 PD、手动 transfer leader 或调整 leader 优先级等。 检查网络状况和系统负载情况。 如果由于环境原因无法恢复,可将有问题的 PD 下线替换。 |
| 22 | PD | Warning | TiKV_space_used_more_than_80% | sum(pd_cluster_status{type=“storage_size”}) / sum(pd_cluster_status{type=“storage_capacity”}) * 100 > 80 | 集群空间占用超过 80%。 | 确认是否需要扩容。 排查是否有文件占用了大量磁盘空间,比如日志、快照或 core dump等文件。 |
| 23 | PD | Warning | PD_system_time_slow | changes(pd_server_tso{type=“system_time_slow”}[10m]) >= 1 | 系统时间可能发生回退。 | 检查系统时间设置是否正确。 |
| 24 | PD | Warning | PD_no_store_for_making_replica | increase(pd_checker_event_count{type=“replica_checker”, name=“no_target_store”}[1m]) > 0 | 没有合适的 store 用来补副本 | 检查 store 是否空间不足。 根据 label 配置(如果有这个配置的话)来检查是否有可以补副本的 store。 |
| 25 | TiKV | Emergency | TiKV_memory_used_too_fast | process_resident_memory_bytes{job=~“tikv”,instance=~“.“} - (process_resident_memory_bytes{job=~“tikv”,instance=~”.”} offset 5m) > 510241024*1024 | 目前没有和内存相关的 TiKV 的监控,你可以通过 Node_exporter 监控集群内机器的内存使用情况。如上规则表示,如果在 5 分钟之内内存使用超过 5GB(TiKV 内存占用的太快),则报警。 | 调整 rockdb.defaultcf 和 rocksdb.writecf 的 block-cache-size 的大小。 |
| 26 | TiKV | Emergency | TiKV_GC_can_not_work | sum(increase(tidb_tikvclient_gc_action_result{type=“success”}[6h])) < 1 | 在 6 小时内 Region 上没有成功执行 GC,说明 GC 不能正常工作了。短期内 GC 不运行不会造成太大的影响,但如果 GC 一直不运行,版本会越来越多,从而导致查询变慢。 | 执行 select VARIABLE_VALUE from mysql.tidb where VARIABLE_NAME=“tikv_gc_leader_desc” 来找到 gc leader 对应的 tidb-server; 查看该 tidb-server 的日志,grep gc_worker tidb.log; 如果发现这段时间一直在 resolve locks(最后一条日志是 start resolve locks)或者 delete ranges(最后一条日志是 start delete {number} ranges),说明 GC 进程是正常的。否则需要报备开发人员 support@pingcap.com 进行处理。 |
| 27 | TiKV | Critical | TiKV_server_report_failure_msg_total | sum(rate(tikv_server_report_failure_msg_total{type=“unreachable”}[10m])) BY (store_id) > 10 | 表明无法连接远端的 TiKV。 | 检查网络是否通畅。 检查远端 TiKV 是否挂掉。 如果远端 TiKV 没有挂掉,检查压力是否太大,参考 TiKV_channel_full_total 处理方法。 |
| 28 | TiKV | Critical | TiKV_channel_full_total | sum(rate(tikv_channel_full_total[10m])) BY (type, instance) > 0 | 该错误通常是因为 Raftstore 线程卡死,TiKV 的压力已经非常大了。 | 观察 Raft Propose 监控,看这个报警的 TiKV 节点是否明显有比其他 TiKV 高很多。如果是,表明这个 TiKV 上有热点,需要检查热点调度是否能正常工作。 观察 Raft IO 监控,看延迟是否升高。如果延迟很高,表明磁盘可能有瓶颈。一个能缓解但不怎么安全的办法是将 sync-log 改成 false。 观察 Raft Process 监控,看 tick duration 是否很高。如果是,需要在 [raftstore] 配置下加上 raft-base-tick-interval = “2s”。 |
| 29 | TiKV | Critical | TiKV_write_stall | delta(tikv_engine_write_stall[10m]) > 0 | RocksDB 写入压力太大,出现了 stall。 | 观察磁盘监控,排除磁盘问题。 看 TiKV 是否有写入热点。 在 [rocksdb] 和 [raftdb] 配置下调大 max-sub-compactions 的值。 |
| 30 | TiKV | Critical | TiKV_raft_log_lag | histogram_quantile(0.99, sum(rate(tikv_raftstore_log_lag_bucket[1m])) by (le, instance)) > 5000 | 这个值偏大,表明 Follower 已经远远落后于 Leader,Raft 没法正常同步了。可能的原因是 Follower 所在的 TiKV 卡住或者挂掉了。 | |
| 31 | TiKV | Critical | TiKV_async_request_snapshot_duration_seconds | histogram_quantile(0.99, sum(rate(tikv_storage_engine_async_request_duration_seconds_bucket{type=“snapshot”}[1m])) by (le, instance, type)) > 1 | 这个值偏大,表明 Raftstore 负载压力很大,可能已经卡住。 | 观察 Raft Propose 监控,看这个报警的 TiKV 节点是否明显有比其他 TiKV 高很多。如果是,表明这个 TiKV 上有热点,需要检查热点调度是否能正常工作。 观察 Raft IO 监控,看延迟是否升高。如果延迟很高,表明磁盘可能有瓶颈。一个能缓解但不怎么安全的办法是将 sync-log 改成 false。 观察 Raft Process 监控,看 tick duration 是否很高。如果是,需要在 [raftstore] 配置下加上 raft-base-tick-interval = “2s”。 |
| 32 | TiKV | Critical | TiKV_async_request_write_duration_seconds | histogram_quantile(0.99, sum(rate(tikv_storage_engine_async_request_duration_seconds_bucket{type=“write”}[1m])) by (le, instance, type)) > 1 | 这个值偏大,表明 Raft write 耗时很长。 | 检查 Raftstore 上的压力,参考 TiKV_channel_full_total 的处理方法。 检查 apply worker 线程的压力。 |
| 33 | TiKV | Critical | TiKV_coprocessor_request_wait_seconds | histogram_quantile(0.9999, sum(rate(tikv_coprocessor_request_wait_seconds_bucket[1m])) by (le, instance, req)) > 10 | 这个值偏大,表明 Coprocessor worker 压力很大。可能有比较慢的任务卡住了 Coprocessor 线程。 | 从 TiDB 日志中查看慢查询日志,看查询是否用到了索引或全表扫,或者看是否需要做 analyze。 排查是否有热点。 查看 Coprocessor 监控,看 coporcessor table/index scan 里 total 和 process 是否匹配。如果相差太大,表明做了太多的无效查询。看是否有 over seek bound,如果有,表明版本太多,GC 工作不及时,需要增大并行 GC 的线程数。 |
| 34 | TiKV | Critical | TiKV_raftstore_thread_cpu_seconds_total | sum(rate(tikv_thread_cpu_seconds_total{name=~“raftstore_.*”}[1m])) by (instance, name) > 1.6 | Raftstore 线程压力太大。 | 观察 Raft Propose 监控,看这个报警的 TiKV 节点是否明显有比其他 TiKV 高很多。如果是,表明这个 TiKV 上有热点,需要检查热点调度是否能正常工作。 观察 Raft IO 监控,看延迟是否升高。如果延迟很高,表明磁盘可能有瓶颈。一个能缓解但不怎么安全的办法是将 sync-log 改成 false。 观察 Raft Process 监控,看 tick duration 是否很高。如果是,需要在 [raftstore] 配置下加上 raft-base-tick-interval = “2s”。 |
| 35 | TiKV | Critical | TiKV_raft_append_log_duration_secs | histogram_quantile(0.99, sum(rate(tikv_raftstore_append_log_duration_seconds_bucket[1m])) by (le, instance)) > 1 | 表示 append Raft log 的耗时,如果高,通常是因为 IO 太忙了。 | |
| 36 | TiKV | Critical | TiKV_raft_apply_log_duration_secs | histogram_quantile(0.99, sum(rate(tikv_raftstore_apply_log_duration_seconds_bucket[1m])) by (le, instance)) > 1 | 表示 apply Raft log 耗时,如果高,通常是因为 IO 太忙了。 | |
| 37 | TiKV | Critical | TiKV_scheduler_latch_wait_duration_seconds | histogram_quantile(0.99, sum(rate(tikv_scheduler_latch_wait_duration_seconds_bucket[1m])) by (le, instance, type)) > 1 | Scheduler 中写操作获取内存锁时的等待时间。如果这个值高,表明写操作冲突较多,也可能是某些引起冲突的操作耗时较长,阻塞了其它等待相同锁的操作。 | 查看 Scheduler-All 监控中的 scheduler command duration,看哪一个命令耗时最大。 查看 Scheduler-All 监控中的 scheduler scan details,看 total 和 process 是否匹配。如果相差太大,表明有很多无效的扫描,另外观察是否有 over seek bound,如果太多,表明 GC 不及时。 查看 Storage 监控中的 storage async snapshot/write duration,看是否 Raft 操作不及时。 |
| 38 | TiKV | Critical | TiKV_thread_apply_worker_cpu_seconds | sum(rate(tikv_thread_cpu_seconds_total{name=“apply_worker”}[1m])) by (instance) > 1.8 | Apply Raft log 线程压力太大,通常是因为写入太猛了。 | |
| 39 | TiKV | Critical | TiDB_tikvclient_gc_action_fail | sum(increase(tidb_tikvclient_gc_action_result{type="fail”}[1m])) > 10 | GC 失败的 Region 较多。 | 一般是因为并行 GC 开的太高了,可以适当降低 GC 并行度。你需要先确认 GC 失败是由于服务器繁忙导致的。 通过执行 update set VARIABLE_VALUE=”{number}” where VARIABLE_NAME=”tikv_gc_concurrency” 适当降低并行度。 |
| 40 | TiKV | Warning | TiKV_leader_drops | delta(tikv_pd_heartbeat_tick_total{type=“leader”}[30s]) < -10 | 该问题通常是因为 Raftstore 线程卡住了。 | 参考 TiKV_channel_full_total 的处理方法。 如果 TiKV 压力很小,考虑 PD 的调度是否太频繁。可以查看 PD 页面的 Operator Create 面板,排查 PD 产生调度的类型和数量。 |
| 41 | TiKV | Warning | TiKV_raft_process_ready_duration_secs | histogram_quantile(0.999, sum(rate(tikv_raftstore_raft_process_duration_secs_bucket{type=‘ready’}[1m])) by (le, instance, type)) > 2 | 表示处理 Raft ready 的耗时。这个值大,通常是因为 append log 任务卡住了。 | |
| 42 | TiKV | Warning | TiKV_raft_process_tick_duration_secs | histogram_quantile(0.999, sum(rate(tikv_raftstore_raft_process_duration_secs_bucket{type=’tick’}[1m])) by (le, instance, type)) > 2 | 表示处理 Raft tick 的耗时,这个值大,通常是因为 Region 太多导致的。 | 考虑使用更高等级的日志,比如 warn 或者 error。 在 [raftstore] 配置下添加 raft-base-tick-interval = “2s”。 |
| 43 | TiKV | Warning | TiKV_scheduler_context_total | abs(delta( tikv_scheduler_context_total[5m])) > 1000 | Scheduler 正在执行的写命令数量。这个值高,表示任务完成得不及时。 | 查看 Scheduler-All 监控中的 scheduler command duration,看哪一个命令耗时最大。 查看 Scheduler-All 监控中的 scheduler scan details,看 total 和 process 是否匹配。如果相差太大,表明有很多无效的扫描,另外观察是否有 over seek bound,如果太多,表明 GC 不及时。 查看 Storage 监控中的 storage async snapshot/write duration,看是否 Raft 操作不及时。 |
| 44 | TiKV | Warning | TiKV_scheduler_command_duration_seconds | histogram_quantile(0.99, sum(rate(tikv_scheduler_command_duration_seconds_bucket[1m])) by (le, instance, type) / 1000) > 1 | 表明 Scheduler 执行命令的耗时。 | 查看 Scheduler-All 监控中的 scheduler command duration,看哪一个命令耗时最大。 查看 Scheduler-All 监控中的 scheduler scan details,看 total 和 process 是否匹配。如果相差太大,表明有很多无效的扫描,另外观察是否有 over seek bound,如果太多,表明 GC 不及时。 查看 Storage 监控中的 storage async snapshot/write duration,看是否 Raft 操作不及时。 |
| 45 | TiKV | Warning | TiKV_coprocessor_outdated_request_wait_seconds | delta(tikv_coprocessor_outdated_request_wait_seconds_count[10m]) > 0 | Coprocessor 已经过期的请求等待的时间。这个值高,表示 Coprocessor 压力已经非常大了。 | 查看 Scheduler-All 监控中的 scheduler command duration,看哪一个命令耗时最大。 查看 Scheduler-All 监控中的 scheduler scan details,看 total 和 process 是否匹配。如果相差太大,表明有很多无效的扫描,另外观察是否有 over seek bound,如果太多,表明 GC 不及时。 查看 Storage 监控中的 storage async snapshot/write duration,看是否 Raft 操作不及时。 |
| 46 | TiKV | Warning | TiKV_coprocessor_request_error | increase(tikv_coprocessor_request_error{reason!=“lock”}[10m]) > 100 | Coprocessor 的请求错误。 | Coprocessor 错误的主要原因分为“lock”、“outdated”和“full”等。“outdated”表示请求超时,很可能是由于排队时间过久,或者单个请求的耗时比较长。“full”表示 Coprocessor 的请求队列已经满了,可能是正在执行的请求比较耗时,导致新来的请求都在排队。耗时比较长的查询需要查看下对应的执行计划是否正确。 |
| 47 | TiKV | Warning | TiKV_coprocessor_request_lock_error | increase(tikv_coprocessor_request_error{reason=“lock”}[10m]) > 10000 | Coprocessor 请求锁的错误 | Coprocessor 错误的主要原因分为“lock”、“outdated”、“full”等。“lock”表示读到的数据正在写入,需要等待一会再读(TiDB 内部会自动重试)。少量这种错误不用关注,如果有大量这种错误,需要查看写入和查询是否有冲突。 |
| 48 | TiKV | Warning | TiKV_coprocessor_pending_request | delta(tikv_coprocessor_pending_request[10m]) > 5000 | Coprocessor 排队的请求。 | 从 TiDB 日志中查看慢查询日志,看查询是否用到了索引或全表扫,或者看是否需要做 analyze。 排查是否有热点。 查看 Coprocessor 监控,看 coporcessor table/index scan 里 total 和 process 是否匹配。如果相差太大,表明做了太多的无效查询。看是否有 over seek bound,如果有,表明版本太多,GC 工作不及时,需要增大并行 GC 的线程数。 |
| 49 | TiKV | Warning | TiKV_batch_request_snapshot_nums | sum(rate(tikv_thread_cpu_seconds_total{name=~“cop_."}[1m])) by (instance) / (count(tikv_thread_cpu_seconds_total{name=~"cop_.”}) * 0.9) / count(count(tikv_thread_cpu_seconds_total) by (instance)) > 0 | 某个 TiKV 的 Coprocessor CPU 使用率超过了 90%。 | |
| 50 | TiKV | Warning | TiKV_pending_task | sum(tikv_worker_pending_task_total) BY (instance,name) > 1000 | TiKV 等待的任务数量。 | 查看是哪一类任务的值偏高,通常 Coprocessor、apply worker 这类任务都可以在其他指标里找到解决办法。 |
| 51 | TiKV | Warning | TiKV_low_space_and_add_region | count((sum(tikv_store_size_bytes{type=“available”}) by (instance) / sum(tikv_store_size_bytes{type=“capacity”}) by (instance) < 0.2) and (sum(tikv_raftstore_snapshot_traffic_total{type=“applying”}) by (instance) > 0)) > 0 | ||
| 52 | TiKV | Warning | TiKV_approximate_region_size | histogram_quantile(0.99, sum(rate(tikv_raftstore_region_size_bucket[1m])) by (le)) > 1073741824 | TiKV split checker 扫描到的最大的 Region approximate size 在 1 分钟内持续大于 1 GB。 | Region 分裂的速度不及写入的速度。为缓解这种情况,建议更新到支持 batch-split 的版本 (>= 2.1.0-rc1)。如暂时无法更新,可以使用 pd-ctl operator add split-region <region_id> --policy=approximate 手动分裂 Region。 |
| 53 | TiDB Binlog | Emergency | binlog_pump_storage_error_count | changes(binlog_pump_storage_error_count[1m]) > 0 | Pump 写 binlog 到本地存储时失败。 | 确认 pump_storage_error 监控是否存在错误,查看 Pump 日志确认原因。 |
| 54 | TiDB Binlog | Critical | binlog_drainer_checkpoint_high_delay | (time() - binlog_drainer_checkpoint_tso / 1000) > 3600 | Drainer 同步落后延迟超过 1 个小时。 | 判断从 Pump 获取数据是否太慢: 监控 Pump handle tso 可以看每个 Pump 最近一条消息的时间,是不是有延迟特别大的 Pump,确认对应 Pump 正常运行。 根据 Drainer event 和 Drainer execute latency 来判断是否下游同步太慢: 如果 Drainer execute time 过大,则检查到目标库网络带宽和延迟,以及目标库状态。 如果 Drainer execute time 不大,Drainer event 过小,则增加 work count 和 batch 进行重试。 如果上面都不满足或者操作后没有改观,则报备开发人员 support@pingcap.com 进行处理。 |
| 55 | TiDB Binlog | Warning | binlog_pump_write_binlog_rpc_duration_seconds_bucket | histogram_quantile(0.9, rate(binlog_pump_rpc_duration_seconds_bucket{method=“WriteBinlog”}[5m])) > 1 | Pump 处理 TiDB 写 Binlog 请求耗时过大。 | 确认磁盘性能压力,通过 node exported 查看 disk performance 监控。 如果 disk latency 和 util 都很低,那么报备开发人员 support@pingcap.com 进行处理。 |
| 56 | TiDB Binlog | Warning | binlog_pump_storage_write_binlog_duration_time_bucket | histogram_quantile(0.9, rate(binlog_pump_storage_write_binlog_duration_time_bucket{type=“batch”}[5m])) > 1 | Pump 写本地 binlog 到本地盘的耗时。 | 确认 Pump 本地盘情况,进行修复。 |
| 57 | TiDB Binlog | Warning | binlog_pump_storage_available_size_less_than_20G | binlog_pump_storage_storage_size_bytes{type=“available”} < 20 * 1024 * 1024 * 1024 | Pump 剩余可用磁盘空间不足 20 G。 | 监控确认 Pump 的 gc_tso 是否正常。如果不正常,调整 Pump 的 GC 时间配置或者下线对应 Pump。 |
| 58 | TiDB Binlog | Warning | binlog_drainer_checkpoint_tso_no_change_for_1m | changes(binlog_drainer_checkpoint_tso[1m]) < 1 | Drainer 的 checkpoint 在 1 分钟内没有更新。 | 确认所有非下线的 Pump 是否正常运行。 |
| 59 | TiDB Binlog | Warning | binlog_drainer_execute_duration_time_more_than_10s | histogram_quantile(0.9, rate(binlog_drainer_execute_duration_time_bucket[1m])) > 10 | Drainer 同步到 TiDB 的事务耗时。如果这个值过大,会影响 Drainer 同步。 | 查看 TiDB 集群的状态。 查看 Drainer 日志或监控,如果是 DDL 操作导致了该问题,则忽略。 |
| 60 | Node_exporter | Emergency | NODE_disk_used_more_than_80% | node_filesystem_avail{fstype=~“(ext.|xfs)”, mountpoint!~“/boot”} / node_filesystem_size{fstype=~“(ext.|xfs)”, mountpoint!~“/boot”} * 100 <= 20 | 机器磁盘空间使用率超过 80%。 | 登录机器,执行 df -h 命令,查看磁盘空间使用率,做好扩容计划。 |
| 61 | Node_exporter | Emergency | NODE_disk_inode_more_than_80% | node_filesystem_files_free{fstype=~“(ext.|xfs)”} / node_filesystem_files{fstype=~“(ext.|xfs)”} * 100 < 20 | 机器磁盘挂载目录文件系统 inode 使用率超过 80%。 | 登录机器,执行 df -i 命令,查看磁盘挂载目录文件系统 inode 使用率,做好扩容计划。 |
| 62 | Node_exporter | Emergency | NODE_disk_readonly | node_filesystem_readonly{fstype=~“(ext.|xfs)”} == 1 | 磁盘挂载目录文件系统只读,无法写入数据,一般是因为磁盘故障或文件系统损坏。 | 登录机器创建文件测试是否正常。 检查该服务器硬盘指示灯是否正常,如异常,需更换磁盘并修复该机器文件系统。 |
| 63 | Node_exporter | Critical | NODE_memory_used_more_than_80% | (((node_memory_MemTotal-node_memory_MemFree-node_memory_Cached)/(node_memory_MemTotal)*100)) >= 80 | 机器内存使用率超过 80%。 | 在 Grafana Node Exporter 页面查看该主机的 Memory 面板,检查 Used 是否过高,Available 内存是否过低。 登录机器,执行 free -m 命令查看内存使用情况,执行 top 看是否有异常进程的内存使用率过高。 |
| 64 | Node_exporter | Warning | NODE_node_overload | (node_load5 / count without (cpu, mode) (node_cpu{mode=“system”})) > 1 | 机器 CPU 负载较高。 | 在 Grafana Node exporter 页面上查看该主机的 CPU Usage 及 Load Average,检查是否过高。 登录机器,执行 top 查看 load average 及 CPU 使用率,看是否是异常进程的 CPU 使用率过高。 |
| 65 | Node_exporter | Warning | NODE_cpu_used_more_than_80% | avg(irate(node_cpu{mode=“idle”}[5m])) by(instance) * 100 <= 20 | 机器 CPU 使用率超过 80%。 | 在 Grafana Node exporter 页面上查看该主机的 CPU Usage 及 Load Average,检查是否过高。 登录机器,执行 top 查看 load average 及 CPU 使用率,看是否是异常进程的 CPU 使用率过高。 |
| 66 | Node_exporter | Warning | NODE_tcp_estab_num_more_than_50000 | node_netstat_Tcp_CurrEstab > 50000 | 机器 establish 状态的 TCP 链接超过 50,000。 | 登录机器执行 ss -s 可查看当前系统 estab 状态的 TCP 链接数,执行 netstat 查看是否有异常链接。 |
| 67 | Node_exporter | Warning | NODE_disk_read_latency_more_than_32ms | ((rate(node_disk_read_time_ms{device=~“.+”}[5m]) / rate(node_disk_reads_completed{device=~“.+”}[5m])) or (irate(node_disk_read_time_ms{device=~“.+”}[5m]) / irate(node_disk_reads_completed{device=~“.+”}[5m]))) > 32 | 磁盘读延迟超过 32 毫秒。 | 查看 Grafana Disk Performance Dashboard 观察磁盘使用情况。 查看 Disk Latency 面板观察磁盘的读延迟。 查看 Disk IO Utilization 面板观察 IO 使用率。 |
| 68 | Node_exporter | Warning | NODE_disk_write_latency_more_than_16ms | ((rate(node_disk_write_time_ms{device=~“.+”}[5m]) / rate(node_disk_writes_completed{device=~“.+”}[5m])) or (irate(node_disk_write_time_ms{device=~“.+”}[5m]) / irate(node_disk_writes_completed{device=~“.+”}[5m])))> 16 | 机器磁盘写延迟超过 16 毫秒。 | 查看 Grafana Disk Performance Dashboard 观察磁盘使用情况。 查看 Disk Latency 面板可查看磁盘的写延迟。 查看 Disk IO Utilization 面板可查看 IO 使用率。 |
| 69 | Blackbox_exporter TCP、ICMP 和 HTTP | Emergency | TiDB_server_is_down | probe_success{group=“tidb”} == 0 | TiDB 服务端口探测失败。 | 检查 TiDB 服务所在机器是否宕机。 检查 TiDB 进程是否存在。 检查监控机与 TiDB 服务所在机器之间网络是否正常。 |
| 70 | Blackbox_exporter TCP、ICMP 和 HTTP | Emergency | Pump_server_is_down | probe_success{group=“pump”} == 0 | Pump 服务端口探测失败。 | 检查 Pump 服务所在机器是否宕机。 检查 Pump 进程是否存在。 检查监控机与 Pump 服务所在机器之间网络是否正常。 |
| 71 | Blackbox_exporter TCP、ICMP 和 HTTP | Emergency | Drainer_server_is_down | probe_success{group=“drainer”} == 0 | Drainer 服务端口探测失败。 | 检查 Drainer 服务所在机器是否宕机。 检查 Drainer 进程是否存在。 检查监控机与 Drainer 服务所在机器之间网络是否正常。 |
| 72 | Blackbox_exporter TCP、ICMP 和 HTTP | Emergency | TiKV_server_is_down | probe_success{group=“tikv”} == 0 | TiKV 服务端口探测失败。 | 检查 TiKV 服务所在机器是否宕机。 检查 TiKV 进程是否存在。 检查监控机与 TiKV 服务所在机器之间网络是否正常。 |
| 73 | Blackbox_exporter TCP、ICMP 和 HTTP | Emergency | PD_server_is_down | probe_success{group=“pd”} == 0 | PD 服务端口探测失败。 | 检查 PD 服务所在机器是否宕机。 检查 PD 进程是否存在。 检查监控机与 PD 服务所在机器之间网络是否正常。 |
| 74 | Blackbox_exporter TCP、ICMP 和 HTTP | Emergency | Node_exporter_server_is_down | probe_success{group=“node_exporter”} == 0 | Node_exporter 服务端口探测失败。 | 检查 Node_exporter 服务所在机器是否宕机。 检查 Node_exporter 进程是否存在。 检查监控机与 Node_exporter 服务所在机器之间网络是否正常。 |
| 75 | Blackbox_exporter TCP、ICMP 和 HTTP | Emergency | Blackbox_exporter_server_is_downGrafana_server_is_down | probe_success{group=“blackbox_exporter”} == 0 | Blackbox_exporter 服务端口探测失败。 | 检查 Blackbox_exporter 服务所在机器是否宕机。 检查 Blackbox_exporter 进程是否存在。 检查监控机与 Blackbox_exporter 服务所在机器之间网络是否正常。 |
| 76 | Blackbox_exporter TCP、ICMP 和 HTTP | Emergency | Grafana_server_is_down | probe_success{group=“grafana”} == 0 | Grafana 服务端口探测失败。 | 检查 Grafana 服务所在机器是否宕机。 检查 Grafana 进程是否存在。 检查监控机与 Grafana 服务所在机器之间网络是否正常。 |
| 77 | Blackbox_exporter TCP、ICMP 和 HTTP | Emergency | Pushgateway_server_is_down | probe_success{group=“pushgateway”} == 0 | Pushgateway 服务端口探测失败。 | 检查 Pushgateway 服务所在机器是否宕机。 检查 Pushgateway 进程是否存在。 检查监控机与 Pushgateway 服务所在机器之间网络是否正常。 |
| 78 | Blackbox_exporter TCP、ICMP 和 HTTP | Emergency | Kafka_exporter_is_down | probe_success{group=“kafka_exporter”} == 0 | Kafka_exporter 服务端口探测失败。 | 检查 Kafka_exporter 服务所在机器是否宕机。 检查 Kafka_exporter 进程是否存在。 检查监控机与 Kafka_exporter 服务所在机器之间网络是否正常。 |
| 79 | Blackbox_exporter TCP、ICMP 和 HTTP | Emergency | Pushgateway_metrics_interface | probe_success{job=“blackbox_exporter_http”} == 0 | Pushgateway 服务 http 接口探测失败。 | 检查 Pushgateway 服务所在机器是否宕机。 检查 Pushgateway 进程是否存在。 检查监控机与 Pushgateway 服务所在机器之间网络是否正常。 |
| 80 | Blackbox_exporter TCP、ICMP 和 HTTP | Warning | BLACKER_ping_latency_more_than_1s | max_over_time(probe_duration_seconds{job=~“blackbox_exporter.*_icmp”}[1m]) > 1 | Ping 延迟超过 1 秒。 | 在 Grafana Blackbox Exporter dashboard 上检查两个节点间的 ping 延迟是否太高。 在 Grafana Blackbox Exporter dashboard 的 tcp 面板上检查是否有丢包。 |
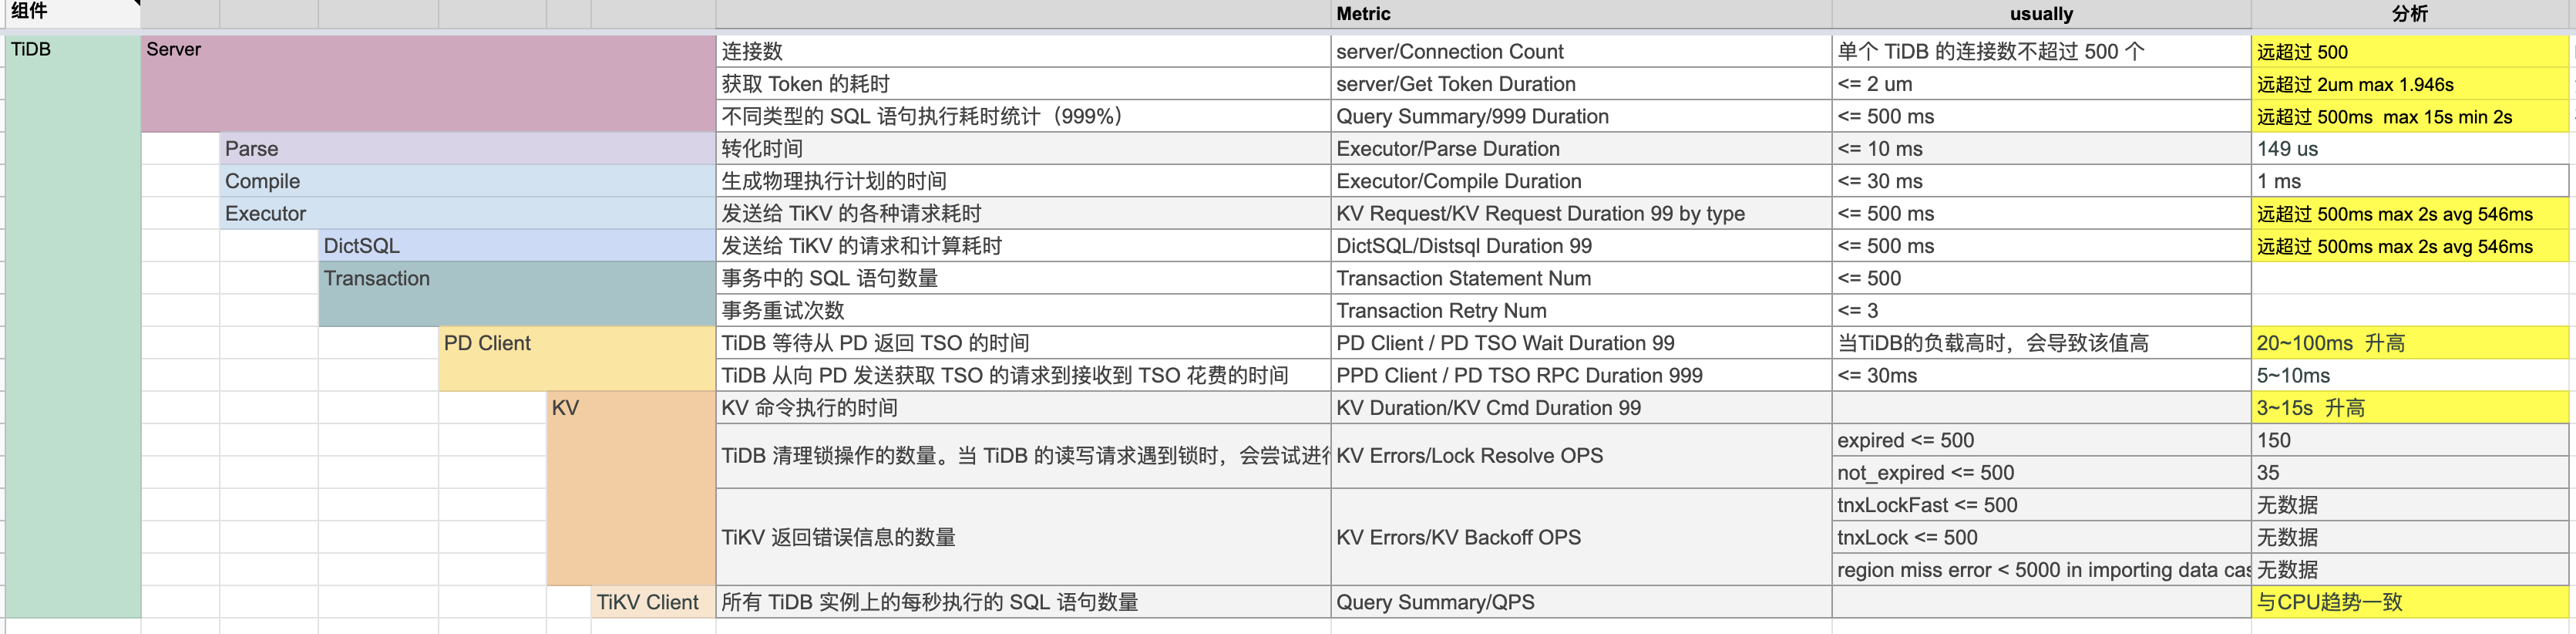
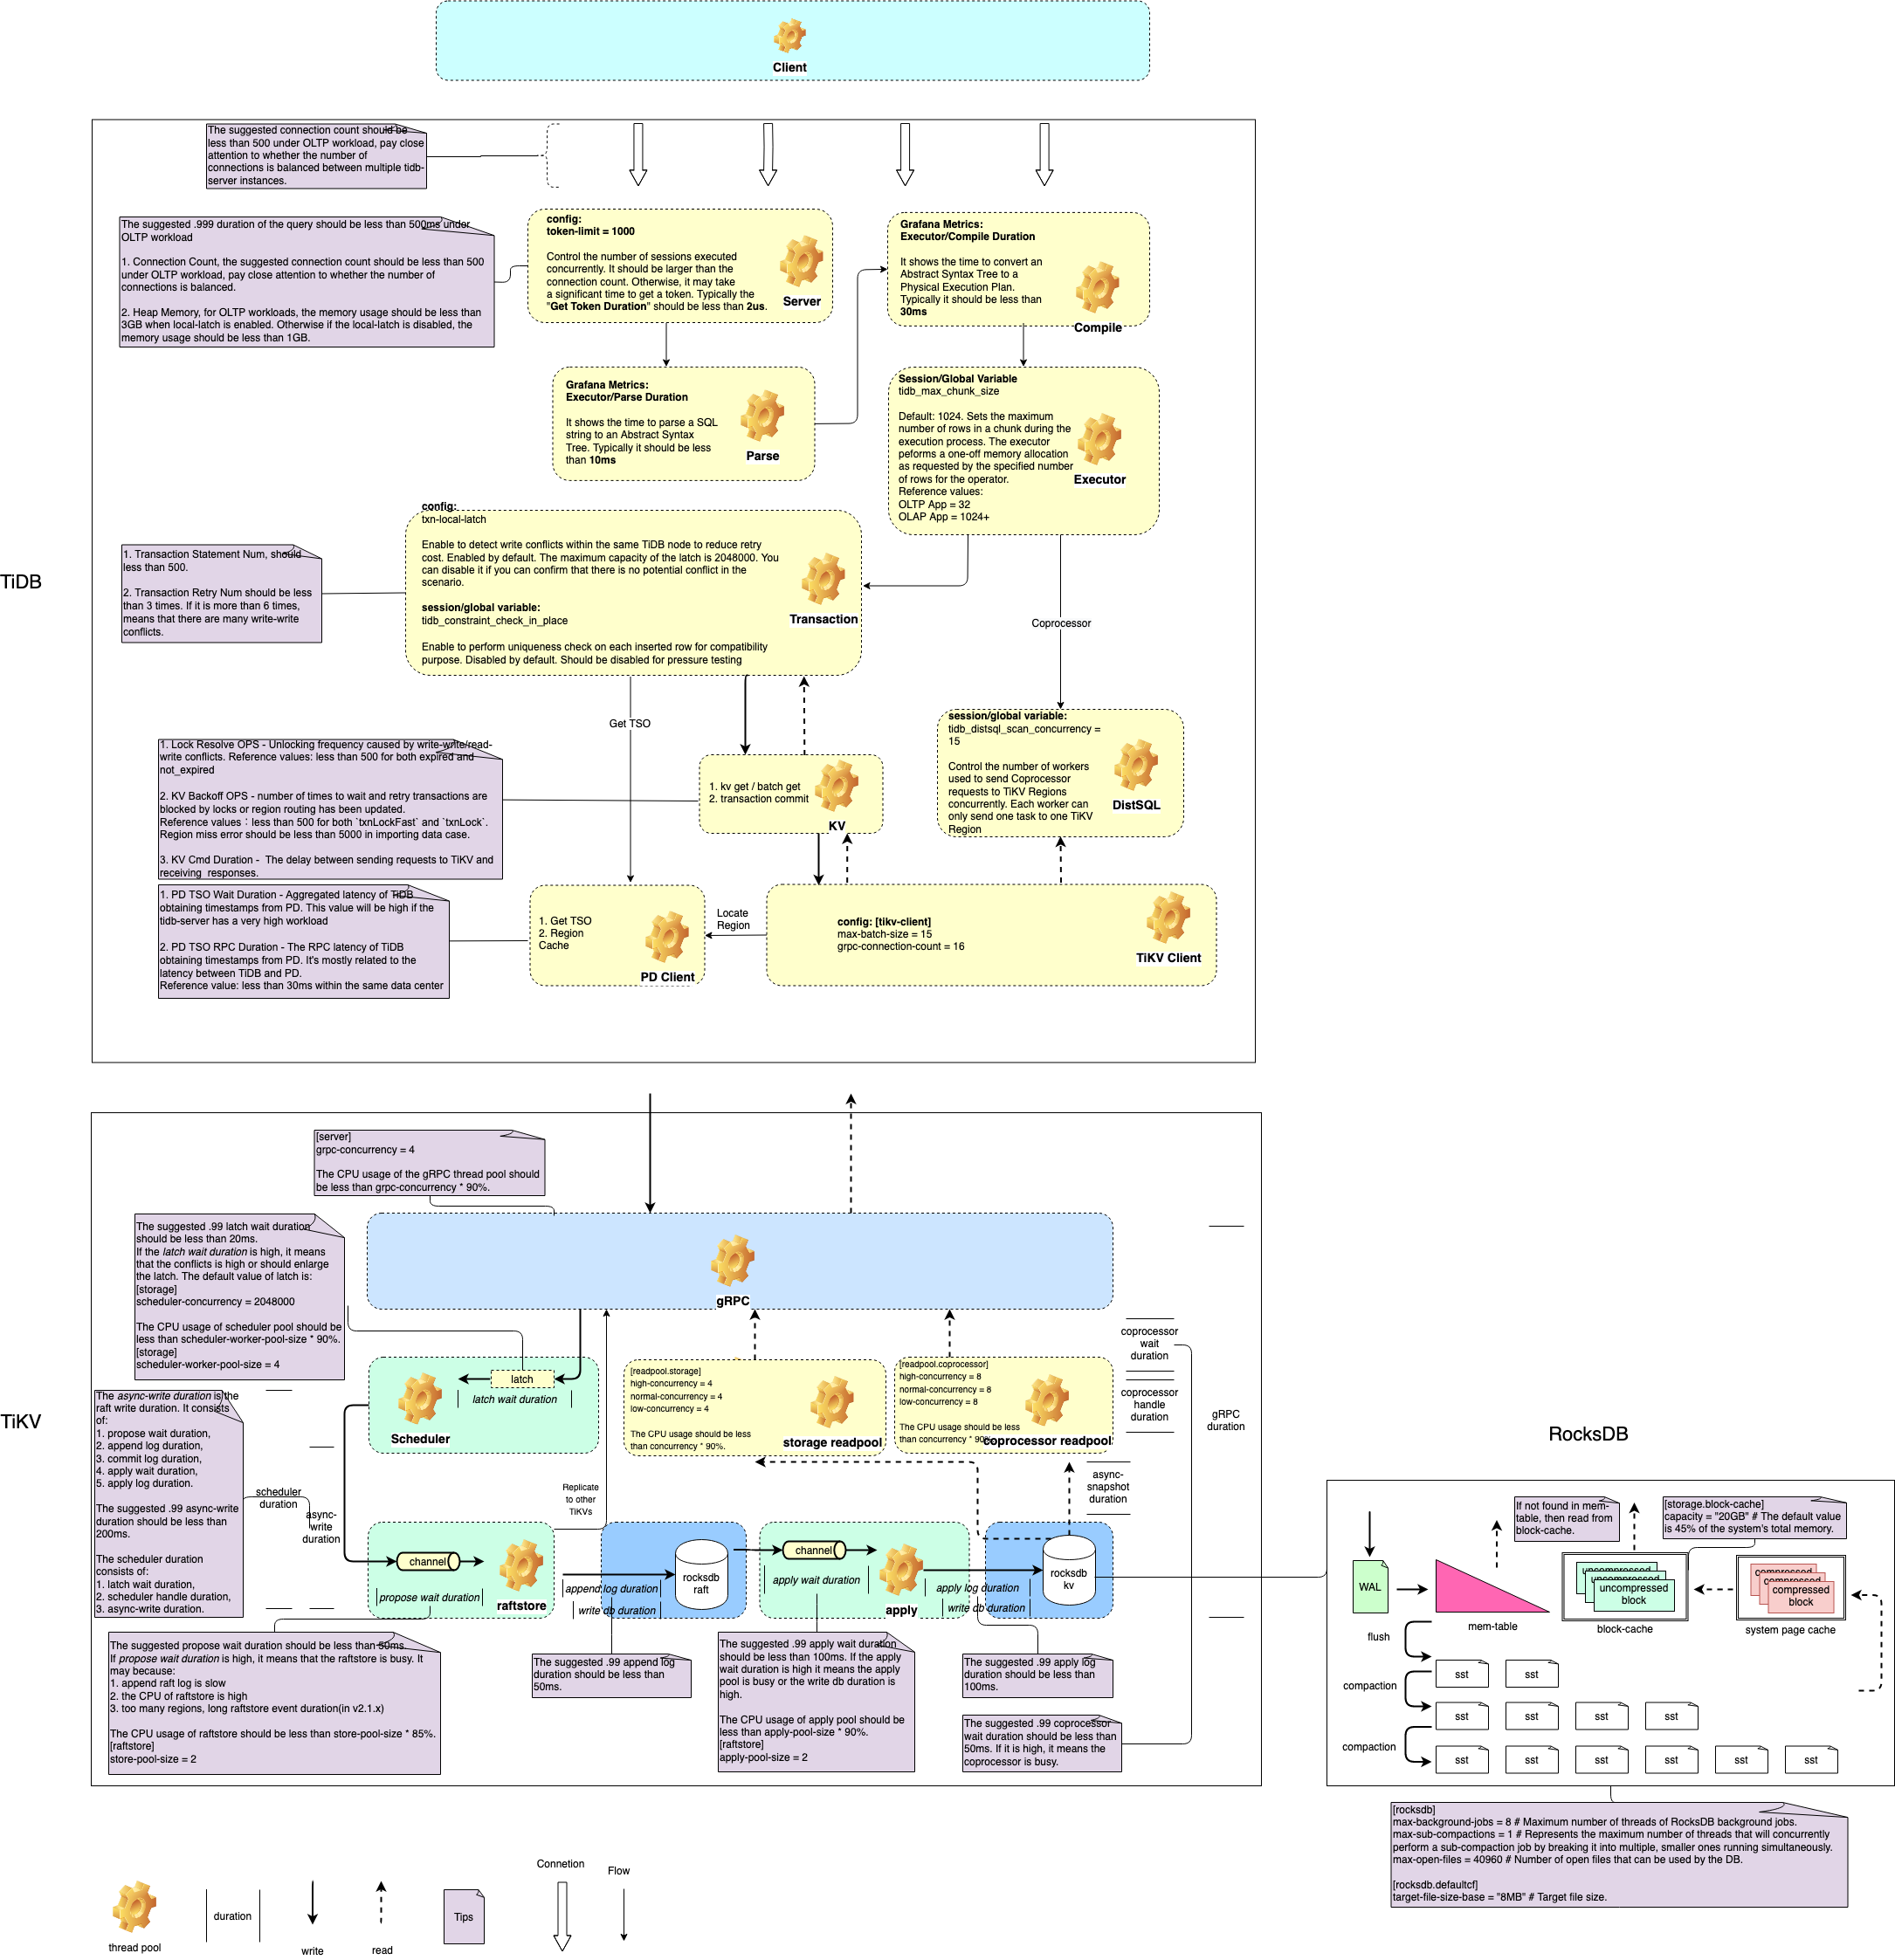
根据TiDB性能图解读生产重要指标
TiDB
学习过程中遇到的问题或延伸思考:
- 衍生思考:要能够看懂监控,还是要回到理解体系结构本身,由于TiDB 的架构非常复杂,因此监控指标也是非常多。如果能将性能图动态展示,会将性能监控和调优做到更自动化。
学习过程中参考的其他资料
| TiDB 读写流程相关监控原理解析 | 4.2 TiDB 读写流程相关监控原理解析 · TiDB in Action |
|---|---|
| Overview 面板重要监控指标详解 | https://docs.pingcap.com/zh/tidb/stable/grafana-overview-dashboard |
| TiDB 高并发写入场景最佳实践 | https://docs.pingcap.com/zh/tidb/stable/high-concurrency-best-practices#%E5%8F%82%E6%95%B0%E9%85%8D%E7%BD%AE |
| TiDB集群大规模删除实践 | https://asktug.com/t/topic/36767 |
| 性能图 | https://book.tidb.io/res/session3/chapter4/performance-map/performance-map.png |
| RocksDB-阻写 | RocksDB-阻写 - 简书 |
| TiDB 集群报警规则 | https://docs.pingcap.com/zh/tidb/stable/alert-rules#tidb_query_duration |
| 官方版本TIDBv4.0.2告警规则托管仓库 | tidb-ansible/roles/prometheus/files at 3365381314949cfef9324b5b4664432443bb652b · pingcap/tidb-ansible · GitHub |
| TiDB 磁盘 I/O 过高的处理办法 | https://docs.pingcap.com/zh/tidb/stable/troubleshoot-high-disk-io |
| PD 调度策略最佳实践 | https://docs.pingcap.com/zh/tidb/stable/pd-scheduling-best-practices |
| 读写延迟增加 | https://docs.pingcap.com/zh/tidb/stable/troubleshoot-cpu-issues |
| TiDB 内置了一些诊断规则,用于检测系统中的故障以及隐患。 | https://docs.pingcap.com/zh/tidb/stable/information-schema-inspection-result |