LockNotFound和txnNotFound

【版本】v5.2.3, 15 tikv 普通ssd盘
【问题】
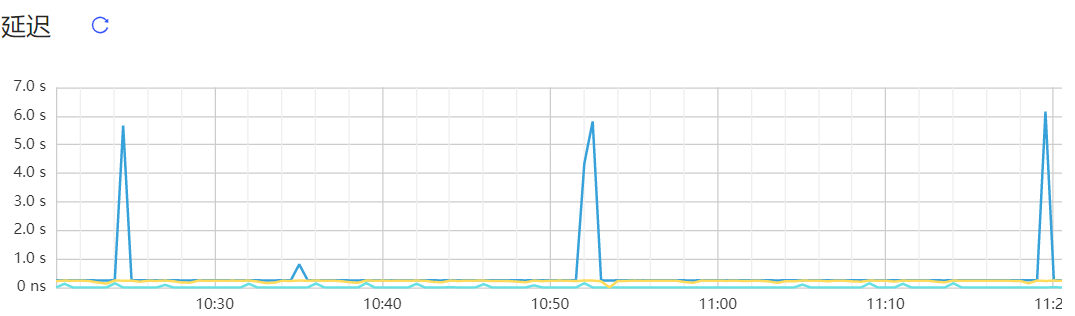
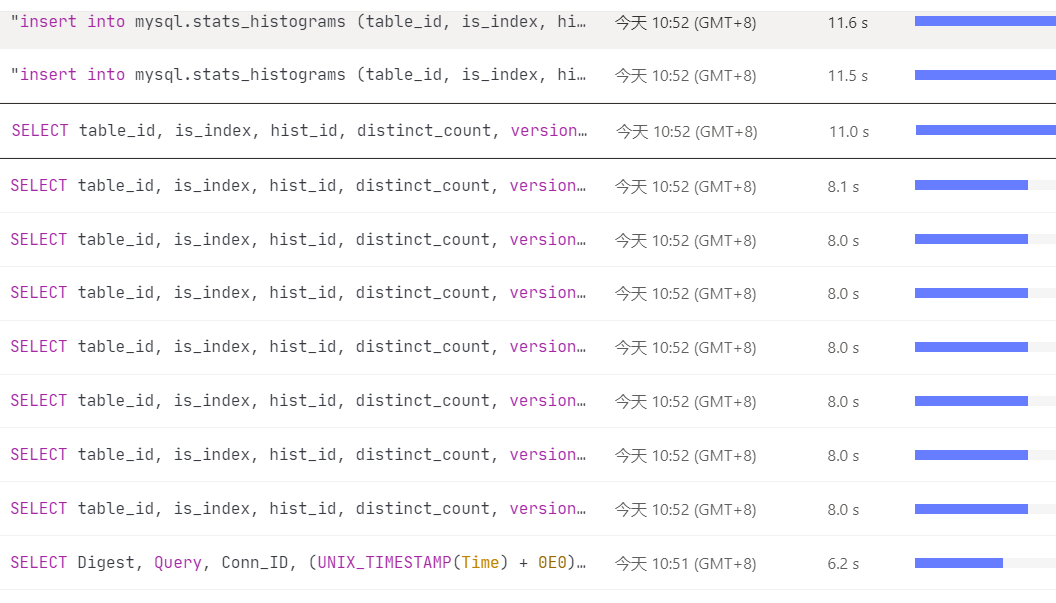
tidb duration出现不规律的突增情况,检查慢SQL发现都是stats_histograms的insert/select语句造成


insert的执行计划

insert into mysql.stats_histograms (table_id, is_index, hist_id, distinct_count, tot_col_size) values (24270, 0, 120, 0, 9269),(24270, 0, 155, 0, 55614),(24270, 0, 132, 0, 9269),(24270, 0, 157, 0, 9269),(24270, 0, 28, 0, 37076).............
id      	task	estRows	operator info	actRows	execution info                                                                                                                                                                                                                                                                                                                                                             	memory 	disk
Insert_1	root	0      	N/A          	0      	time:28.6ms, loops:2, prepare:1.05ms, check_insert: {total_time: 27.5ms, mem_insert_time: 13.4ms, prefetch: 14.1ms, rpc:{BatchGet:{num_rpc:74, total_time:83.4ms},ResolveLock:{num_rpc:20, total_time:41.5ms}}}, commit_txn: {prewrite:11.5s, backoff: {time: 11.5s, type: [txnLock]}, resolve_lock: 1.57s, region_num:25, write_keys:167, write_byte:3453793, txn_retry:1}	3.44 MB	N/A

select的执行计划
select table_id, is_index, hist_id, distinct_count, version, null_count, tot_col_size, stats_ver, flag, correlation, last_analyze_pos from mysql.stats_histograms where table_id = 24270;

id                  	task     	estRows	operator info                                                                                                                                                                                                                                                                                                                                                                              	actRows	execution info                                                                                                                                                                                                                                                                                                                                                                                                                                                                                                                        	memory 	disk
Projection_4        	root     	11     	mysql.stats_histograms.table_id, mysql.stats_histograms.is_index, mysql.stats_histograms.hist_id, mysql.stats_histograms.distinct_count, mysql.stats_histograms.version, mysql.stats_histograms.null_count, mysql.stats_histograms.tot_col_size, mysql.stats_histograms.stats_ver, mysql.stats_histograms.flag, mysql.stats_histograms.correlation, mysql.stats_histograms.last_analyze_pos	169    	time:11s, loops:2, Concurrency:OFF                                                                                                                                                                                                                                                                                                                                                                                                                                                                                                    	22.3 KB	N/A
└─IndexLookUp_10    	root     	11     	                                                                                                                                                                                                                                                                                                                                                                                           	169    	time:11s, loops:2, index_task: {total_time: 368.5µs, fetch_handle: 363µs, build: 810ns, wait: 4.75µs}, table_task: {total_time: 11s, num: 1, concurrency: 5}                                                                                                                                                                                                                                                                                                                                                                       	32.9 KB	N/A
  ├─IndexRangeScan_8	cop[tikv]	11     	table:stats_histograms, index:tbl(table_id, is_index, hist_id), range:[24270,24270], keep order:false                                                                                                                                                                                                                                                                                      	169    	time:350.8µs, loops:3, cop_task: {num: 1, max: 293µs, proc_keys: 0, rpc_num: 1, rpc_time: 284.8µs, copr_cache_hit_ratio: 1.00}, tikv_task:{time:10ms, loops:3}                                                                                                                                                                                                                                                                                                                                                                     	N/A    	N/A
  └─TableRowIDScan_9	cop[tikv]	11     	table:stats_histograms, keep order:false                                                                                                                                                                                                                                                                                                                                                   	169    	time:11s, loops:2, cop_task: {num: 25, max: 3.16ms, min: 518.6µs, avg: 1.15ms, p95: 2.92ms, max_proc_keys: 10, p95_proc_keys: 9, rpc_num: 47, rpc_time: 38.4ms, copr_cache_hit_ratio: 0.00}, ResolveLock:{num_rpc:20, total_time:11.1s}, backoff{txnNotFound: 11s}, tikv_task:{proc max:0s, min:0s, p80:0s, p95:0s, iters:25, tasks:25}, scan_detail: {total_process_keys: 169, total_keys: 1369, rocksdb: {delete_skipped_count: 177, key_skipped_count: 2645, block: {cache_hit_count: 1101, read_count: 149, read_byte: 6.96 MB}}}	N/A    	N/A

从SQL和执行计划上可以看到都是处理的表24720的统计信息,insert时间消耗在prewrite是的txnLock的backoff上。select语句消耗在txnNotFound的backoff上。

1、 官方文档有对lockNotFound的解释,是否和txnNotFound一样?如果不一样txnNotFound具体解释是什么样的?这个帖子只说了和热点有关,没有太具体的说明。

2、从慢SQL截图上看select大部分都是10:52执行的,是什么样的操作或需求需要对同一个表24720比较集中的查询stats_histograms统计信息?目前这表中基本只插入数据。

3、对于统计信息这里系统表的数据在插入更新时是使用乐观事务还是悲观事务模式?

4、此问题该如何解决?
btjh-TiKV-Details_2022-05-05T03_37_16.653Z.json (26.9 MB)
btjh-TiDB_2022-05-05T03_44_11.195Z.json (6.5 MB)

1 个赞

1、这2个我也分的不是很清晰,不过txnNotFound,多数是指 prewrite + commit primary 太慢,primary key TTL 过期被清掉了
2、这个表的更新多是发生在 analyze 的时候,记得有版本,有你说的这个现象,后面进行优化过(时间太久,忘记哪个版本了),记得 这个 表相关的问题比较多,后续版本好像就比较少了
— 上面说的什么情况下,会发生对这个表 同时操作(一个情况:业务的 多个 txn 对这个表进行操作,引起同时对这个系统表操作)

1 个赞

之前问过说列的宽度发生变化也会写入stats_histograms,但是哪些情况会导致比较集中的读这些信息呢。

1 个赞

记得问过说没有特殊情况,会发生集中的读这些信息,主要还是统计信息相关的操作,会触发这些查询 :比如 统计信息变更