升级了版本之后tikv的 cpu 忽然提高导致读写很慢

为提高效率,请提供以下信息,问题描述清晰能够更快得到解决:
【 TiDB 使用环境】

【概述】 场景 + 问题概述
原来用的是3.0版本,慢sql经过优化之后执行计划正常了,整体的效率也还好,后来切换了5.4做了数据迁移,tikv的三个节点轮流出现cpu 沾满的情况,导致读写直接卡死

【背景】 做过哪些操作

【现象】 业务和数据库现象

【问题】 当前遇到的问题

【业务影响】

【TiDB 版本】
5.4
【应用软件及版本】

【附件】 相关日志及配置信息

  • TiUP Cluster Display 信息
  • TiUP CLuster Edit config 信息

监控(https://metricstool.pingcap.com/)

  • TiDB-Overview Grafana监控
  • TiDB Grafana 监控
  • TiKV Grafana 监控
  • PD Grafana 监控
  • 对应模块日志(包含问题前后 1 小时日志)

若提问为性能优化、故障排查类问题,请下载脚本运行。终端输出的打印结果,请务必全选并复制粘贴上传。

1 个赞

有热点了吧,tikv thread cpu监控可以判断下,还有dashboard的流量可视化


流量可视化可以看到

现在又正常了


流量可视化是多长时间的,看下那2条亮线相关对象的慢SQL

可视化是六个小时的,出现cpu问题是从16:00开始的

SELECT
a.order_id orderId,
a.reject_reason rejectReason,
a.is_out isOut,
a.order_status orderStatus,
a.order_create_time orderCreateTime,
a.video_title videoName,
a.video_cover_url coverImgeUrl,
a.status_desc statusDesc,
a.paid_douyin_id paidDouyinId,
a.target_douyin_id targetDouyinId,
a.target_douyin_name targetDouyinName,
a.video_id videoId,
IF(
a.bid IS NULL,
0,
CONVERT(a.bid / 1000, decimal(16, 2))
) bid,
IF(
SUM(b.pay_order_amount) IS NULL,
0,
CONVERT(SUM(b.pay_order_amount), decimal(16, 2))
) / IF(
SUM(b.stat_cost) IS NULL,
0,
CONVERT(SUM(b.stat_cost), decimal(16, 2))
) orderRoi,
CONVERT(a.order_amount / 1000, decimal(16, 2)) orderAmount,
IF(
SUM(b.stat_cost) IS NULL,
0,
CONVERT(SUM(b.stat_cost), decimal(16, 2))
) costInt,
IF(SUM(b.show_cnt) IS NULL, 0, SUM(b.show_cnt)) showCount,
IF(SUM(b.click_cnt) IS NULL, 0, SUM(b.click_cnt)) clickCount,
IF(
SUM(b.pay_order_count) IS NULL,
0,
SUM(b.pay_order_count)
) payOrderCount,
IF(
SUM(b.pay_order_amount) IS NULL,
0,
CONVERT(SUM(b.pay_order_amount), decimal(16, 2))
) payOrderAmount,
IF(
SUM(b.create_order_count) IS NULL,
0,
SUM(b.create_order_count)
) createOrderCount,
IF(
SUM(b.create_order_amount) IS NULL,
0,
CONVERT(SUM(b.create_order_amount), decimal(16, 2))
) createOrderAmount,
IF(
SUM(b.play_duration_3s) IS NULL,
0,
SUM(b.play_duration_3s)
) threeSecondsPlayCount,
IF(SUM(b.total_play) IS NULL, 0, SUM(b.total_play)) play,
IF(SUM(b.dy_follow) IS NULL, 0, SUM(b.dy_follow)) addFansCount,
IF(SUM(b.dy_like) IS NULL, 0, SUM(b.dy_like)) fabulousCount,
IF(SUM(b.dy_share) IS NULL, 0, SUM(b.dy_share)) shareCount,
IF(SUM(b.dy_comment) IS NULL, 0, SUM(b.dy_comment)) commentCount
FROM
sxt_order a
LEFT JOIN sxt_qc_order_hour_interval_report b ON a.order_id = b.sxt_order_id
AND b.stat_time_day BETWEEN ‘2022-04-07 00:00:00.0’
AND ‘2022-04-07 16:47:32.449’
AND (
b.stat_cost > 0
OR b.pay_order_amount > 0
)
WHERE
a.id >= 15339337
AND a.paid_douyin_id IN (‘99045849094’)
GROUP BY
a.order_id
ORDER BY
a.order_id DESC
LIMIT
10;

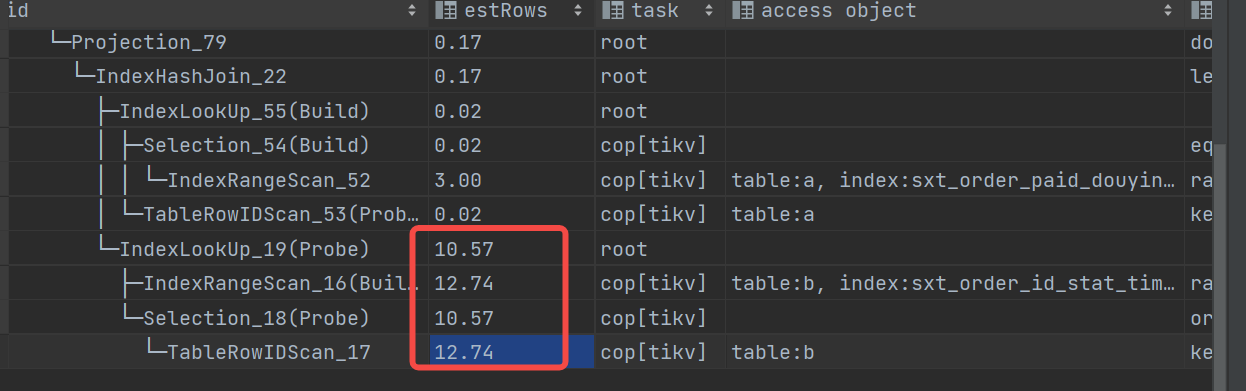
id                             	task     	estRows	operator info                                                                                                                                                                                                                                                                                                                                                                                                                                                                                                                                                                                                                                                                                                                                                                                                                                                                                                                                                                                                                                                                                                                                                                                                                                                                                                                                                                                                                                                                                                                                                                                                                   	actRows	execution info                                                                                                                                                                                                                                                                                                                                                                                                                                                                                                                                                     	memory  	disk
Projection_10                  	root     	10     	doujia.sxt_order.order_id, doujia.sxt_order.reject_reason, doujia.sxt_order.is_out, doujia.sxt_order.order_status, doujia.sxt_order.order_create_time, doujia.sxt_order.video_title, doujia.sxt_order.video_cover_url, doujia.sxt_order.status_desc, doujia.sxt_order.paid_douyin_id, doujia.sxt_order.target_douyin_id, doujia.sxt_order.target_douyin_name, doujia.sxt_order.video_id, if(isnull(doujia.sxt_order.bid), 0, cast(div(cast(doujia.sxt_order.bid, decimal(20,0) BINARY), 1000), decimal(16,2) BINARY))->Column#86, div(if(isnull(Column#73), 0, cast(Column#73, decimal(16,2) BINARY)), if(isnull(Column#74), 0, cast(Column#74, decimal(16,2) BINARY)))->Column#87, cast(div(cast(doujia.sxt_order.order_amount, decimal(20,0) BINARY), 1000), decimal(16,2) BINARY)->Column#88, if(isnull(Column#74), 0, cast(Column#74, decimal(16,2) BINARY))->Column#89, if(isnull(Column#75), 0, Column#75)->Column#90, if(isnull(Column#76), 0, Column#76)->Column#91, if(isnull(Column#77), 0, Column#77)->Column#92, if(isnull(Column#73), 0, cast(Column#73, decimal(16,2) BINARY))->Column#93, if(isnull(Column#78), 0, Column#78)->Column#94, if(isnull(Column#79), 0, cast(Column#79, decimal(16,2) BINARY))->Column#95, if(isnull(Column#80), 0, Column#80)->Column#96, if(isnull(Column#81), 0, Column#81)->Column#97, if(isnull(Column#82), 0, Column#82)->Column#98, if(isnull(Column#83), 0, Column#83)->Column#99, if(isnull(Column#84), 0, Column#84)->Column#100, if(isnull(Column#85), 0, Column#85)->Column#101                                                                                           	10     	time:21.6s, loops:2, Concurrency:OFF                                                                                                                                                                                                                                                                                                                                                                                                                                                                                                                               	25.9 KB 	N/A
└─TopN_13                      	root     	10     	doujia.sxt_order.order_id:desc, offset:0, count:10                                                                                                                                                                                                                                                                                                                                                                                                                                                                                                                                                                                                                                                                                                                                                                                                                                                                                                                                                                                                                                                                                                                                                                                                                                                                                                                                                                                                                                                                                                                                                                              	10     	time:21.6s, loops:2                                                                                                                                                                                                                                                                                                                                                                                                                                                                                                                                                	61.9 KB 	N/A
  └─HashAgg_18                 	root     	357.13 	group by:Column#165, funcs:sum(Column#138)->Column#73, funcs:sum(Column#139)->Column#74, funcs:sum(Column#140)->Column#75, funcs:sum(Column#141)->Column#76, funcs:sum(Column#142)->Column#77, funcs:sum(Column#143)->Column#78, funcs:sum(Column#144)->Column#79, funcs:sum(Column#145)->Column#80, funcs:sum(Column#146)->Column#81, funcs:sum(Column#147)->Column#82, funcs:sum(Column#148)->Column#83, funcs:sum(Column#149)->Column#84, funcs:sum(Column#150)->Column#85, funcs:firstrow(Column#151)->doujia.sxt_order.order_id, funcs:firstrow(Column#152)->doujia.sxt_order.is_out, funcs:firstrow(Column#153)->doujia.sxt_order.video_id, funcs:firstrow(Column#154)->doujia.sxt_order.video_title, funcs:firstrow(Column#155)->doujia.sxt_order.video_cover_url, funcs:firstrow(Column#156)->doujia.sxt_order.target_douyin_id, funcs:firstrow(Column#157)->doujia.sxt_order.target_douyin_name, funcs:firstrow(Column#158)->doujia.sxt_order.paid_douyin_id, funcs:firstrow(Column#159)->doujia.sxt_order.order_create_time, funcs:firstrow(Column#160)->doujia.sxt_order.order_status, funcs:firstrow(Column#161)->doujia.sxt_order.status_desc, funcs:firstrow(Column#162)->doujia.sxt_order.reject_reason, funcs:firstrow(Column#163)->doujia.sxt_order.order_amount, funcs:firstrow(Column#164)->doujia.sxt_order.bid                                                                                                                                                                                                                                                                                             	271    	time:21.6s, loops:6, partial_worker:{wall_time:21.576266905s, concurrency:5, task_num:1, tot_wait:1m47.872586665s, tot_exec:1.468224ms, tot_time:1m47.874092505s, max:21.575972798s, p95:21.575972798s}, final_worker:{wall_time:21.576754272s, concurrency:5, task_num:5, tot_wait:1m47.880808337s, tot_exec:2.091305ms, tot_time:1m47.882905427s, max:21.57672873s, p95:21.57672873s}                                                                                                                                                                            	815.9 KB	N/A
    └─Projection_118           	root     	360.15 	doujia.sxt_qc_order_hour_interval_report.pay_order_amount, doujia.sxt_qc_order_hour_interval_report.stat_cost, cast(doujia.sxt_qc_order_hour_interval_report.show_cnt, decimal(10,0) BINARY)->Column#140, cast(doujia.sxt_qc_order_hour_interval_report.click_cnt, decimal(10,0) BINARY)->Column#141, cast(doujia.sxt_qc_order_hour_interval_report.pay_order_count, decimal(10,0) BINARY)->Column#142, cast(doujia.sxt_qc_order_hour_interval_report.create_order_count, decimal(10,0) BINARY)->Column#143, doujia.sxt_qc_order_hour_interval_report.create_order_amount, cast(doujia.sxt_qc_order_hour_interval_report.play_duration_3s, decimal(10,0) BINARY)->Column#145, cast(doujia.sxt_qc_order_hour_interval_report.total_play, decimal(10,0) BINARY)->Column#146, cast(doujia.sxt_qc_order_hour_interval_report.dy_follow, decimal(10,0) BINARY)->Column#147, cast(doujia.sxt_qc_order_hour_interval_report.dy_like, decimal(10,0) BINARY)->Column#148, cast(doujia.sxt_qc_order_hour_interval_report.dy_share, decimal(10,0) BINARY)->Column#149, cast(doujia.sxt_qc_order_hour_interval_report.dy_comment, decimal(10,0) BINARY)->Column#150, doujia.sxt_order.order_id, doujia.sxt_order.is_out, doujia.sxt_order.video_id, doujia.sxt_order.video_title, doujia.sxt_order.video_cover_url, doujia.sxt_order.target_douyin_id, doujia.sxt_order.target_douyin_name, doujia.sxt_order.paid_douyin_id, doujia.sxt_order.order_create_time, doujia.sxt_order.order_status, doujia.sxt_order.status_desc, doujia.sxt_order.reject_reason, doujia.sxt_order.order_amount, doujia.sxt_order.bid, doujia.sxt_order.order_id	306    	time:21.6s, loops:2, Concurrency:OFF                                                                                                                                                                                                                                                                                                                                                                                                                                                                                                                               	250.2 KB	N/A
      └─HashJoin_35            	root     	360.15 	left outer join, equal:[eq(doujia.sxt_order.order_id, doujia.sxt_qc_order_hour_interval_report.sxt_order_id)]                                                                                                                                                                                                                                                                                                                                                                                                                                                                                                                                                                                                                                                                                                                                                                                                                                                                                                                                                                                                                                                                                                                                                                                                                                                                                                                                                                                                                                                                                                                   	306    	time:21.6s, loops:2, build_hash_table:{total:21.6s, fetch:21.4s, build:202.5ms}, probe:{concurrency:5, total:1m47.9s, max:21.6s, probe:779.4µs, fetch:1m47.9s}                                                                                                                                                                                                                                                                                                                                                                                                    	73.7 MB 	0 Bytes
        ├─IndexLookUp_60       	root     	360.15 	                                                                                                                                                                                                                                                                                                                                                                                                                                                                                                                                                                                                                                                                                                                                                                                                                                                                                                                                                                                                                                                                                                                                                                                                                                                                                                                                                                                                                                                                                                                                                                                                                                	271    	time:6.48ms, loops:2, index_task: {total_time: 830.1µs, fetch_handle: 826.1µs, build: 570ns, wait: 3.44µs}, table_task: {total_time: 5.37ms, num: 1, concurrency: 5}                                                                                                                                                                                                                                                                                                                                                                                            	167.7 KB	N/A
        │ ├─Selection_59       	cop[tikv]	360.15 	ge(doujia.sxt_order.id, 15339337)                                                                                                                                                                                                                                                                                                                                                                                                                                                                                                                                                                                                                                                                                                                                                                                                                                                                                                                                                                                                                                                                                                                                                                                                                                                                                                                                                                                                                                                                                                                                                                                               	271    	time:811.2µs, loops:3, cop_task: {num: 1, max: 759.4µs, proc_keys: 763, tot_proc: 1ms, rpc_num: 1, rpc_time: 752.4µs, copr_cache_hit_ratio: 0.00}, tikv_task:{time:1ms, loops:5}, scan_detail: {total_process_keys: 763, total_process_keys_size: 62566, total_keys: 795, rocksdb: {delete_skipped_count: 97, key_skipped_count: 891, block: {cache_hit_count: 7, read_count: 0, read_byte: 0 Bytes}}}                                                                                                                                                          	N/A     	N/A
        │ │ └─IndexRangeScan_57	cop[tikv]	804.62 	table:a, index:sxt_order_paid_douyin_id_order_create_time_order_status_index(paid_douyin_id, order_create_time, order_status), range:["99045849094","99045849094"], keep order:false                                                                                                                                                                                                                                                                                                                                                                                                                                                                                                                                                                                                                                                                                                                                                                                                                                                                                                                                                                                                                                                                                                                                                                                                                                                                                                                                                                                                                                            	763    	tikv_task:{time:1ms, loops:5}                                                                                                                                                                                                                                                                                                                                                                                                                                                                                                                                      	N/A     	N/A
        │ └─TableRowIDScan_58  	cop[tikv]	360.15 	table:a, keep order:false                                                                                                                                                                                                                                                                                                                                                                                                                                                                                                                                                                                                                                                                                                                                                                                                                                                                                                                                                                                                                                                                                                                                                                                                                                                                                                                                                                                                                                                                                                                                                                                                       	271    	time:5.16ms, loops:2, cop_task: {num: 13, max: 5.05ms, min: 338.6µs, avg: 1.73ms, p95: 5.05ms, max_proc_keys: 69, p95_proc_keys: 69, tot_proc: 7ms, tot_wait: 11ms, rpc_num: 13, rpc_time: 22.4ms, copr_cache_hit_ratio: 0.00}, tikv_task:{proc max:1ms, min:0s, p80:1ms, p95:1ms, iters:16, tasks:13}, scan_detail: {total_process_keys: 271, total_process_keys_size: 173314, total_keys: 286, rocksdb: {delete_skipped_count: 0, key_skipped_count: 79, block: {cache_hit_count: 1732, read_count: 0, read_byte: 0 Bytes}}}                                    	N/A     	N/A
        └─IndexLookUp_67       	root     	0      	                                                                                                                                                                                                                                                                                                                                                                                                                                                                                                                                                                                                                                                                                                                                                                                                                                                                                                                                                                                                                                                                                                                                                                                                                                                                                                                                                                                                                                                                                                                                                                                                                                	569412 	time:21.4s, loops:558, index_task: {total_time: 18.6s, fetch_handle: 6.85s, build: 56.6µs, wait: 11.7s}, table_task: {total_time: 1m7.8s, num: 37, concurrency: 5}                                                                                                                                                                                                                                                                                                                                                                                                	16.8 MB 	N/A
          ├─IndexRangeScan_64  	cop[tikv]	0      	table:b, index:sxt_qc_order_hour_interval_report_bk_stat_time_day_index(stat_time_day), range:[2022-04-07 00:00:00,2022-04-07 16:47:32], keep order:false                                                                                                                                                                                                                                                                                                                                                                                                                                                                                                                                                                                                                                                                                                                                                                                                                                                                                                                                                                                                                                                                                                                                                                                                                                                                                                                                                                                                                                                                       	682154 	time:6.78s, loops:669, cop_task: {num: 1, max: 3.48s, proc_keys: 682154, tot_proc: 3.45s, tot_wait: 28ms, rpc_num: 2, rpc_time: 6.78s, copr_cache_hit_ratio: 0.00}, ResolveLock:{num_rpc:1, total_time:365.2µs}, tikv_task:{time:389ms, loops:671}, scan_detail: {total_process_keys: 682154, total_process_keys_size: 31379084, total_keys: 682204, rocksdb: {delete_skipped_count: 378, key_skipped_count: 682582, block: {cache_hit_count: 424, read_count: 0, read_byte: 0 Bytes}}}                                                                           	N/A     	N/A
          └─Selection_66       	cop[tikv]	0      	or(gt(doujia.sxt_qc_order_hour_interval_report.stat_cost, 0), gt(doujia.sxt_qc_order_hour_interval_report.pay_order_amount, 0))                                                                                                                                                                                                                                                                                                                                                                                                                                                                                                                                                                                                                                                                                                                                                                                                                                                                                                                                                                                                                                                                                                                                                                                                                                                                                                                                                                                                                                                                                                 	569412 	time:1m7.1s, loops:703, cop_task: {num: 84, max: 2.81s, min: 518µs, avg: 878.6ms, p95: 2.53s, max_proc_keys: 20480, p95_proc_keys: 20480, tot_proc: 1m9.9s, tot_wait: 2.41s, rpc_num: 84, rpc_time: 1m13.8s, copr_cache_hit_ratio: 0.11}, tikv_task:{proc max:469ms, min:0s, p80:381ms, p95:430ms, iters:949, tasks:84}, scan_detail: {total_process_keys: 680101, total_process_keys_size: 205086093, total_keys: 709744, rocksdb: {delete_skipped_count: 5242, key_skipped_count: 108929, block: {cache_hit_count: 3590179, read_count: 0, read_byte: 0 Bytes}}}	N/A     	N/A
            └─TableRowIDScan_65	cop[tikv]	0      	table:b, keep order:false                                                                                                                                                                                                                                                                                                                                                                                                                                                                                                                                                                                                                                                                                                                                                                                                                                                                                                                                                                                                                                                                                                                                                                                                                                                                                                                                                                                                                                                                                                                                                                                                       	682154 	tikv_task:{proc max:469ms, min:0s, p80:381ms, p95:429ms, iters:949, tasks:84}                                                                                                                                                                                                                                                                                                                                                                                                                                                                                      	N/A     	N/A

亮线相关的只有这个sql ,包含了这两个对象,看查询计划应该可以的

show stats_healthy看下B表统计信息健康度。a.order_id = b.sxt_order_id b表这列有索引吗? 走stat_time_day_index(stat_time_day)这个索引返回的数据有点多,预估0行,重新收集下统计信息

1 个赞


这个分别是 a b 表的健康情况。
b.sxt_order_id 是有索引的。

收集信息直接执行这个吗

ANALYZE TABLE TableName

对,会消耗资源,主要业务影响

刚才我重新ANALYZE 了下b表。预估的有值了。

需要怎么调整可以解决

现在的执行计划还是走的analyze这个索引吗?看下后面执行计划返回的act_rows和执行时间。试试b.sxt_order_id b表加这列的强制索引执行效率

手动analyze b表之后发现 执行时间到毫秒了,貌似没有延迟了,流量可视化中热点数据也没有了。这个是什么原因,之前改了 analyze的version 由2变成了1 ,时间是凌晨1点到3点

就是统计信息需要更新了,可以把ratio参数调低写,或自己写一个定时任务做analyze

B表的索引是走到 sxt_order_id + time的联合索引的。目前整体效率好了。就tidb的节点内存很高

看下tidb 监控页面上的内存使用