顧問們 你們好,
【TiDB 版本】:v4.0.8
【 Data Migration版本】:nightly
【问题描述】:
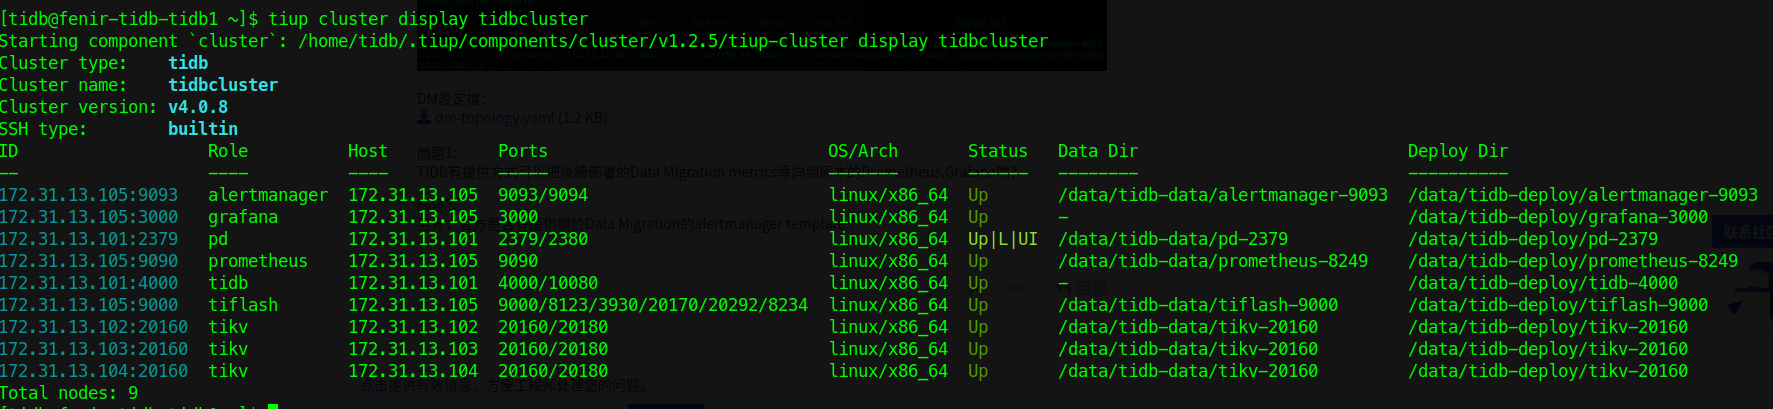
由於公司目前已著手在進行從MySQL搬遷到TiDB的驗證,由於原本TiDB Cluster中已有透過TiUP佈署Prometheus,Grafana,alertmanager
TiDB Cluster設定檔:fenir_topology.yaml (5.4 KB)
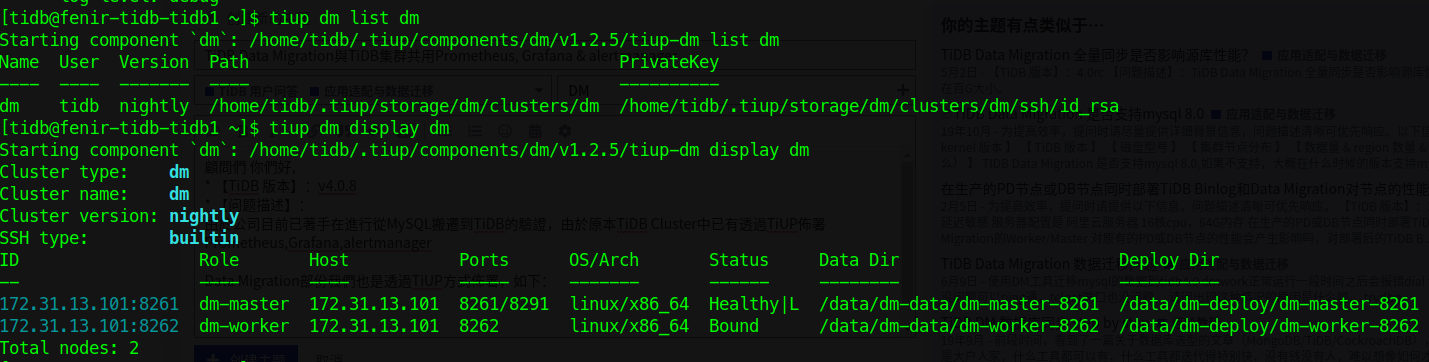
Data Migration部份我們也是透過TiUP方式佈署,如下:
DM設定檔:dm-topology.yaml (1.2 KB)
問題1:https://github.com/pingcap/tiup/blob/master/examples/dm/topology.example.yaml
問題2:
来了老弟
2020 年12 月 14 日 03:11
2
官放目前不支持将监控合并,但是社区有一些办法,请谨慎参考
1 个赞
Hi 顧問好,
官放目前不支持将监控合并,但是社区有一些办法,请谨慎参考方便提供連結給我們?
感覺TiDB Cluster與DM Cluster不能共用同一套Prometheus、Grafana、Alertmanager
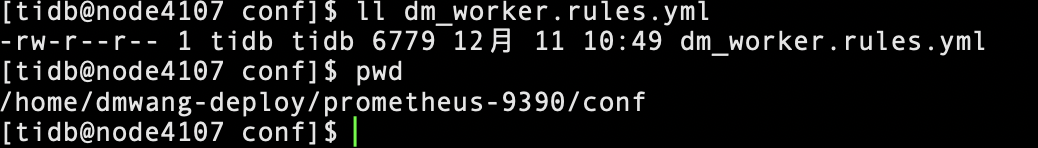
dm_worker.rules.yml檔案我有在GitHub上找到,連結如下:https://github.com/pingcap/dm/blob/master/dm/dm-ansible/conf/dm_worker.rules.yml
来了老弟
2020 年12 月 15 日 04:07
4
1/
多谢,已经有解决方案了
操作步骤:
1、完全按官方操作手册ansible安装集群1
2、安装集群2,在local_prepare、bootstrap、deploy 阶段, inventory.ini 中注释掉 grafana_servers 组下面的 ip
3、在执行集群2 start.yml 之前取消 grafana_servers 组中 ip 的注释,然后执行 start.yml
4…
官方有计划将监控合并,但是目前开发优先级不高。
1 个赞
Hi 顧問好,
tidb版本: v4.0.8
我們在透過TiUP佈署dm-master、dm-worker時,未佈署DM專用的Prometheus、Grafana、Alertmanager
– dm-scale-out.yaml
host: 172.31.13.105
grafana_servers:
host: 172.31.13.105
alertmanager_servers:
host: 172.31.13.105
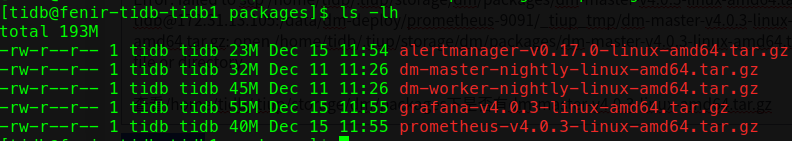
遇到以下錯誤:tidb@172.31.13.105 :/data/dm-deploy/prometheus-9091/_tiup_tmp/dm-master-v4.0.3-linux-amd64.tar.gz: open /home/tidb/.tiup/storage/dm/packages/dm-master-v4.0.3-linux-amd64.tar.gz: no such file or directory
查看/home/tidb/.tiup/storage/dm/packages下是否有dm-master-v4.0.3-linux-amd64.tar.gz
請問這是TiUP dm scale-out的bug嗎?若TiUP沒自動下載此檔案,是否有管道可手動下載到此目錄下?
来了老弟
2020 年12 月 16 日 02:45
6
该问题已经在 tiup 最新版本修复,辛苦将 tiup 和 tiup dm 升级一下。
1 个赞
Hi 顧問 早上好,
我們已將tiup & tiup dm升級,但在scale-out時還是會報相同錯誤
[tidb@fenir-tidb-tidb1 ~]$ tiup update --self && tiup update --all
download https://tiup-mirrors.pingcap.com/tiup-v1.2.5-linux-amd64.tar.gz 8.41 MiB / 8.41 MiB 100.00% ? p/s
[tidb@fenir-tidb-tidb1 ~]$ tiup dm upgrade dm nightly
Starting component dm: /home/tidb/.tiup/components/dm/v1.2.5/tiup-dm upgrade dm nightly
[ Serial ] - SSHKeySet: privateKey=/home/tidb/.tiup/storage/dm/clusters/dm/ssh/id_rsa, publicKey=/home/tidb/.tiup/storage/dm/clusters/dm/ssh/id_rsa.pub
[Parallel] - UserSSH: user=tidb, host=172.31.13.101
[Parallel] - UserSSH: user=tidb, host=172.31.13.101
[ Serial ] - Download: component=dm-master, version=nightly, os=linux, arch=amd64
[ Serial ] - Download: component=dm-worker, version=nightly, os=linux, arch=amd64
[ Serial ] - BackupComponent: component=dm-worker, currentVersion=nightly, remote=172.31.13.101:/data/dm-deploy/dm-worker-8262
[ Serial ] - BackupComponent: component=dm-master, currentVersion=nightly, remote=172.31.13.101:/data/dm-deploy/dm-master-8261
[ Serial ] - CopyComponent: component=dm-worker, version=nightly, remote=172.31.13.101:/data/dm-deploy/dm-worker-8262 os=linux, arch=amd64
[ Serial ] - CopyComponent: component=dm-master, version=nightly, remote=172.31.13.101:/data/dm-deploy/dm-master-8261 os=linux, arch=amd64
[ Serial ] - InitConfig: cluster=dm, user=tidb, host=172.31.13.101, path=/home/tidb/.tiup/storage/dm/clusters/dm/config-cache/dm-master-8261.service, deploy_dir=/data/dm-deploy/dm-master-8261, data_dir=[/data/dm-data/dm-master-8261], log_dir=/data/dm-deploy/dm-master-8261/log, cache_dir=/home/tidb/.tiup/storage/dm/clusters/dm/config-cache
[ Serial ] - InitConfig: cluster=dm, user=tidb, host=172.31.13.101, path=/home/tidb/.tiup/storage/dm/clusters/dm/config-cache/dm-worker-8262.service, deploy_dir=/data/dm-deploy/dm-worker-8262, data_dir=[/data/dm-data/dm-worker-8262], log_dir=/data/dm-deploy/dm-worker-8262/log, cache_dir=/home/tidb/.tiup/storage/dm/clusters/dm/config-cache
[ Serial ] - UpgradeClusterdm successfully
[tidb@fenir-tidb-tidb1 ~]$ tiup dm scale-out dm dm-scale-out.yaml dm: /home/tidb/.tiup/components/dm/v1.2.5/tiup-dm scale-out dm dm-scale-out.yaml
prometheus 172.31.13.105 9091 linux/x86_64 /data/dm-deploy/prometheus-9091,/data/dm-data/prometheus-9091
[ Serial ] - SSHKeySet: privateKey=/home/tidb/.tiup/storage/dm/clusters/dm/ssh/id_rsa, publicKey=/home/tidb/.tiup/storage/dm/clusters/dm/ssh/id_rsa.pub
Download grafana:v4.0.3 (linux/amd64) … Done
[ Serial ] - RootSSH: user=tidb, host=172.31.13.105, port=22, key=/home/tidb/.ssh/id_rsa
[ Serial ] - EnvInit: user=tidb, host=172.31.13.105
[ Serial ] - Mkdir: host=172.31.13.105, directories=’/data/dm-deploy’,’/data/dm-data’
[Parallel] - UserSSH: user=tidb, host=172.31.13.101
[Parallel] - UserSSH: user=tidb, host=172.31.13.101
[ Serial ] - UserSSH: user=tidb, host=172.31.13.105
[ Serial ] - UserSSH: user=tidb, host=172.31.13.105
[ Serial ] - Mkdir: host=172.31.13.105, directories=’/data/dm-deploy/alertmanager-9095’,’/data/dm-deploy/alertmanager-9095/log’,’/data/dm-deploy/alertmanager-9095/bin’,’/data/dm-deploy/alertmanager-9095/conf’,’/data/dm-deploy/alertmanager-9095/scripts’
[ Serial ] - UserSSH: user=tidb, host=172.31.13.105
[ Serial ] - Mkdir: host=172.31.13.105, directories=’/data/dm-deploy/prometheus-9091’,’/data/dm-deploy/prometheus-9091/log’,’/data/dm-deploy/prometheus-9091/bin’,’/data/dm-deploy/prometheus-9091/conf’,’/data/dm-deploy/prometheus-9091/scripts’
[ Serial ] - Mkdir: host=172.31.13.105, directories=’/data/dm-deploy/grafana-3001’,’/data/dm-deploy/grafana-3001/log’,’/data/dm-deploy/grafana-3001/bin’,’/data/dm-deploy/grafana-3001/conf’,’/data/dm-deploy/grafana-3001/scripts’
[ Serial ] - Mkdir: host=172.31.13.105, directories=’/data/dm-data/prometheus-9091’
[ Serial ] - Mkdir: host=172.31.13.105, directories=’’
[ Serial ] - CopyComponent: component=grafana, version=v4.0.3, remote=172.31.13.105:/data/dm-deploy/grafana-3001 os=linux, arch=amd64
[ Serial ] - Mkdir: host=172.31.13.105, directories=’/data/dm-data/alertmanager-9095’
[ Serial ] - CopyComponent: component=prometheus, version=v4.0.3, remote=172.31.13.105:/data/dm-deploy/prometheus-9091 os=linux, arch=amd64
[ Serial ] - CopyComponent: component=alertmanager, version=v0.17.0, remote=172.31.13.105:/data/dm-deploy/alertmanager-9095 os=linux, arch=amd64
[ Serial ] - CopyConfig
[ Serial ] - ScaleConfig: cluster=dm, user=tidb, host=172.31.13.105, service=alertmanager-9095.service, deploy_dir=/data/dm-deploy/alertmanager-9095, data_dir=[/data/dm-data/alertmanager-9095], log_dir=/data/dm-deploy/alertmanager-9095/log, cache_dir=
[ Serial ] - Shell: host=172.31.13.105, sudo=false, command=rm /data/dm-deploy/prometheus-9091/bin/prometheus/*.rules.yml
[ Serial ] - CopyRulesYML
[ Serial ] - Shell: host=172.31.13.105, sudo=false, command=rm /data/dm-deploy/grafana-3001/bin/*.json
[ Serial ] - Dashboards
Error: failed to scp /home/tidb/.tiup/storage/dm/packages/dm-master-v4.0.3-linux-amd64.tar.gz to tidb@172.31.13.105 :/data/dm-deploy/prometheus-9091/_tiup_tmp/dm-master-v4.0.3-linux-amd64.tar.gz: open /home/tidb/.tiup/storage/dm/packages/dm-master-v4.0.3-linux-amd64.tar.gz: no such file or directory
Verbose debug logs has been written to /home/tidb/logs/tiup-cluster-debug-2020-12-16-11-06-34.log./home/tidb/.tiup/components/dm/v1.2.5/tiup-dm (wd:/home/tidb/.tiup/data/SJIbIca) failed: exit status 1
来了老弟
2020 年12 月 16 日 03:35
8
sorry 还没发版。v1.3.0 才修复。
cp ~/.tiup/storage/dm/packages/dm-master-v2.0.0-linux-amd64.tar.gz ~/.tiup/storage/dm/packages/dm-master-v4.0.3-linux-amd64.tar.gz
先执行上面的命令, workaround 下。https://github.com/pingcap/tiup/issues/876
1 个赞
Hi 顧問好,
Problem solved. Thanks a lot.
来了老弟
2020 年12 月 16 日 07:01
10
1 个赞
system
2022 年10 月 31 日 19:20
11
此话题已在最后回复的 1 分钟后被自动关闭。不再允许新回复。