为提高效率,提问时请提供以下信息,问题描述清晰可优先响应。
- 【TiDB 版本】:3.0.10
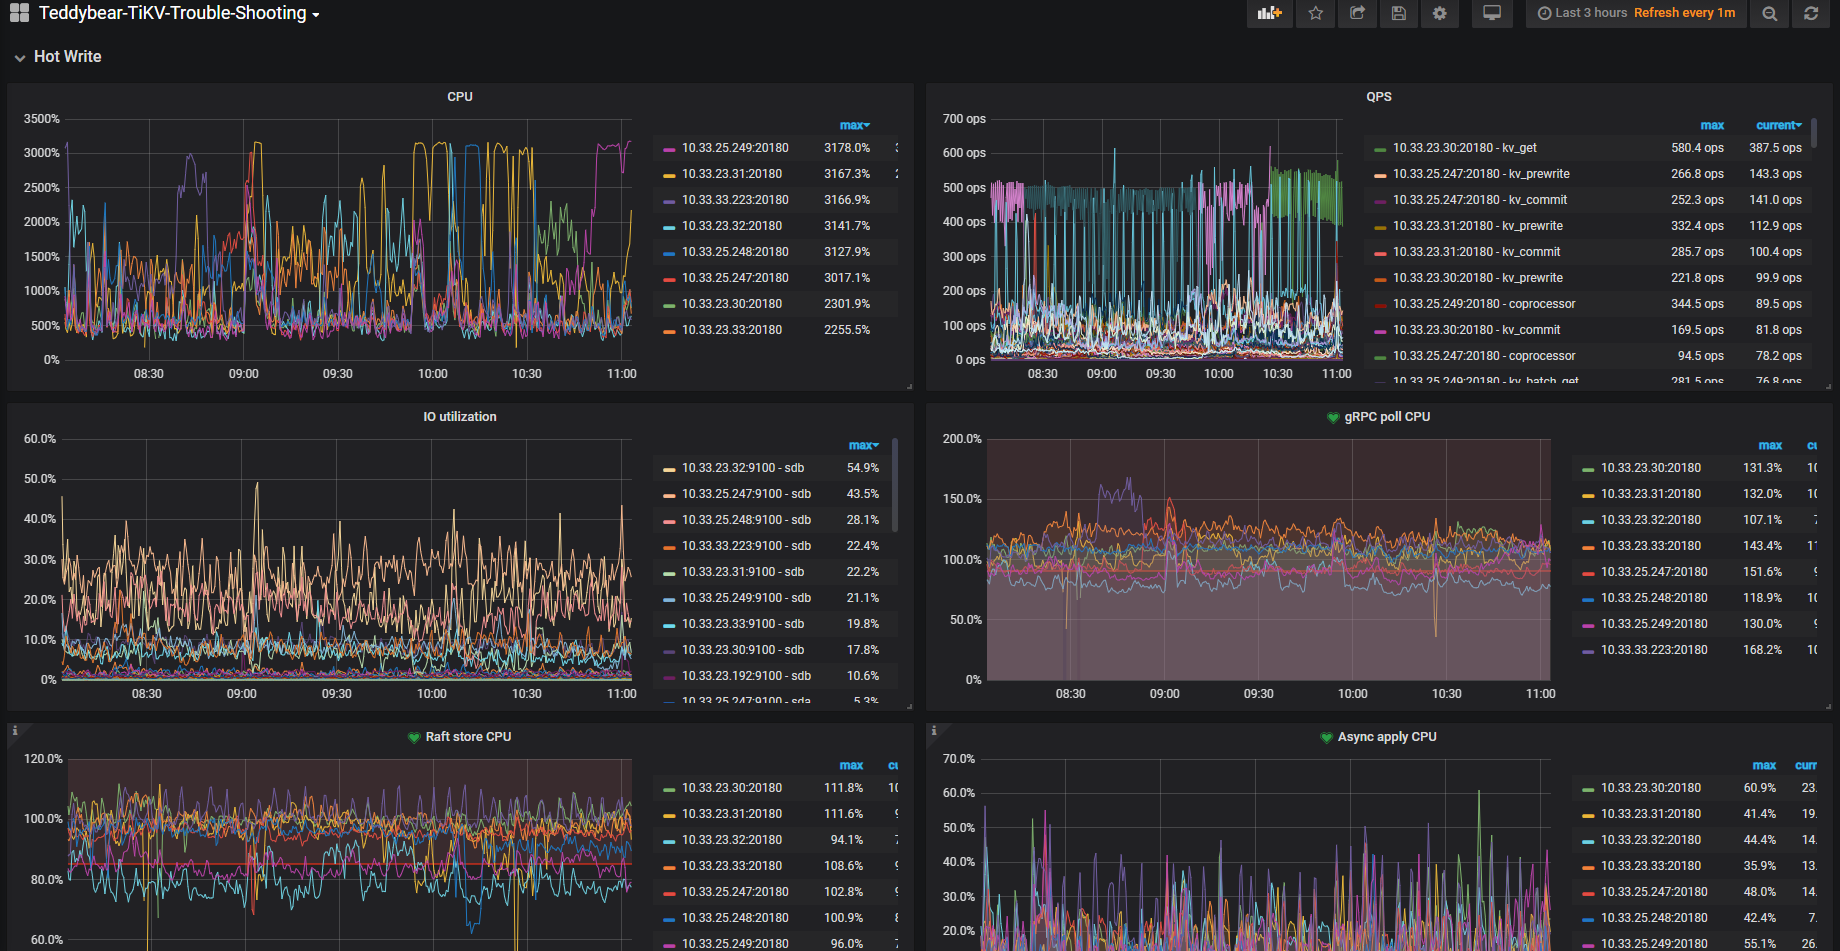
- 【问题描述】:TiKV节点 CPU利用率居高不下,看过其他的帖子,感觉情况不太一样,slow_query,感觉没什么大问题。现在不清楚是哪里导致的,希望指导一条排查思路。


若提问为性能优化、故障排查类问题,请下载脚本运行。终端输出打印结果,请务必全选并复制粘贴上传。
为提高效率,提问时请提供以下信息,问题描述清晰可优先响应。
集群应该有两个问题:
https://docs.pingcap.com/zh/tidb/stable/troubleshoot-hot-spot-issues#使用-tidb-dashboard-定位热点表
另外可以找一下慢日志中有没有 process key 比较多的 SQL ,process key 比较多也容易导致 Coprocessor 高。
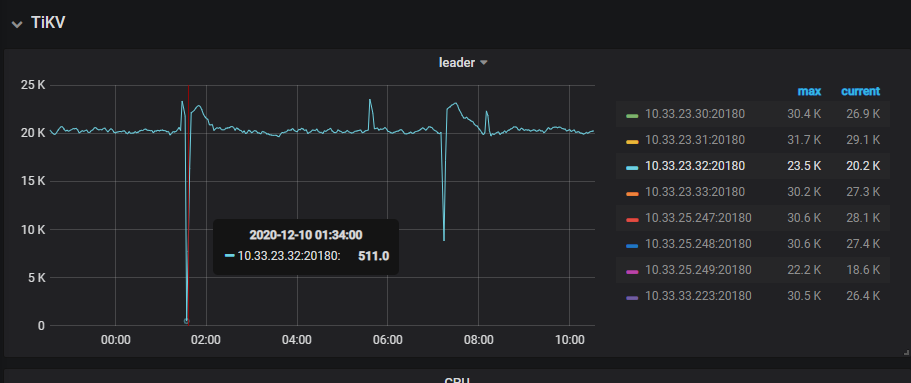
不是 OOM 导致的,如图所示 32 tikv节点确实重启,原因我不太明白,tail -10000000 tikv.log | grep -C 10 Welcome 日志附上,帮忙看下哈。
tikv.log (41.5 KB)
[2020/12/10 07:11:40.505 +08:00] [FATAL] [lib.rs:499] ["assertion failed: `(left == right)`\
  left: `8418087`,\
 right: `8418179`"] [backtrace="stack backtrace:\
   0:     0x56013ea10c2d - backtrace::backtrace::libunwind::trace::h958f5f3eb75b2917\
                        at /rust/registry/src/github.com-1ecc6299db9ec823/backtrace-0.2.3/src/backtrace/libunwind.rs:54\
                         - backtrace::backtrace::trace::hdf994f7eb3c12b81\
                        at /rust/registry/src/github.com-1ecc6299db9ec823/backtrace-0.2.3/src/backtrace/mod.rs:70\
   1:     0x56013ea06930 - tikv_util::set_panic_hook::{{closure}}::hf6c0260b2e4aea39\
                        at /home/jenkins/.target/release/build/backtrace-e20a32a05fd0b8fe/out/capture.rs:79\
   2:     0x56013ebb051f - std::panicking::rust_panic_with_hook::h8d2408723e9a2bd4\
                        at src/libstd/panicking.rs:479\
   3:     0x56013ebb02fd - std::panicking::continue_panic_fmt::hb2aaa9386c4e5e80\
                        at src/libstd/panicking.rs:382\
   4:     0x56013ebb02ab - std::panicking::begin_panic_fmt::h1c91fada5a982dcd\
                        at src/libstd/panicking.rs:337\
   5:     0x56013e0754de - tikv::raftstore::store::fsm::apply::ApplyFsm::handle_tasks::ha3b6f347e0356612\
                        at src/raftstore/store/fsm/apply.rs:0\
   6:     0x56013e06c787 - <tikv::raftstore::store::fsm::apply::ApplyPoller as batch_system::batch::PollHandler<tikv::raftstore::store::fsm::apply::ApplyFsm,tikv::raftstore::store::fsm::apply::ControlFsm>>::handle_normal::h7bc5fc80e0bd5e2a\
                        at src/raftstore/store/fsm/apply.rs:2698\
                         - batch_system::batch::Poller<N,C,Handler>::poll::h0d03eb3f9a10b122\
                        at /home/jenkins/agent/workspace/ld_tikv_multi_branch_release-3.0/tikv/components/batch-system/src/batch.rs:324\
                         - batch_system::batch::BatchSystem<N,C>::spawn::{{closure}}::h435371381643823b\
                        at /home/jenkins/agent/workspace/ld_tikv_multi_branch_release-3.0/tikv/components/batch-system/src/batch.rs:408\
                         - std::sys_common::backtrace::__rust_begin_short_backtrace::h57b97dbaf382008c\
                        at /rustc/0e4a56b4b04ea98bb16caada30cb2418dd06e250/src/libstd/sys_common/backtrace.rs:77\
   7:     0x56013e06b011 - std::thread::Builder::spawn_unchecked::{{closure}}::{{closure}}::hc63cad02fdca2bb4\
                        at /rustc/0e4a56b4b04ea98bb16caada30cb2418dd06e250/src/libstd/thread/mod.rs:470\
                         - <std::panic::AssertUnwindSafe<F> as core::ops::function::FnOnce<()>>::call_once::hb9dfa6d2c40ee2d6\
                        at /rustc/0e4a56b4b04ea98bb16caada30cb2418dd06e250/src/libstd/panic.rs:309\
                         - std::panicking::try::do_call::h890a76168e81e0eb\
                        at /rustc/0e4a56b4b04ea98bb16caada30cb2418dd06e250/src/libstd/panicking.rs:294\
                         - std::panicking::try::hd6cfb79c13a189e3\
                        at /rustc/0e4a56b4b04ea98bb16caada30cb2418dd06e250//src/libpanic_abort/lib.rs:29\
                         - std::panic::catch_unwind::h4babd4196cafa819\
                        at /rustc/0e4a56b4b04ea98bb16caada30cb2418dd06e250/src/libstd/panic.rs:388\
                         - std::thread::Builder::spawn_unchecked::{{closure}}::h0d6ddf3937cee2c1\
                        at /rustc/0e4a56b4b04ea98bb16caada30cb2418dd06e250/src/libstd/thread/mod.rs:469\
                         - core::ops::function::FnOnce::call_once{{vtable.shim}}::hab02bbf254d00fe2\
                        at /rustc/0e4a56b4b04ea98bb16caada30cb2418dd06e250/src/libcore/ops/function.rs:231\
   8:     0x56013ebbeb6e - <alloc::boxed::Box<F> as core::ops::function::FnOnce<A>>::call_once::he71721d2d956d451\
                        at /rustc/0e4a56b4b04ea98bb16caada30cb2418dd06e250/src/liballoc/boxed.rs:746\
   9:     0x56013ebc0e9b - <alloc::boxed::Box<F> as core::ops::function::FnOnce<A>>::call_once::he520045b8d28ce5c\
                        at /rustc/0e4a56b4b04ea98bb16caada30cb2418dd06e250/src/liballoc/boxed.rs:746\
                         - std::sys_common::thread::start_thread::h2e98d1272dc6d74b\
                        at src/libstd/sys_common/thread.rs:13\
                         - std::sys::unix::thread::Thread::new::thread_start::h18485805666ccd3c\
                        at src/libstd/sys/unix/thread.rs:79\
  10:     0x7fe44ee75e64 - start_thread\
  11:     0x7fe44e57c88c - clone\
  12:                0x0 - <unknown>"] [location=src/raftstore/store/fsm/apply.rs:2375] [thread_name=apply-1]
这是 3.0.10 版本 raftstore 的一个 BUG,触发场景是一个 peer 在 conf change 被销毁前因为写入较多数据所以中断等待下一轮,下一轮继续处理的时候没有正确处理销毁导致之后有一个新 peer 再次创建的时候会 panic 。
在 3.0 11 版本中已经修复了,修复 PR :https://github.com/tikv/tikv/pull/6692
建议可以考虑升级集群版本。
读热点的问题,首先去查看了 TiKV-Details → RocksDB-kv → Block cache hit
发现并未出现大幅度下降或抖动,所以基本排除慢 SQL 问题,倾向于怀疑是小表的大量并发读取导致的。
刚好想起来最近查看 information_schema.slow_query 的时候,有个接口一直在频繁的拉数据,一分钟多次,其中用到了一个维表,就 show table regions 看了下该维表的 region id。
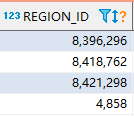
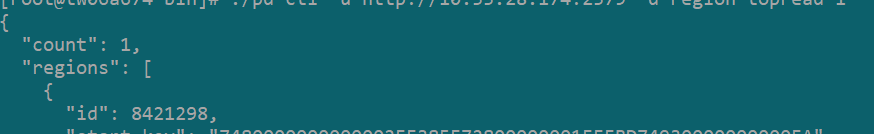
然后 pd-ctl -u http://{pd}:2379 -d region topread [limit] 看了下 topread 3 的 region id ,刚好全都是这个维表的 region id。
所以是不是可以确认,是频繁读取该维表 region,造成 热点,导致 tikv cpu 过高的?
如果是的话,该表已经有多个region了,该如何优化呢?
热点问题可以确认,但是是否是导致 tikv cpu 高的原因,可能需要通过解决热点问题来确认。
一般的热点问题可以通过手动 split region 来解决:
https://docs.pingcap.com/zh/tidb/stable/sql-statement-split-region#split-region-使用文档
但是如果业务访问的数据,是集中的某几行或者相邻的某几行,这类热点问题目前没有特别好的解决方式。因为 region 是以 range 维度进行划分的,如果数据比较集中的话,在数据库层如何打散 region 数据还是会集中在一个 region 上。
建议可以考虑升级到 4.0 版本,一方面是解决 tikv panic 的问题,一方面是 4.0 中有 dashboard 热力图的特性,对于定位热点问题更加直观。