【 TiDB 使用环境】
5.2.1版本
【概述】场景+问题概述
调度表t1更新操作频繁,主要是针对next_sync_time列,数据量大概150w,next_sync_time列有索引,执行以下查询,100行数据耗时40多秒,不符合预期
SELECT
 *
FROM
  t1
WHERE
  next_sync_time <= unix_timestamp(now())  limit 100
执行计划如下
id,estRows,task,"access object","operator info"
Projection_7,100.00,root,,"*"
└─IndexLookUp_17,100.00,root,,"limit embedded(offset:0, count:100)"
├─Limit_16(Build),100.00,cop[tikv],,"offset:0, count:100"
│ └─IndexRangeScan_14",100.00,cop[tikv],"t1, index:idx_next_sync_time(next_sync_time)","range:[-inf,1648524476], keep order:false, stats:pseudo"
└─TableRowIDScan_15(Probe),100.00,cop[tikv],table:t1,"keep order:false, stats:pseudo"
explain analyze结果中,scan_detail: {total_process_keys: 100, total_keys: 59893417, rocksdb: {delete_skipped_count: 216746, key_skipped_count: 60110102,可以看到key_skipped_count数量远远大于total_process_keys,很不合理,怀疑是历史版本的key太多导致查询慢
id,estRows,actRows,task,"access object","execution info","operator info",memory,disk
Projection_7,100.00,100,root,,"time:26.7s, loops:2, Concurrency:OFF","*","14.6 KB",N/A
└─IndexLookUp_17,100.00,100,root,,"time:26.7s, loops:2, index_task: {total_time: 26.7s, fetch_handle: 26.7s, build: 1.67µs, wait: 1.99µs}, table_task: {total_time: 2m13.5s, num: 1, concurrency: 5}","limit embedded(offset:0, count:100)","25.3 KB",N/A
├─Limit_16(Build),100.00,100,cop[tikv],,"time:26.7s, loops:1, cop_task: {num: 61, max: 669.3ms, min: 15.4ms, avg: 437.8ms, p95: 594.4ms, max_proc_keys: 100, p95_proc_keys: 0, tot_proc: 17.7s, tot_wait: 8.9s, rpc_num: 61, rpc_time: 26.7s, copr_cache_hit_ratio: 0.00}, tikv_task:{proc max:476ms, min:14ms, p80:338ms, p95:431ms, iters:63, tasks:61}, scan_detail: {total_process_keys: 100, total_keys: 59893417, rocksdb: {delete_skipped_count: 216746, key_skipped_count: 60110102, block: {cache_hit_count: 601, read_count: 32710, read_byte: 195.8 MB}}}","offset:0, count:100",N/A,N/A
"│ └─IndexRangeScan_14",100.00,100,cop[tikv],"table:t1, index:idx_next_sync_time(next_sync_time)","tikv_task:{proc max:476ms, min:14ms, p80:338ms, p95:431ms, iters:63, tasks:61}","range:[-inf,1648524562], keep order:false, stats:pseudo",N/A,N/A
└─TableRowIDScan_15(Probe),100.00,100,cop[tikv],table:t1,"time:2.69ms, loops:2, cop_task: {num: 1, max: 2.62ms, proc_keys: 100, tot_proc: 2ms, rpc_num: 1, rpc_time: 2.62ms, copr_cache_hit_ratio: 0.00}, tikv_task:{time:2ms, loops:3}, scan_detail: {total_process_keys: 100, total_keys: 799, rocksdb: {delete_skipped_count: 0, key_skipped_count: 689, block: {cache_hit_count: 229, read_count: 7, read_byte: 61.6 KB}}}","keep order:false, stats:pseudo",N/A,N/A
查看该表对应region的mvcc数据
tiup ctl:v5.2.1 tikv --host tikv_id:20160 scan --from=z"start_key" --limit 20 --show-cf lock,default,write
得到的信息示例
key: zt\200\000\000\000\000\000\000\377\t_i\200\000\000\000\000\377\000\000\001\001%\000\000\000\377\000\000\000\000\370\001sp\377_inbou\377n\377d_shipm\377\377ent_db\000\000\377\375\001erp_us\377er\377\000\000\000\000\000\377\000\000\000\367\000\000\000\000\373
	 write cf value: start_ts: 429825520266641416 commit_ts: 429825520279486472 short_value: 000000000000EA61

key: zt\200\000\000\000\000\000\000\377\t_i\200\000\000\000\000\377\000\000\001\001%\000\000\000\377\000\000\000\000\370\001sp\377_order\377_\377db\000\000\000\000\000\372\377\001erp_use\377r\377\000\000\000\000\000\000\377\000\000\367\000\000\000\000\000\372
	 write cf value: start_ts: 428640046555594757 commit_ts: 428640046555594761 short_value: 0000000000000001
解析start_ts时间,发现时间竟然是2021年的,怀疑是gc没有正常运行
» tso 428640046555594757
system:  2021-10-25 11:20:13.533 +0800 CST
logic:   5
» tso 429825520266641416
system:  2021-12-16 19:30:36.857 +0800 CST
logic:   8
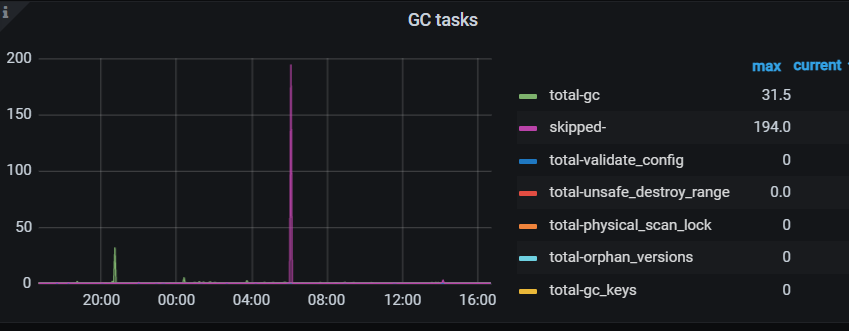
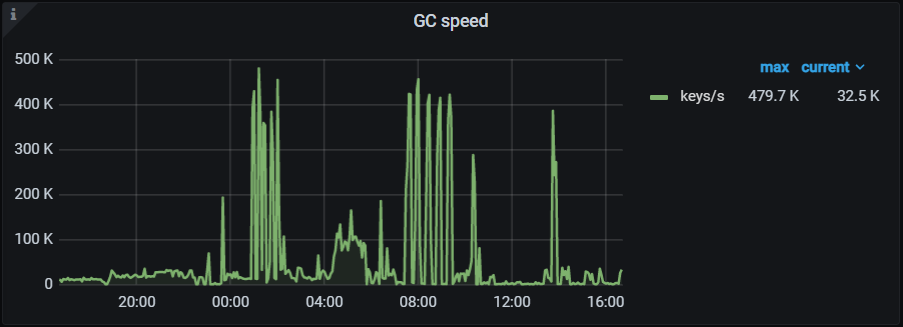
查看gc的参数和运行情况
SHOW config where type='tikv' AND name like '%enable-compaction-filter%'
查看gc.enable-compaction-filter参数值为false
执行SELECT * FROM mysql.tidb WHERE variable_name LIKE 'tikv_gc%'结果如下,可以看到gc是正常运行的
tikv_gc_scan_lock_mode	legacy	Mode of scanning locks, "physical" or "legacy"
tikv_gc_safe_point	20220328-11:36:36 +0800	All versions after safe point can be accessed. (DO NOT EDIT)
tikv_gc_run_interval	10m0s	GC run interval, at least 10m, in Go format.
tikv_gc_mode	distributed	Mode of GC, "central" or "distributed"
tikv_gc_life_time	24h	All versions within life time will not be collected by GC, at least 10m, in Go format.
tikv_gc_leader_uuid	5fda1fdc1880010	Current GC worker leader UUID. (DO NOT EDIT)
tikv_gc_leader_lease	20220329-11:39:36 +0800	Current GC worker leader lease. (DO NOT EDIT)
tikv_gc_leader_desc	host:tidb-tidb-prd, pid:21338, start at 2022-03-08 15:47:36.711491545 +0800 CST m=+1.602036133	Host name and pid of current GC leader. (DO NOT EDIT)
tikv_gc_last_run_time	20220329-11:36:36 +0800	The time when last GC starts. (DO NOT EDIT)
tikv_gc_enable	true	Current GC enable status
tikv_gc_auto_concurrency	true	Let TiDB pick the concurrency automatically. If set false, tikv_gc_concurrency will be used
无法定位是什么原因导致的查询慢
【背景】做过哪些操作
无
【现象】业务和数据库现象
只是特定的这几张调度表,SQL查询特别慢,其它表正常
【业务影响】
【TiDB 版本】
5.2.1