grafana监控:
参考文档:
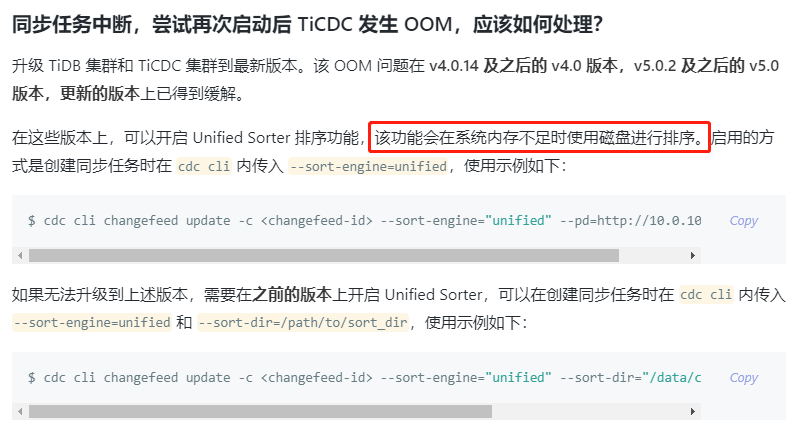
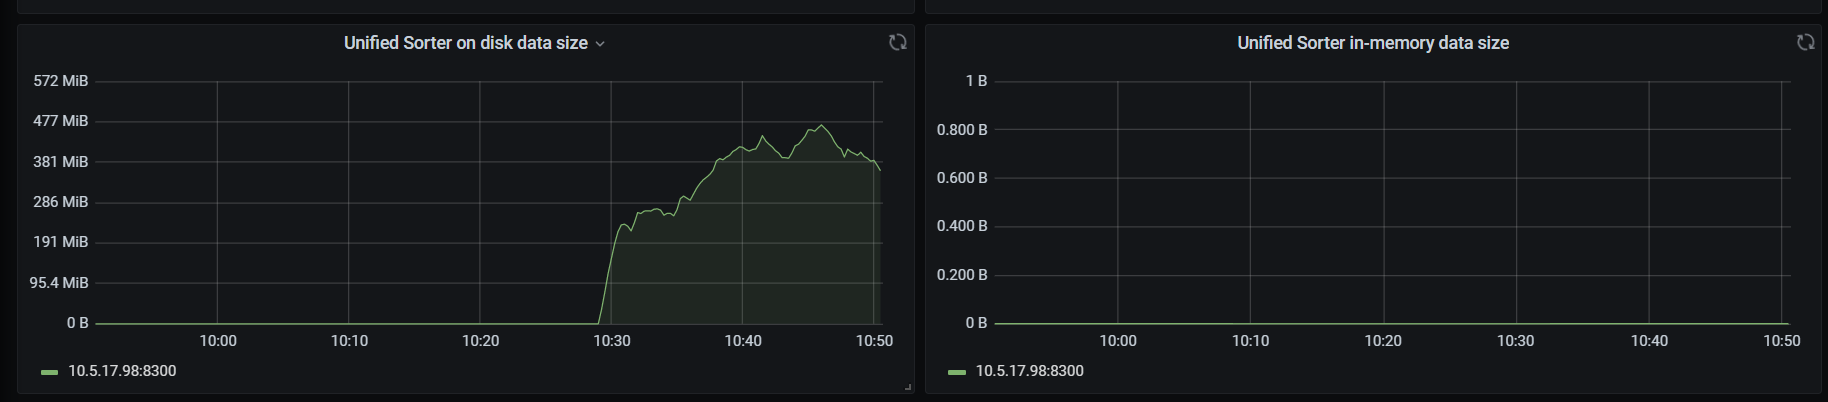
unified :优先使用内存排序,内存不足时则自动使用硬盘暂存数据。该选项默认开启
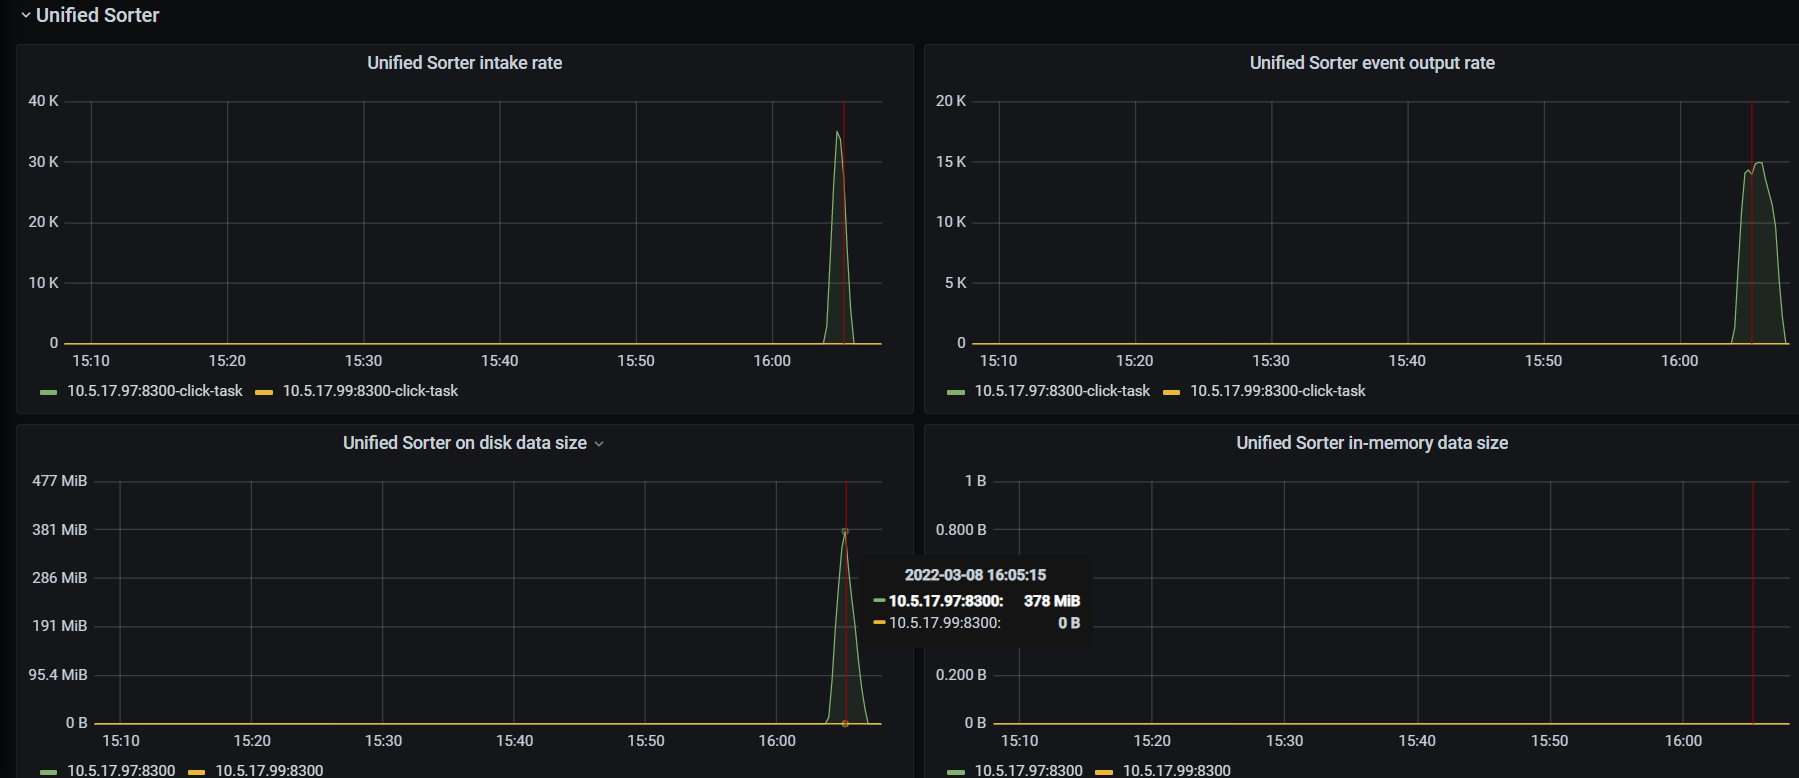
看上面grafana监控貌似unified不会使用内存排序,而是直接使用disk排序了?
grafana监控:
参考文档:
unified :优先使用内存排序,内存不足时则自动使用硬盘暂存数据。该选项默认开启
看上面grafana监控貌似unified不会使用内存排序,而是直接使用disk排序了?
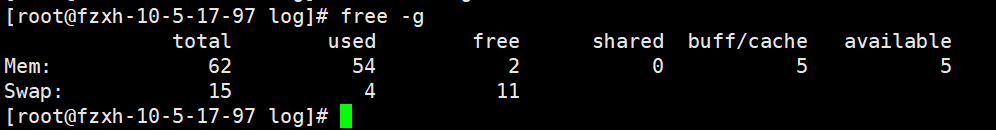
内存64GB,目前才用了1.5GB
检查 changefeed 是否开启 unified sorter
cdc cli --pd=“http://ip:2379” changefeed query --changefeed-id=xxx-task | grep ‘sort-engine’
如果开启了,检查下 sorter 相关监控 metrics 有没有正常输出
curl ip:8300/metrics | grep ticdc_sorter
有监控
# HELP ticdc_sorter_consume_count the number of events consumed by the sorter
# TYPE ticdc_sorter_consume_count counter
ticdc_sorter_consume_count{capture="10.5.17.97:8300",changefeed="click-task",type="kv"} 9.612072e+06
ticdc_sorter_consume_count{capture="10.5.17.97:8300",changefeed="click-task",type="resolved"} 1.897912e+06
# HELP ticdc_sorter_event_count the number of events output by the sorter
# TYPE ticdc_sorter_event_count counter
ticdc_sorter_event_count{capture="10.5.17.97:8300",changefeed="click-task",type="kv"} 9.612072e+06
ticdc_sorter_event_count{capture="10.5.17.97:8300",changefeed="click-task",type="resolved"} 550409
# HELP ticdc_sorter_flush_count_histogram Bucketed histogram of the number of events in individual flushes performed by the sorter
# TYPE ticdc_sorter_flush_count_histogram histogram
ticdc_sorter_flush_count_histogram_bucket{capture="10.5.17.97:8300",changefeed="click-task",le="4"} 1.893508e+06
ticdc_sorter_flush_count_histogram_bucket{capture="10.5.17.97:8300",changefeed="click-task",le="16"} 1.893535e+06
ticdc_sorter_flush_count_histogram_bucket{capture="10.5.17.97:8300",changefeed="click-task",le="64"} 1.893625e+06
ticdc_sorter_flush_count_histogram_bucket{capture="10.5.17.97:8300",changefeed="click-task",le="256"} 1.893953e+06
ticdc_sorter_flush_count_histogram_bucket{capture="10.5.17.97:8300",changefeed="click-task",le="1024"} 1.894837e+06
ticdc_sorter_flush_count_histogram_bucket{capture="10.5.17.97:8300",changefeed="click-task",le="4096"} 1.897728e+06
ticdc_sorter_flush_count_histogram_bucket{capture="10.5.17.97:8300",changefeed="click-task",le="16384"} 1.898107e+06
ticdc_sorter_flush_count_histogram_bucket{capture="10.5.17.97:8300",changefeed="click-task",le="65536"} 1.898111e+06
ticdc_sorter_flush_count_histogram_bucket{capture="10.5.17.97:8300",changefeed="click-task",le="262144"} 1.898115e+06
ticdc_sorter_flush_count_histogram_bucket{capture="10.5.17.97:8300",changefeed="click-task",le="1.048576e+06"} 1.898115e+06
ticdc_sorter_flush_count_histogram_bucket{capture="10.5.17.97:8300",changefeed="click-task",le="+Inf"} 1.898115e+06
ticdc_sorter_flush_count_histogram_sum{capture="10.5.17.97:8300",changefeed="click-task"} 1.1509984e+07
ticdc_sorter_flush_count_histogram_count{capture="10.5.17.97:8300",changefeed="click-task"} 1.898115e+06
# HELP ticdc_sorter_in_memory_data_size_gauge the amount of pending data stored in-memory by the sorter
# TYPE ticdc_sorter_in_memory_data_size_gauge gauge
ticdc_sorter_in_memory_data_size_gauge{capture="10.5.17.97:8300"} 0
# HELP ticdc_sorter_merge_count_histogram Bucketed histogram of the number of events in individual merges performed by the sorter
# TYPE ticdc_sorter_merge_count_histogram histogram
ticdc_sorter_merge_count_histogram_bucket{capture="10.5.17.97:8300",changefeed="click-task",le="16"} 15
ticdc_sorter_merge_count_histogram_bucket{capture="10.5.17.97:8300",changefeed="click-task",le="64"} 18
ticdc_sorter_merge_count_histogram_bucket{capture="10.5.17.97:8300",changefeed="click-task",le="256"} 18
ticdc_sorter_merge_count_histogram_bucket{capture="10.5.17.97:8300",changefeed="click-task",le="1024"} 20
ticdc_sorter_merge_count_histogram_bucket{capture="10.5.17.97:8300",changefeed="click-task",le="4096"} 24
ticdc_sorter_merge_count_histogram_bucket{capture="10.5.17.97:8300",changefeed="click-task",le="16384"} 40
ticdc_sorter_merge_count_histogram_bucket{capture="10.5.17.97:8300",changefeed="click-task",le="65536"} 43
ticdc_sorter_merge_count_histogram_bucket{capture="10.5.17.97:8300",changefeed="click-task",le="262144"} 48
ticdc_sorter_merge_count_histogram_bucket{capture="10.5.17.97:8300",changefeed="click-task",le="1.048576e+06"} 54
ticdc_sorter_merge_count_histogram_bucket{capture="10.5.17.97:8300",changefeed="click-task",le="4.194304e+06"} 57
ticdc_sorter_merge_count_histogram_bucket{capture="10.5.17.97:8300",changefeed="click-task",le="+Inf"} 57
ticdc_sorter_merge_count_histogram_sum{capture="10.5.17.97:8300",changefeed="click-task"} 9.61649e+06
ticdc_sorter_merge_count_histogram_count{capture="10.5.17.97:8300",changefeed="click-task"} 57
# HELP ticdc_sorter_merger_start_ts_gauge the start TS of each merge in the sorter
# TYPE ticdc_sorter_merger_start_ts_gauge gauge
ticdc_sorter_merger_start_ts_gauge{capture="10.5.17.97:8300",changefeed="click-task"} 1.646720735788e+12
# HELP ticdc_sorter_on_disk_data_size_gauge the amount of pending data stored on-disk by the sorter
# TYPE ticdc_sorter_on_disk_data_size_gauge gauge
ticdc_sorter_on_disk_data_size_gauge{capture="10.5.17.97:8300"} 0
# HELP ticdc_sorter_open_file_count_gauge the number of open file descriptors held by the sorter
# TYPE ticdc_sorter_open_file_count_gauge gauge
ticdc_sorter_open_file_count_gauge{capture="10.5.17.97:8300"} 0
# HELP ticdc_sorter_resolved_ts_gauge the resolved ts of the sorter
# TYPE ticdc_sorter_resolved_ts_gauge gauge
ticdc_sorter_resolved_ts_gauge{capture="10.5.17.97:8300",changefeed="click-task"} 1.646720735788e+12
我看cdc启动的时候max-memory-percentage是默认设置为30么?
[2022/03/01 14:51:37.760 +08:00] [INFO] [server.go:67] ["creating CDC server"] [pd-addrs="[http://10.5.17.97:2379,http://10.5.17.98:2379,http://10.5.17.99:2379]"] [config="{\"addr\":\"0.0.0.0:8300\",\"advertise-addr\":\"10.5.17.97:8300\",\"log-file\":\"/data/cdc/log/cdc.log\",\"log-level\":\"info\",\"log\":{\"file\":{\"max-size\":300,\"max-days\":0,\"max-backups\":0}},\"data-dir\":\"/data/cdc/store\",\"gc-ttl\":86400,\"tz\":\"System\",\"capture-session-ttl\":10,\"owner-flush-interval\":200000000,\"processor-flush-interval\":100000000,\"sorter\":{\"num-concurrent-worker\":4,\"chunk-size-limit\":134217728,\"max-memory-percentage\":30,\"max-memory-consumption\":17179869184,\"num-workerpool-goroutine\":16,\"sort-dir\":\"/tmp/sorter\"},\"security\":{\"ca-path\":\"\",\"cert-path\":\"\",\"key-path\":\"\",\"cert-allowed-cn\":null},\"per-table-memory-quota\":10485760,\"kv-client\":{\"worker-concurrent\":8,\"worker-pool-size\":0,\"region-scan-limit\":40}}"]
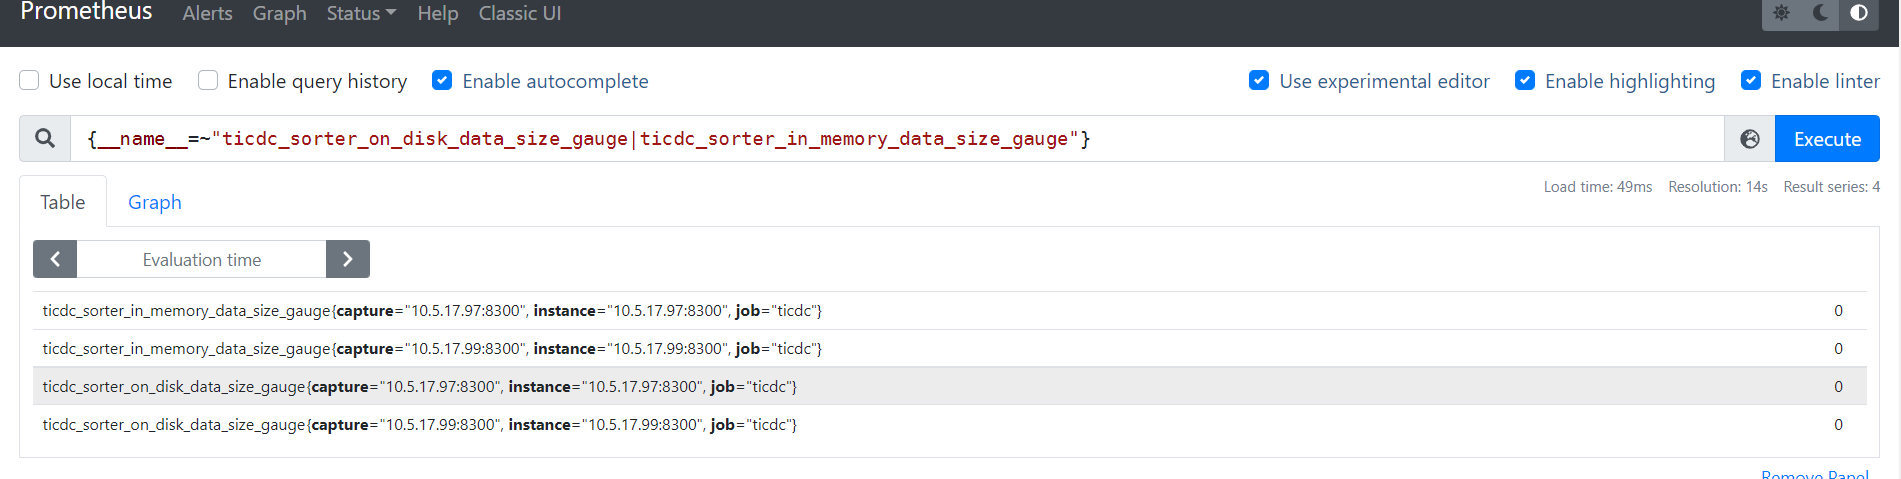
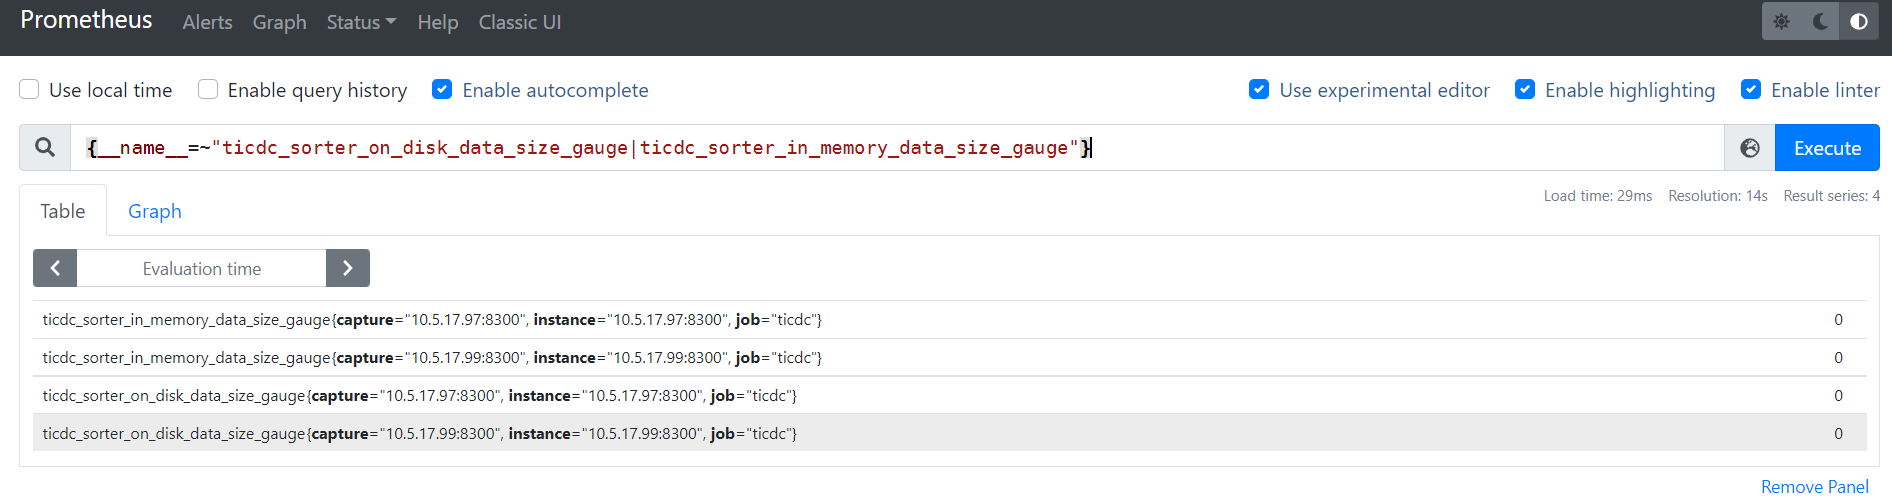
查一下监控截图的那段时间的 prometheus 这两个 metric 是多少
ticdc_sorter_in_memory_data_size_gauge
ticdc_sorter_on_disk_data_size_gauge
现在都是 0 ,截图中的现象能复现吗
系统内存压力过大的时候不使用内存排序是预期现象。上面提到的 max-memory-percentage = 30 意思是如果系统已经被占用的内存大于 30%,那么就不会使用内存排序了。如果您的内存容量较大,这个配置项的 30 默认值会显得过小,您可以自行调整一下。这个默认值是最保守的,为了避免 TiCDC 在小内存机型上 OOM。
好的多谢回复
我看tiup部署cdc时候没有max-memory-percentage配置,是直接手动修改么?
“max-memory-percentage = 30 意思是如果系统已经被占用的内存大于 30%,那么就不会使用内存排序了”
请问下这里是指 ticdc 使用的内存大小 占 系统内存的30% 还是 系统的内存总使用率达到30% ?
此话题已在最后回复的 1 分钟后被自动关闭。不再允许新回复。