背景:
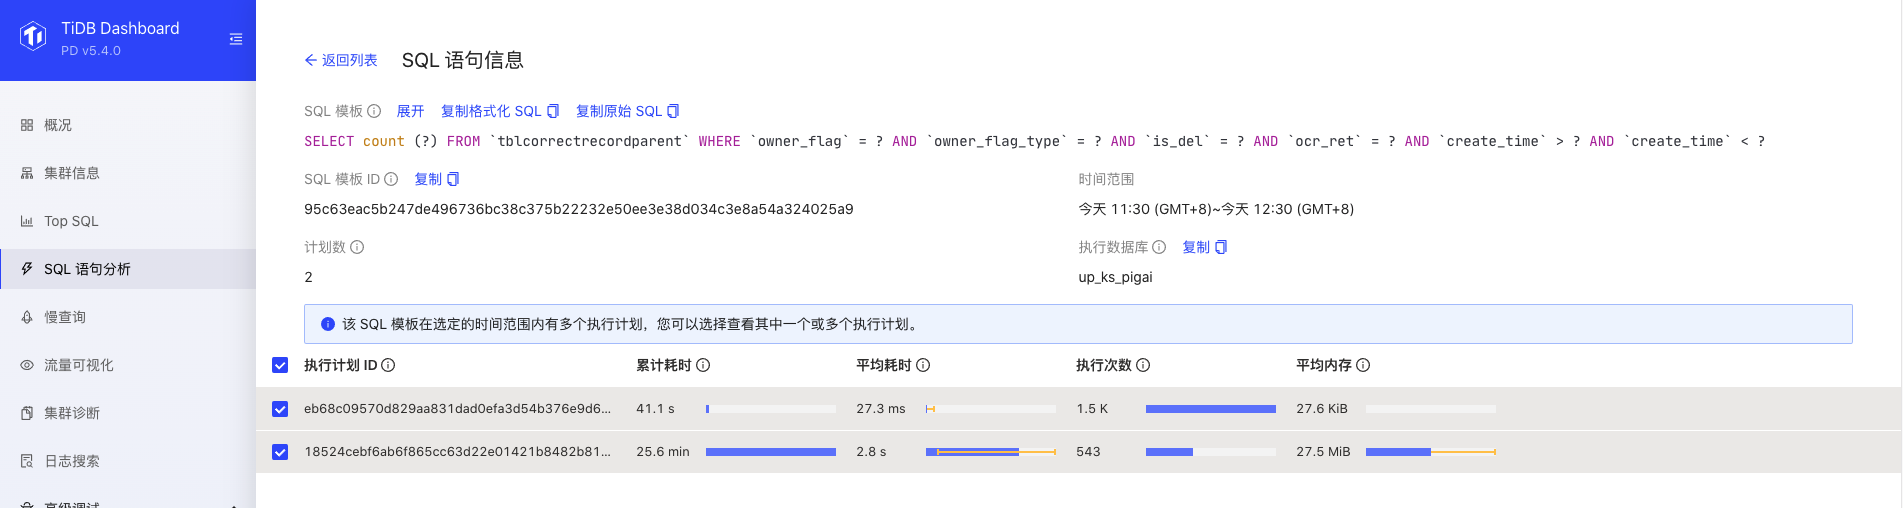
tidb 从5.3.0 升级到5.4.0 之后,业务的查询sql 耗时异常,执行计划显示也不太正常。
当期集群GC 时间为72h, 并且每天凌晨的0点到8点在删除半年前数据,每天删除7kw 。
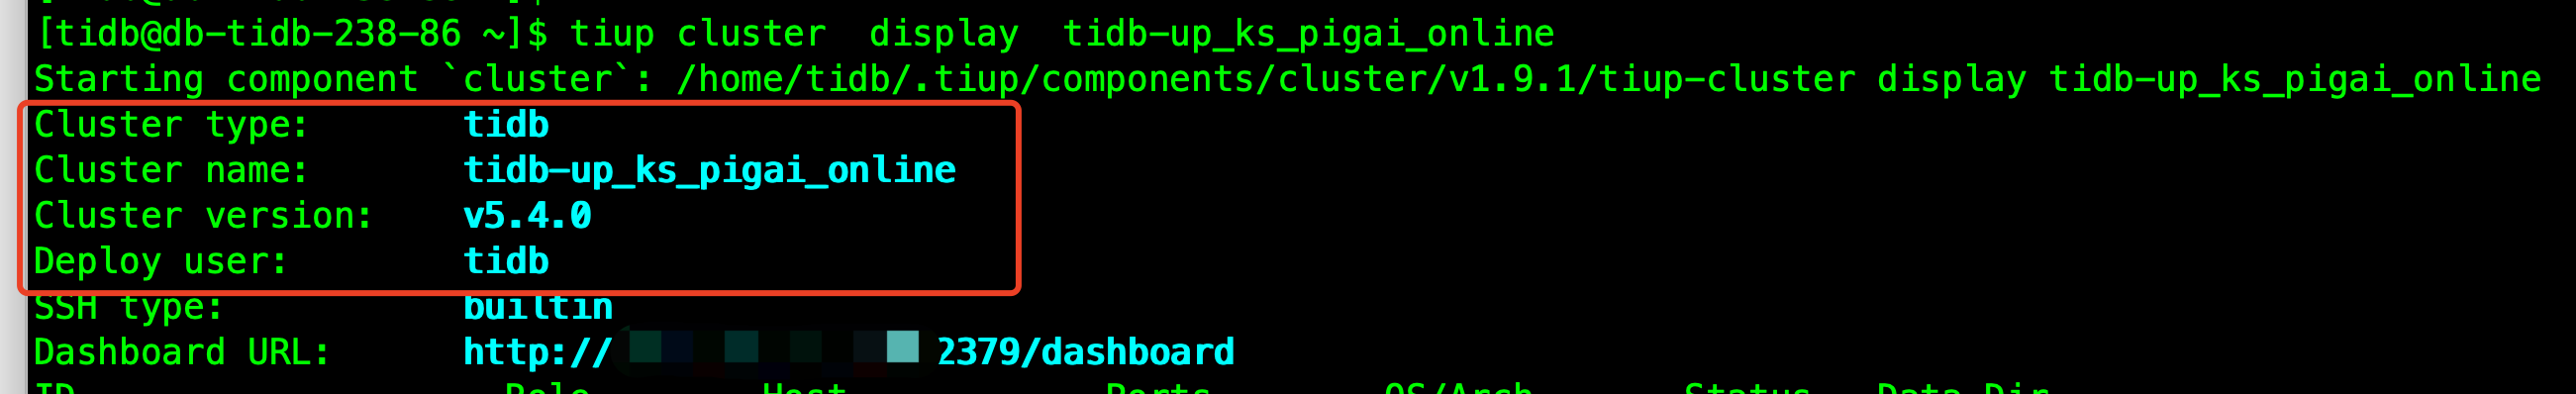
集群具体信息如下:
  tidb:
    log.slow-threshold: 200
    mem-quota-query: 1073741824
    oom-action: cancel
  tikv:
    coprocessor.region-max-keys: 3120000
    coprocessor.region-max-size: 384MB
    coprocessor.region-split-keys: 2000000
    coprocessor.region-split-size: 256MB
    raftstore.capacity: 1536G
    raftstore.hibernate-regions: false
    raftstore.store-pool-size: 4
    readpool.coprocessor.use-unified-pool: true
    readpool.storage.use-unified-pool: false
    readpool.unified.max-thread-count: 24
    storage.block-cache.capacity: 48G
请求的sql 情况为
MySQL [up_ks_pigai]> explain analyze  SELECT count(1) FROM `tblCorrectRecordParent` WHERE owner_flag='D4978A7C8C36EA0D7803CF6E96945CEE|0' AND owner_flag_type=0 AND is_del=0 AND ocr_ret=0 AND create_time>1645660800 AND create_time<1645747200;
+----------------------------------+---------+---------+-----------+------------------------------------------------------------------+--------------------------------------------------------------------------------------------------------------------------------------------------------------------------------------------------------------------------------------------------------------------------------------------------------------------------------------------------------------------------------------------------------------------------------------------------------------------------------------------------------------------------------------------------------------------------+---------------------------------------------------------------------------------------------------------------------------------------------------------------------------------------------------------------------------------------------------------+---------+------+
| id                               | estRows | actRows | task      | access object                                                    | execution info                                                                                                                                                                                                                                                                                                                                                                                                                                                                                                                                                           | operator info                                                                                                                                                                                                                                           | memory  | disk |
+----------------------------------+---------+---------+-----------+------------------------------------------------------------------+--------------------------------------------------------------------------------------------------------------------------------------------------------------------------------------------------------------------------------------------------------------------------------------------------------------------------------------------------------------------------------------------------------------------------------------------------------------------------------------------------------------------------------------------------------------------------+---------------------------------------------------------------------------------------------------------------------------------------------------------------------------------------------------------------------------------------------------------+---------+------+
| StreamAgg_10                     | 1.00    | 1       | root      |                                                                  | time:3.3s, loops:2                                                                                                                                                                                                                                                                                                                                                                                                                                                                                                                                                       | funcs:count(1)->Column#14                                                                                                                                                                                                                               | 2.82 KB | N/A  |
| └─IndexLookUp_33                 | 0.00    | 27      | root      |                                                                  | time:3.3s, loops:2, index_task: {total_time: 3.23s, fetch_handle: 715.5ms, build: 350.9µs, wait: 2.51s}, table_task: {total_time: 14s, num: 190, concurrency: 5}                                                                                                                                                                                                                                                                                                                                                                                                         |                                                                                                                                                                                                                                                         | 29.2 MB | N/A  |
|   ├─IndexRangeScan_30(Build)     | 0.00    | 3818530 | cop[tikv] | table:tblCorrectRecordParent, index:idx_create_time(create_time) | time:524.3ms, loops:3733, cop_task: {num: 3, max: 850.1ms, min: 541.4µs, avg: 512.6ms, p95: 850.1ms, max_proc_keys: 1999993, p95_proc_keys: 1999993, tot_proc: 1.49s, tot_wait: 1ms, rpc_num: 3, rpc_time: 1.54s, copr_cache_hit_ratio: 0.33}, tikv_task:{proc max:784ms, min:118ms, p80:784ms, p95:784ms, iters:3743, tasks:3}, scan_detail: {total_process_keys: 3533482, total_process_keys_size: 162540172, total_keys: 3533494, rocksdb: {delete_skipped_count: 0, key_skipped_count: 3533492, block: {cache_hit_count: 2332, read_count: 0, read_byte: 0 Bytes}}}  | range:(1645660800,1645747200), keep order:false                                                                                                                                                                                                         | N/A     | N/A  |
|   └─Selection_32(Probe)          | 0.00    | 27      | cop[tikv] |                                                                  | time:11.2s, loops:204, cop_task: {num: 6344, max: 50.8ms, min: 439.1µs, avg: 20.7ms, p95: 32.5ms, max_proc_keys: 745, p95_proc_keys: 680, tot_proc: 2m1.1s, tot_wait: 1.5s, rpc_num: 6344, rpc_time: 2m11s, copr_cache_hit_ratio: 0.00}, tikv_task:{proc max:48ms, min:0s, p80:23ms, p95:29ms, iters:30752, tasks:6344}, scan_detail: {total_process_keys: 3818530, total_process_keys_size: 21817236467, total_keys: 3940334, rocksdb: {delete_skipped_count: 5, key_skipped_count: 452121, block: {cache_hit_count: 47111188, read_count: 3258, read_byte: 28.3 MB}}}  | eq(up_ks_pigai.tblcorrectrecordparent.is_del, 0), eq(up_ks_pigai.tblcorrectrecordparent.ocr_ret, 0), eq(up_ks_pigai.tblcorrectrecordparent.owner_flag, "D4978A7C8C36EA0D7803CF6E96945CEE|0"), eq(up_ks_pigai.tblcorrectrecordparent.owner_flag_type, 0) | N/A     | N/A  |
|     └─TableRowIDScan_31          | 0.00    | 3818530 | cop[tikv] | table:tblCorrectRecordParent                                     | tikv_task:{proc max:48ms, min:0s, p80:23ms, p95:29ms, iters:30752, tasks:6344}                                                                                                                                                                                                                                                                                                                                                                                                                                                                                           | keep order:false                                                                                                                                                                                                                                        | N/A     | N/A  |
+----------------------------------+---------+---------+-----------+------------------------------------------------------------------+--------------------------------------------------------------------------------------------------------------------------------------------------------------------------------------------------------------------------------------------------------------------------------------------------------------------------------------------------------------------------------------------------------------------------------------------------------------------------------------------------------------------------------------------------------------------------+---------------------------------------------------------------------------------------------------------------------------------------------------------------------------------------------------------------------------------------------------------+---------+------+
--- 执行时间为: 5 rows in set (3.15 sec)


表结构为
 CREATE TABLE `tblCorrectRecordParent` (
  `id` bigint(20) unsigned NOT NULL /*T![auto_rand] AUTO_RANDOM(5) */ COMMENT '主键',
  `sid` bigint(20) unsigned NOT NULL COMMENT '',
  `app_id` varchar(64) NOT NULL DEFAULT '' COMMENT '业务线',
  `owner_flag` varchar(50) NOT NULL DEFAULT '' COMMENT '所属者标志',
  `owner_flag_type` tinyint(4) unsigned NOT NULL DEFAULT '0' COMMENT '所属标志是cuid还是uid,1表示uid,0表示cuid',
  `query_content` varbinary(500) NOT NULL DEFAULT '[]' COMMENT '请求内容',
  `ocr_ret` int(11) NOT NULL DEFAULT '0' COMMENT 'ocr返回状态码',
  `ocr_content` varbinary(50000) NOT NULL DEFAULT '' COMMENT 'ocr识别结果',
  `ocr_content_version` tinyint(4) NOT NULL DEFAULT '0' COMMENT '三端统一版本',
  `is_del` tinyint(4) unsigned NOT NULL DEFAULT '0' COMMENT '是否删除1表示已经删除',
  `create_time` int(11) NOT NULL DEFAULT '0' COMMENT '创建时间',
  `update_time` int(11) NOT NULL DEFAULT '0' COMMENT '更新时间',
  `customer_sid` bigint(20) unsigned NOT NULL DEFAULT '0' COMMENT '业务端sid',
  PRIMARY KEY (`id`) /*T![clustered_index] CLUSTERED */,
  KEY `idx_owner_flag` (`owner_flag`),
  KEY `idx_create_time` (`create_time`),
  UNIQUE KEY `idx_uniq_sid` (`sid`)
) ENGINE=InnoDB DEFAULT CHARSET=utf8 COLLATE=utf8_bin /*T![auto_rand_base] AUTO_RANDOM_BASE=1699187652 */ COMMENT='’
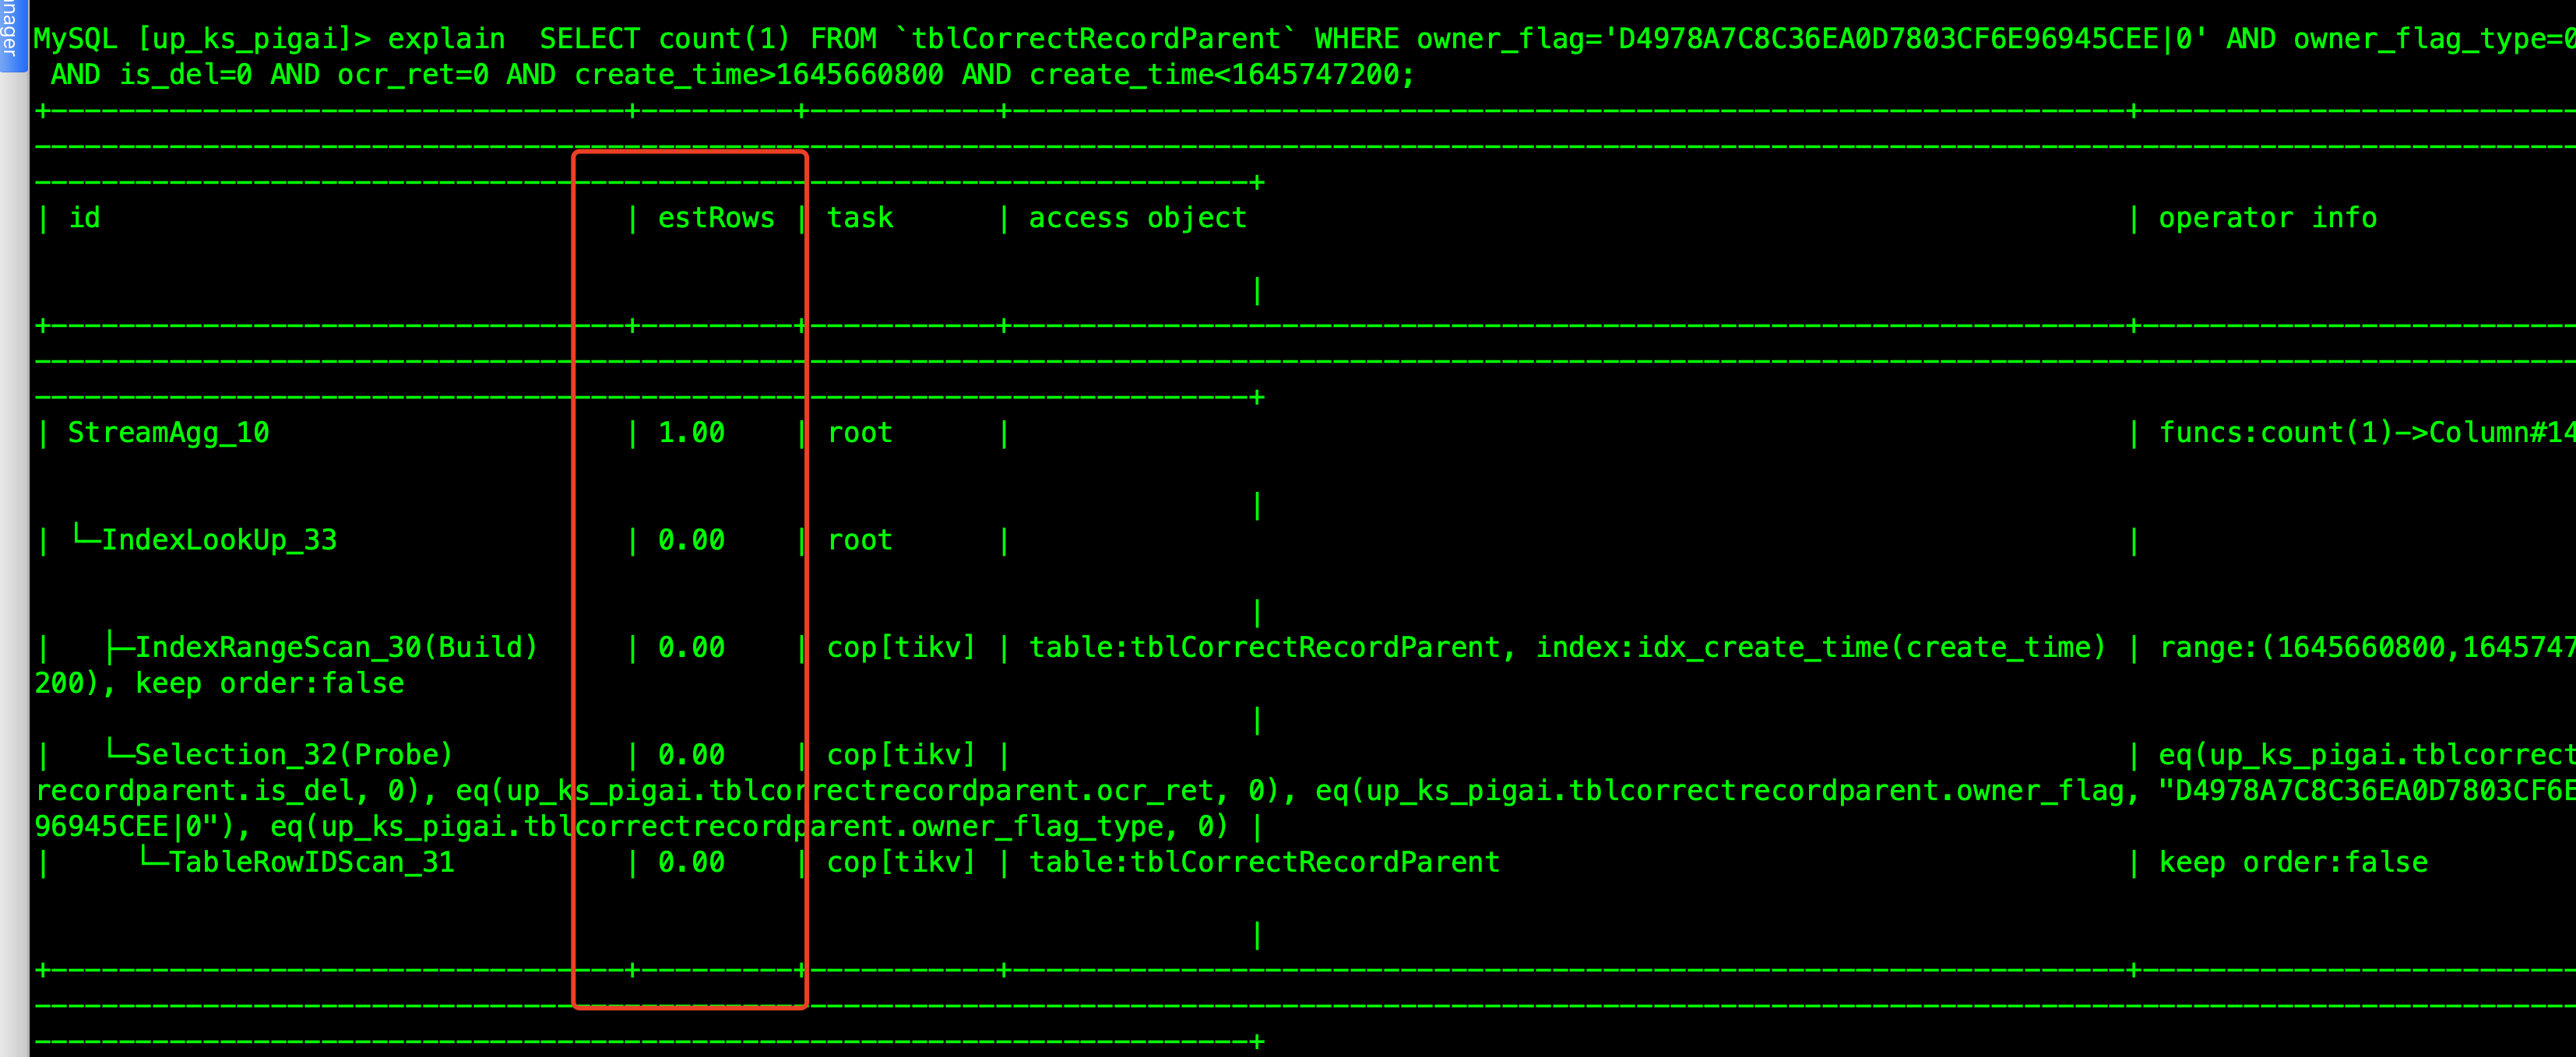
查看执行计划时也没有显示预估的行数
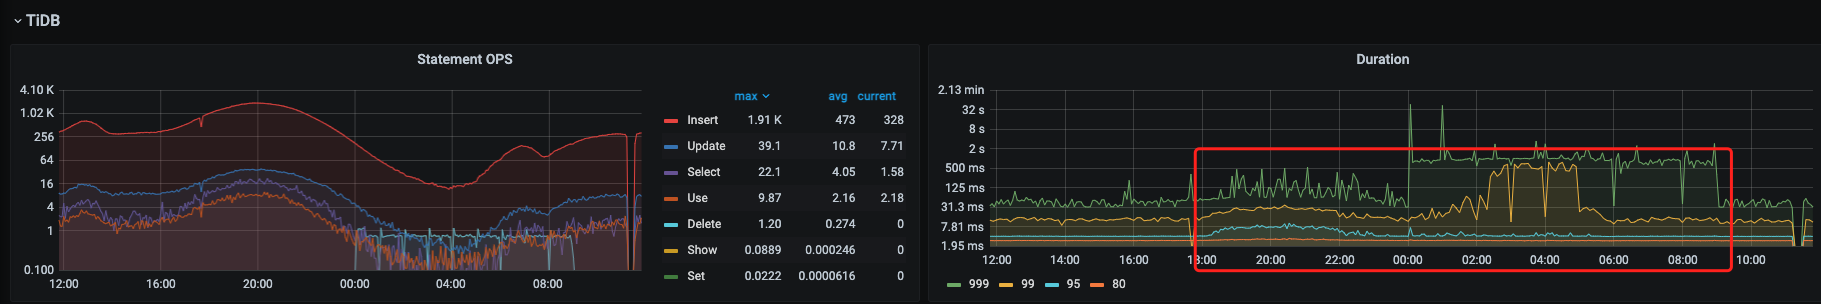
集群的耗时监控图如下,红框中的时间点是业务查询耗时增加,业务会超时的时间段