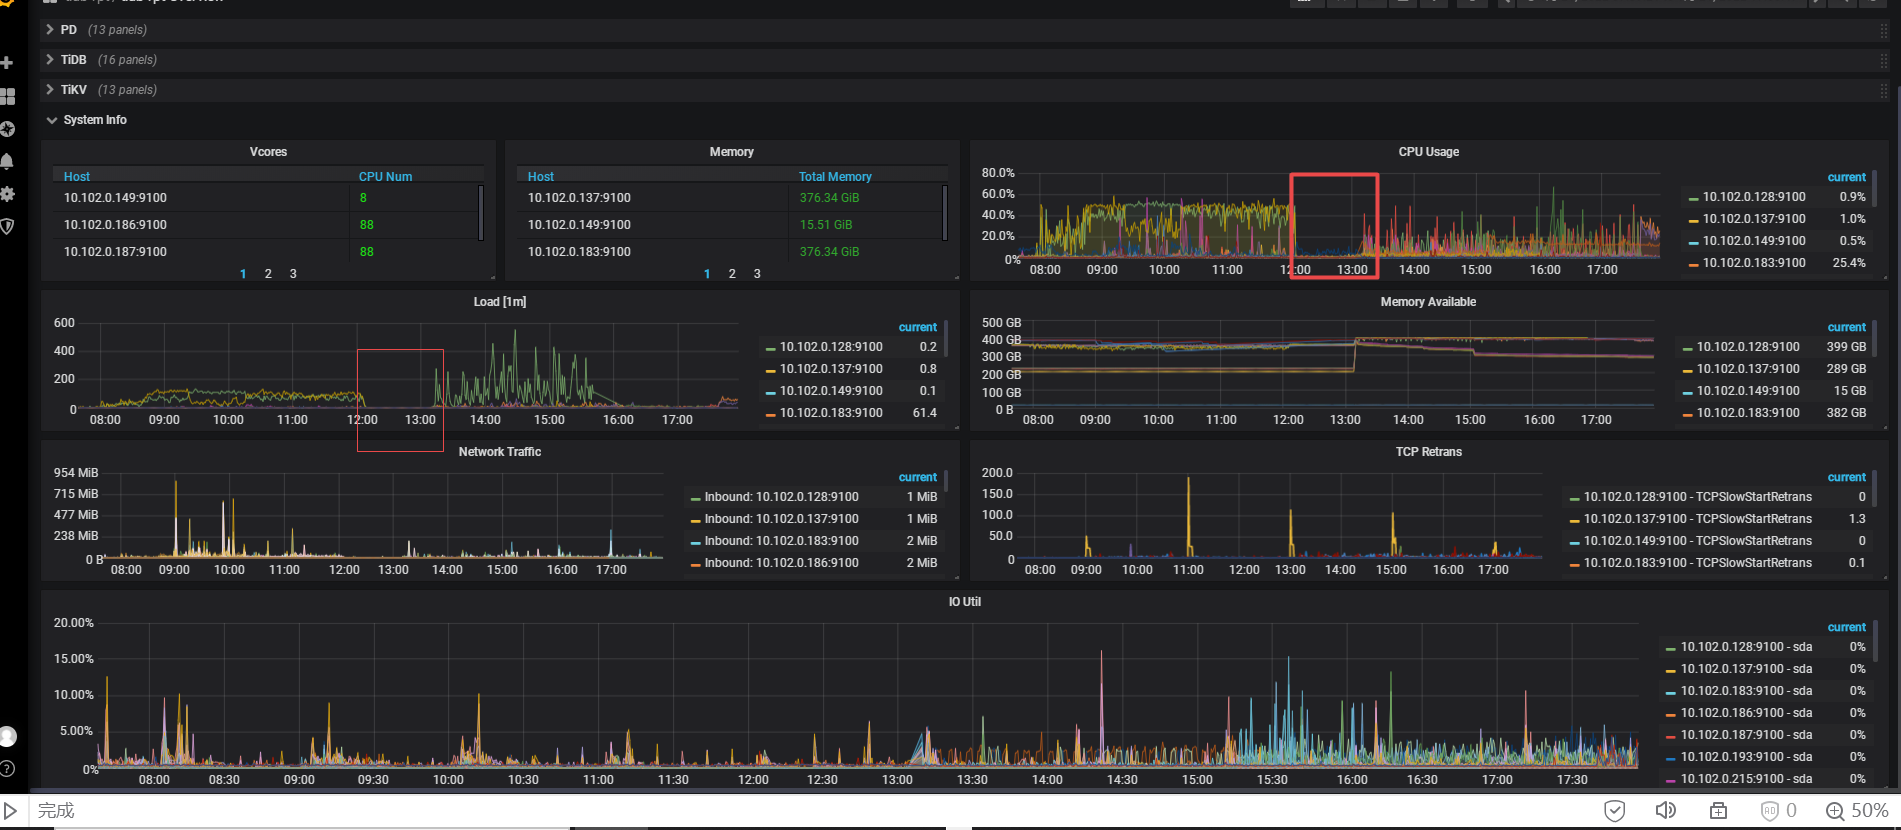
看了下日志,有几点疑问:
首先是PD的日志:
[2022/01/21 13:05:13.983 +08:00] [INFO] [operator_controller.go:626] ["send schedule command"] [region-id=32594676] [step="remove peer on store 5"] [source="active push"]
[2022/01/21 13:05:14.987 +08:00] [WARN] [heartbeat_streams.go:138] ["send keepalive message fail, store maybe disconnected"] [target-store-id=11585778] [error=EOF]
[2022/01/21 13:05:14.987 +08:00] [WARN] [heartbeat_streams.go:138] ["send keepalive message fail, store maybe disconnected"] [target-store-id=5] [error=EOF]
[2022/01/21 13:05:14.987 +08:00] [WARN] [heartbeat_streams.go:138] ["send keepalive message fail, store maybe disconnected"] [target-store-id=4] [error=EOF]
[2022/01/21 13:05:16.097 +08:00] [INFO] [main.go:125] ["Got signal to exit"] [signal=terminated]
[2022/01/21 13:05:16.097 +08:00] [INFO] [server.go:526] ["server is closed, exit metrics loop"]
[2022/01/21 13:05:16.097 +08:00] [INFO] [server.go:551] ["server is closed, exist encryption key manager loop"]
[2022/01/21 13:05:16.097 +08:00] [INFO] [coordinator.go:737] ["scheduler has been stopped"] [scheduler-name=balance-hot-region-scheduler] [error="context canceled"]
[2022/01/21 13:05:16.097 +08:00] [INFO] [lease.go:142] ["stop lease keep alive worker"] [purpose="pd leader election"]
显示是4、5、11585778三个store一起失去连接
紧接着pd里的etcd发生重选举:(还有重启?)
[2022/01/21 13:05:16.100 +08:00] [INFO] [raft.go:713] ["1ae90ad07220de9a became candidate at term 27"]
...
[2022/01/21 13:05:17.092 +08:00] [INFO] [leadership.go:120] ["write leaderData to leaderPath ok"] [leaderPath=/pd/6971708166954465753/leader] [purpose="pd leader election"]
[2022/01/21 13:05:17.092 +08:00] [INFO] [server.go:1231] ["campaign pd leader ok"] [campaign-pd-leader-name=pd-10.102.0.82-2379]
[2022/01/21 13:05:17.092 +08:00] [INFO] [server.go:1238] ["initializing the global TSO allocator"]
...
[2022/01/21 13:05:17.120 +08:00] [INFO] [server.go:1301] ["server is closed"]
[2022/01/21 13:05:17.121 +08:00] [INFO] [cluster.go:317] ["metrics are reset"]
[2022/01/21 13:05:17.121 +08:00] [INFO] [server.go:111] ["region syncer has been stopped"]
[2022/01/21 13:05:17.122 +08:00] [INFO] [cluster.go:319] ["background jobs has been stopped"]
[2022/01/21 13:05:17.122 +08:00] [INFO] [cluster.go:367] ["raftcluster is stopped"]
[2022/01/21 13:05:17.122 +08:00] [INFO] [tso.go:378] ["reset the timestamp in memory"]
[2022/01/21 13:05:17.123 +08:00] [INFO] [server.go:1163] ["server is closed, return pd leader loop"]
...
[2022/01/21 13:06:47.898 +08:00] [INFO] [util.go:41] ["Welcome to Placement Driver (PD)"]
[2022/01/21 13:06:47.898 +08:00] [INFO] [util.go:42] [PD] [release-version=v5.0.3]
PD leader从3变成了1,同时连上了store :1、4、5、11585778
[2022/01/21 13:07:38.957 +08:00] [INFO] [util.go:77] ["load cluster version"] [cluster-version=5.0.3]
[2022/01/21 13:07:38.957 +08:00] [INFO] [server.go:1282] ["PD cluster leader is ready to serve"] [pd-leader-name=pd-10.102.0.82-2379]
[2022/01/21 13:07:38.959 +08:00] [INFO] [grpc_service.go:356] ["put store ok"] [store="id:4 address:\"10.102.0.137:20160\" version:\"5.0.3\" status_address:\"10.102.0.137:20180\" git_hash:\"63b63edfbb9bbf8aeb875aad28c59f082eeb55d4\" start_timestamp:1642741614 deploy_path:\"/data1/tidb-rpt/tikv/bin\" "]
[2022/01/21 13:07:38.959 +08:00] [INFO] [util.go:77] ["load cluster version"] [cluster-version=5.0.3]
[2022/01/21 13:07:39.110 +08:00] [INFO] [grpc_service.go:356] ["put store ok"] [store="id:1 address:\"10.102.0.227:20160\" version:\"5.0.3\" status_address:\"10.102.0.227:20180\" git_hash:\"63b63edfbb9bbf8aeb875aad28c59f082eeb55d4\" start_timestamp:1642741615 deploy_path:\"/data1/tidb-rpt/tikv/bin\" "]
[2022/01/21 13:07:39.110 +08:00] [INFO] [util.go:77] ["load cluster version"] [cluster-version=5.0.3]
[2022/01/21 13:07:39.154 +08:00] [INFO] [grpc_service.go:356] ["put store ok"] [store="id:5 address:\"10.102.0.186:20160\" version:\"5.0.3\" status_address:\"10.102.0.186:20180\" git_hash:\"63b63edfbb9bbf8aeb875aad28c59f082eeb55d4\" start_timestamp:1642741615 deploy_path:\"/data1/tidb-rpt/tikv/bin\" "]
[2022/01/21 13:07:39.154 +08:00] [INFO] [util.go:77] ["load cluster version"] [cluster-version=5.0.3]
[2022/01/21 13:07:39.906 +08:00] [INFO] [grpc_service.go:356] ["put store ok"] [store="id:11585778 address:\"10.102.0.193:20160\" version:\"5.0.3\" status_address:\"10.102.0.193:20180\" git_hash:\"63b63edfbb9bbf8aeb875aad28c59f082eeb55d4\" start_timestamp:1642741614 deploy_path:\"/data1/tidb-rpt/tikv/bin\" "]
[2022/01/21 13:07:39.906 +08:00] [INFO] [util.go:77] ["load cluster version"] [cluster-version=5.0.3]
但没连上tidb-server?
[2022/01/21 13:07:51.908 +08:00] [WARN] [forwarder.go:118] ["Unable to resolve connection address since no alive TiDB instance"]
[2022/01/21 13:07:51.908 +08:00] [ERROR] [tidb_requests.go:74] ["fail to send schema request to TiDB"] [error=error.tidb.no_alive_tidb]
[2022/01/21 13:07:57.906 +08:00] [WARN] [proxy.go:189] ["fail to recv activity from remote, stay inactive and wait to next checking round"] [remote=10.102.0.71:4000] [interval=2s] [error="dial tcp 10.102.0.71:4000: connect: connection refused"]
[2022/01/21 13:07:57.906 +08:00] [WARN] [proxy.go:189] ["fail to recv activity from remote, stay inactive and wait to next checking round"] [remote=10.102.0.187:4000] [interval=2s] [error="dial tcp 10.102.0.187:4000: connect: connection refused"]
[2022/01/21 13:07:57.906 +08:00] [WARN] [proxy.go:189] ["fail to recv activity from remote, stay inactive and wait to next checking round"] [remote=10.102.0.86:10080] [interval=2s] [error="dial tcp 10.102.0.86:10080: connect: connection refused"]
[2022/01/21 13:07:57.906 +08:00] [WARN] [proxy.go:189] ["fail to recv activity from remote, stay inactive and wait to next checking round"] [remote=10.102.0.187:10080] [interval=2s] [error="dial tcp 10.102.0.187:10080: connect: connection refused"]
[2022/01/21 13:07:57.906 +08:00] [WARN] [proxy.go:189] ["fail to recv activity from remote, stay inactive and wait to next checking round"] [remote=10.102.0.71:10080] [interval=2s] [error="dial tcp 10.102.0.71:10080: connect: connection refused"]
[2022/01/21 13:07:57.906 +08:00] [WARN] [proxy.go:189] ["fail to recv activity from remote, stay inactive and wait to next checking round"] [remote=10.102.0.86:4000] [interval=2s] [error="dial tcp 10.102.0.86:4000: connect: connection refused"]
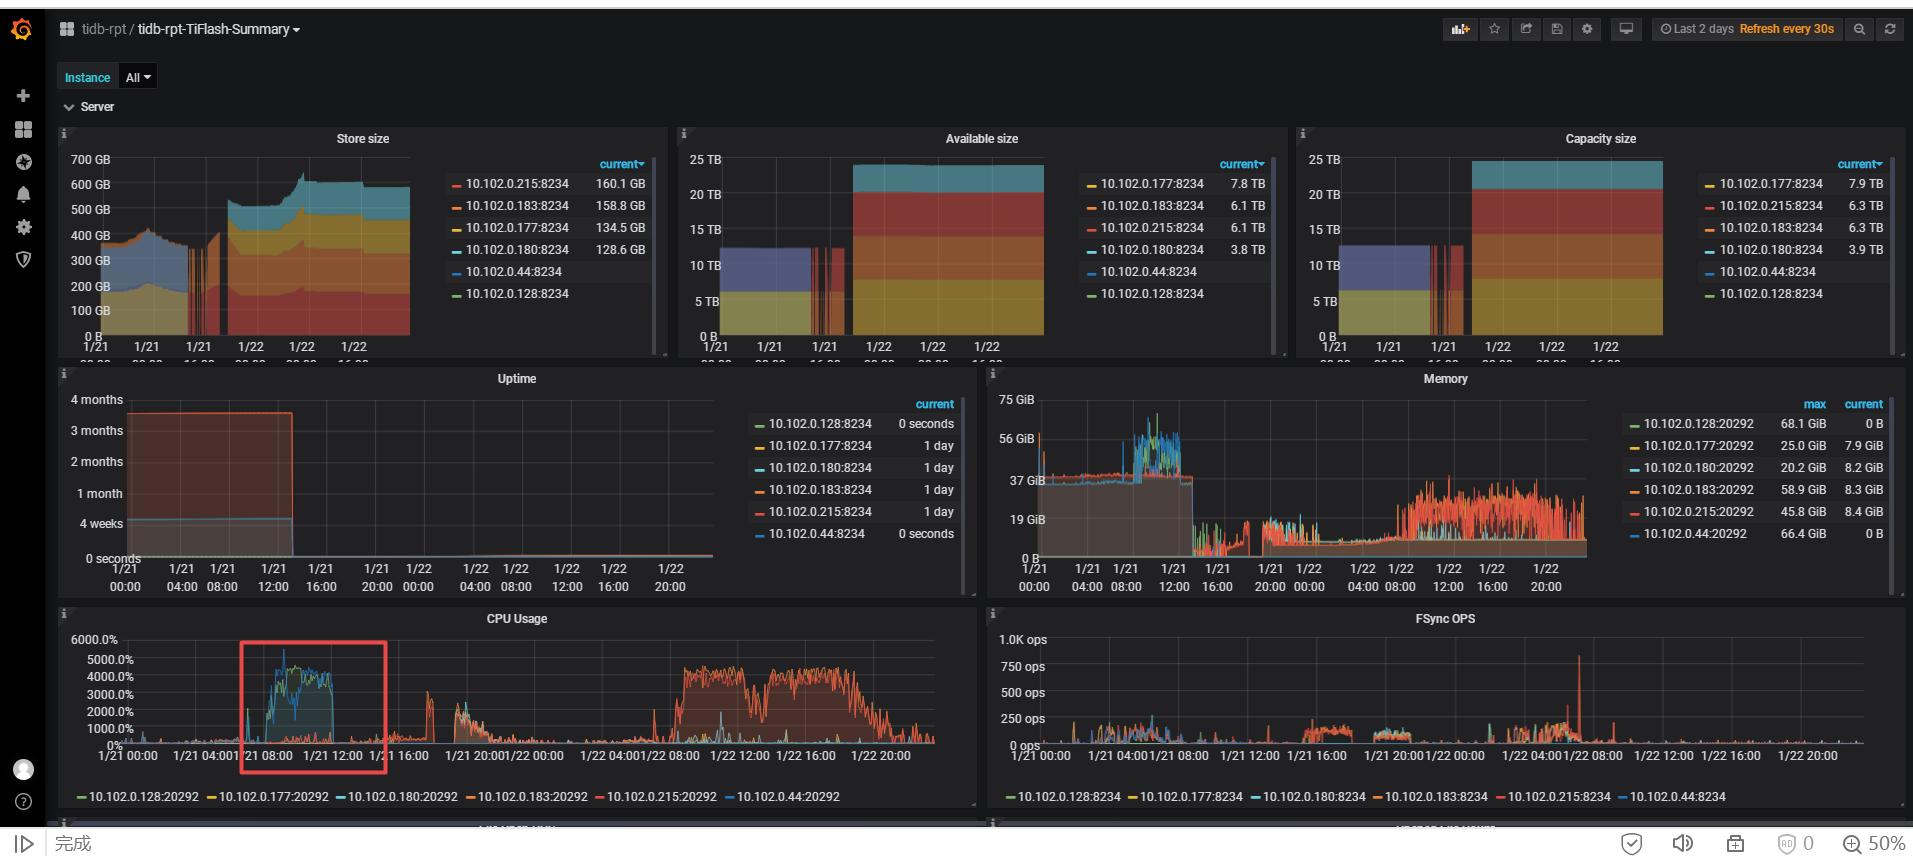
这是TiDB的日志:
[2022/01/21 13:04:34.448 +08:00] [INFO] [batch_coprocessor.go:561] ["stream unknown error"] [error="rpc error: code = Canceled desc = context canceled"]
[2022/01/21 13:04:34.448 +08:00] [INFO] [conn.go:812] ["command dispatched failed"] [conn=349305] [connInfo="id:349305, addr:10.1.39.27:43098 status:10, collation:utf8_general_ci, user:dolphin_rpt_r"] [command=Query] [status="inTxn:0, autocommit:1"] [sql=] [txn_mode=PESSIMISTIC] [err="[tikv:13][FLASH:Coprocessor:Internal] TiFlash server is terminating"]
[2022/01/21 13:04:34.474 +08:00] [INFO] [batch_coprocessor.go:561] ["stream unknown error"] [error="rpc error: code = Canceled desc = context canceled"]
[2022/01/21 13:04:34.475 +08:00] [INFO] [conn.go:812] ["command dispatched failed"] [conn=349413] [connInfo="id:349413, addr:10.1.39.23:50846 status:10, collation:utf8_general_ci, user:dolphin_rpt_r"] [command=Query] [status="inTxn:0, autocommit:1"] [sql="] [txn_mode=PESSIMISTIC] [err="[tikv:13][FLASH:Coprocessor:Internal] TiFlash server is terminating"]
[2022/01/21 13:04:34.736 +08:00] [ERROR] [terror.go:291] ["encountered error"] [error="write tcp 10.102.0.86:4000->10.1.39.21:45696: write: connection timed out"] [stack="github.com/pingcap/parser/terror.Log\
\t/home/jenkins/agent/workspace/optimization-build-tidb-linux-amd/go/pkg/mod/github.com/pingcap/parser@v0.0.0-20210623034316-5ee95ed0081f/terror/terror.go:291\
github.com/pingcap/tidb/server.(*clientConn).Run\
\t/home/jenkins/agent/workspace/optimization-build-tidb-linux-amd/go/src/github.com/pingcap/tidb/server/conn.go:821\
github.com/pingcap/tidb/server.(*Server).onConn\
\t/home/jenkins/agent/workspace/optimization-build-tidb-linux-amd/go/src/github.com/pingcap/tidb/server/server.go:477"]
[2022/01/21 13:04:34.761 +08:00] [INFO] [conn.go:812] ["command dispatched failed"] [conn=349411] [connInfo="id:349411, addr:10.1.37.96:50642 status:10, collation:utf8_general_ci, user:dolphin_rpt_r"]  [txn_mode=PESSIMISTIC] [err="[tikv:13][FLASH:Coprocessor:Internal] TiFlash server is terminating"]
[2022/01/21 13:04:34.761 +08:00] [ERROR] [terror.go:291] ["encountered error"] [error="write tcp 10.102.0.86:4000->10.1.37.96:50642: write: connection timed out"] [stack="github.com/pingcap/parser/terror.Log\
\t/home/jenkins/agent/workspace/optimization-build-tidb-linux-amd/go/pkg/mod/github.com/pingcap/parser@v0.0.0-20210623034316-5ee95ed0081f/terror/terror.go:291\
github.com/pingcap/tidb/server.(*clientConn).Run\
\t/home/jenkins/agent/workspace/optimization-build-tidb-linux-amd/go/src/github.com/pingcap/tidb/server/conn.go:821\
github.com/pingcap/tidb/server.(*Server).onConn\
\t/home/jenkins/agent/workspace/optimization-build-tidb-linux-amd/go/src/github.com/pingcap/tidb/server/server.go:477"]
从日志上看貌似是pd和tidb-server之间的网络问题?还有PD3和store之间的网络