windows下开发如何跑tidb的单元测试?
go test -v 有很多依赖加不完
- 该问题已经被回复了。
如果不涉及 failpoint 的测试,可以
cd tidb/kv
go test -check.f TestBasicFunc
如果涉及 failpoint 的,可以
make failpoint-enable
cd tidb/kv
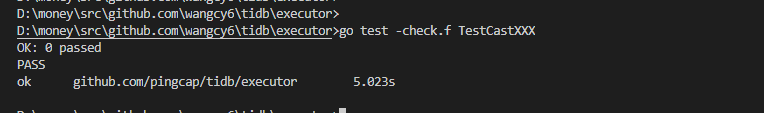
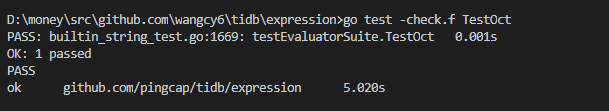
go test -check.f TestXXX
cd …
make failpoint-disable
- 这是我验证结果
but me failed and even tell me “flag provided but not defined: -check”,is it really in windows platform?
PS D:\Repository\go\src\xiaofeitu2-tidb\expression> go test -check.f TestOct
flag provided but not defined: -check
Usage of C:\Users\xiaof\AppData\Local\Temp\go-build146592322\b001\expression.test.exe:
-check.b
Run benchmarks
-check.bmem
Report memory benchmarks
-check.btime duration
approximate run time for each benchmark (default 1s)
-check.exclude string
Regular expression to exclude tests to run
-check.f string
Regular expression selecting which tests and/or suites to run
-check.list
List the names of all tests that will be run
-check.p
Run suites in parallel
-check.timeout duration
timeout value for each function
-check.v
Verbose mode
-check.vv
Super verbose mode (disables output caching)
-check.work
Display and do not remove the test working directory
-gocheck.b
Run benchmarks
-gocheck.btime duration
approximate run time for each benchmark (default 1s)
-gocheck.f string
Regular expression selecting which tests and/or suites to run
-gocheck.list
List the names of all tests that will be run
-gocheck.v
Verbose mode
-gocheck.vv
Super verbose mode (disables output caching)
-gocheck.work
Display and do not remove the test working directory
-record
to generate test result
-test.bench regexp
run only benchmarks matching regexp
-test.benchmem
print memory allocations for benchmarks
-test.benchtime d
run each benchmark for duration d (default 1s)
-test.blockprofile file
write a goroutine blocking profile to file
-test.blockprofilerate rate
set blocking profile rate (see runtime.SetBlockProfileRate) (default 1)
-test.count n
run tests and benchmarks n times (default 1)
-test.coverprofile file
write a coverage profile to file
-test.cpu list
comma-separated list of cpu counts to run each test with
-test.cpuprofile file
write a cpu profile to file
-test.failfast
do not start new tests after the first test failure
-test.list regexp
list tests, examples, and benchmarks matching regexp then exit
-test.memprofile file
write an allocation profile to file
-test.memprofilerate rate
set memory allocation profiling rate (see runtime.MemProfileRate)
-test.mutexprofile string
write a mutex contention profile to the named file after execution
-test.mutexprofilefraction int
if >= 0, calls runtime.SetMutexProfileFraction() (default 1)
-test.outputdir dir
write profiles to dir
-test.parallel n
run at most n tests in parallel (default 8)
-test.run regexp
run only tests and examples matching regexp
-test.short
run smaller test suite to save time
-test.testlogfile file
write test action log to file (for use only by cmd/go)
-test.timeout d
panic test binary after duration d (default 0, timeout disabled)
-test.trace file
write an execution trace to file
-test.v
verbose: print additional output
exit status 2
FAIL github.com/pingcap/tidb/expression 1.524s
- 你是自定义函数吗?我在学习,感觉看不懂,一起学习
- 我的可以
确实是linux可以跑,我在vscode上用powershell不行
windows的vscode上的powershell
vscode 不是用自带的终端吗?怎么会有powershell。