版本3.0.5
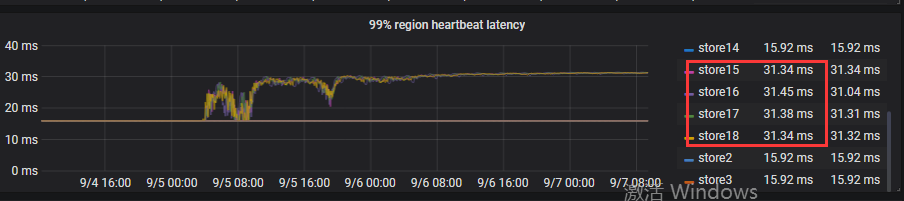
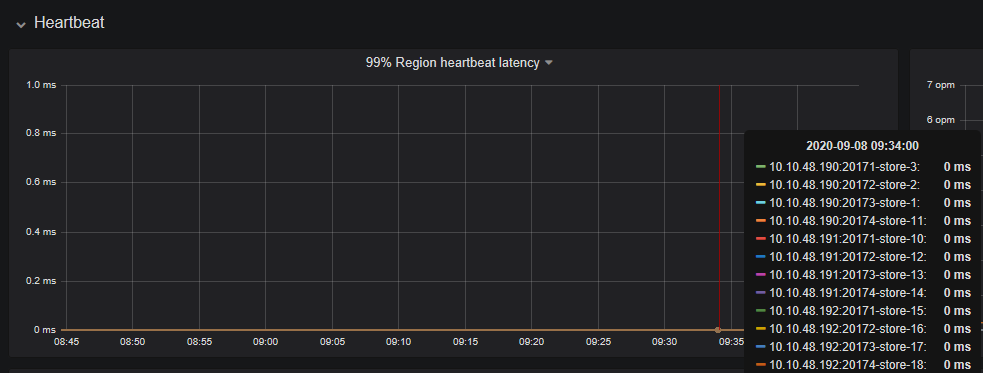
有值的图片是overview界面获取, 没有值的图片是在PD界面获取
您好 感谢您的反馈
图一中展示有数据 是未做 round 运算的 真实值
图二中展示数据为 0 是做了round 运算,近似到秒
如想对 监控内容有更多了解
可以点开 监控图 edit 内容对 PromQL 进行详细了解
更多知识可以参考
https://docs.pingcap.com/zh/tidb/stable/grafana-monitor-best-practices#使用-grafana-监控-tidb-的最佳实践