TiDB 集群有许多监控指标需要在 Grafana 上查看,如果监控异常,需要逐个环节排查哪里出了问题。此贴介绍 TiDB 监控的路径,方便定位问题。
-
登录 tiup 中控机,执行 tiup cluster list 查看目前的集群都有哪些. 本贴以 tiup-test 集群为例
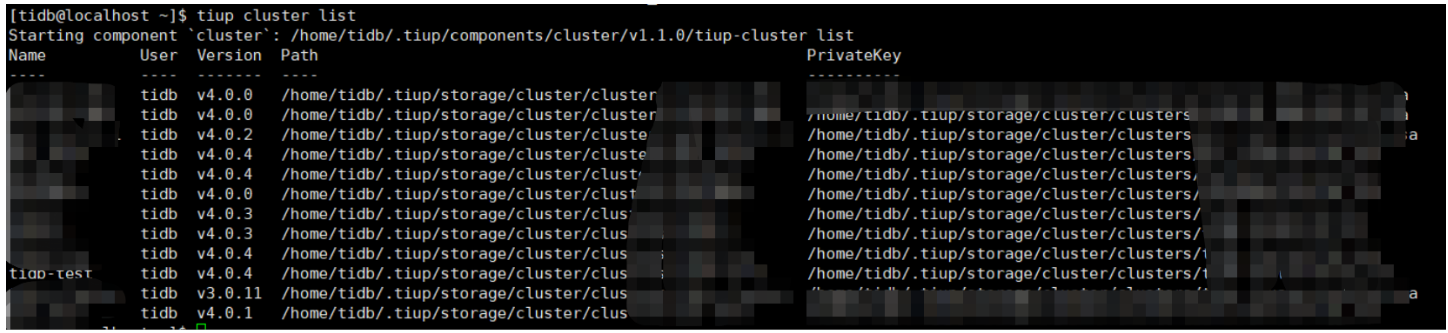
-
使用 tiup cluster display tidb-test 查看集群信息
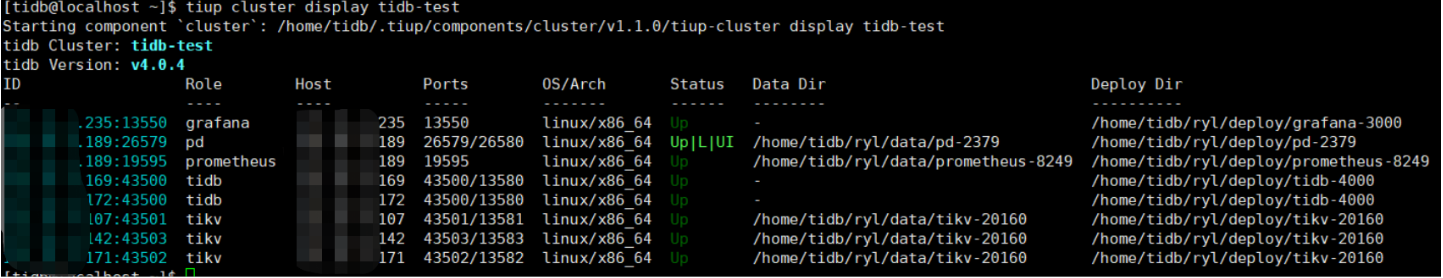
-
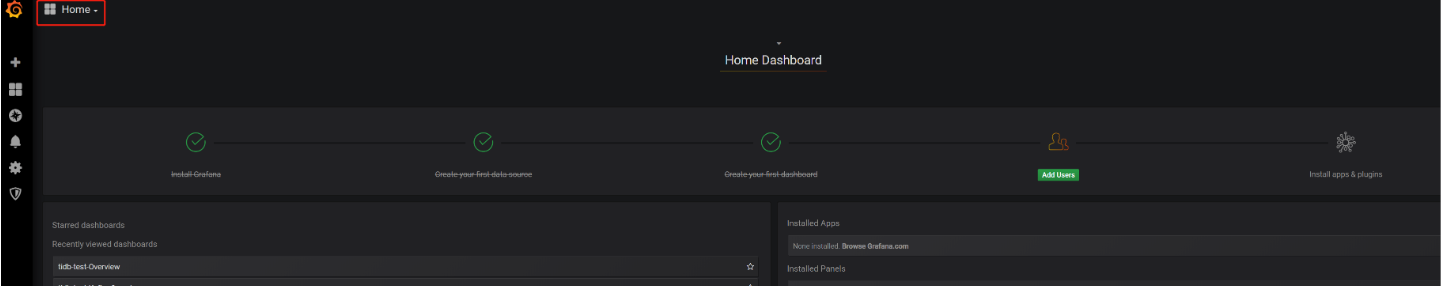
登录 grafana 界面,选择 home,挑选需要查看的集群
注: 学习 grafana 的文章可以参考 https://www.jianshu.com/p/7e7e0d06709b 或者官网
-
选择我们需要查看的 tidb-test 集群,可以看到有多个界面选项,可以结合官网的监控指标文档来了解每个监控界面的信息,比如 https://docs.pingcap.com/zh/tidb/stable/grafana-overview-dashboard
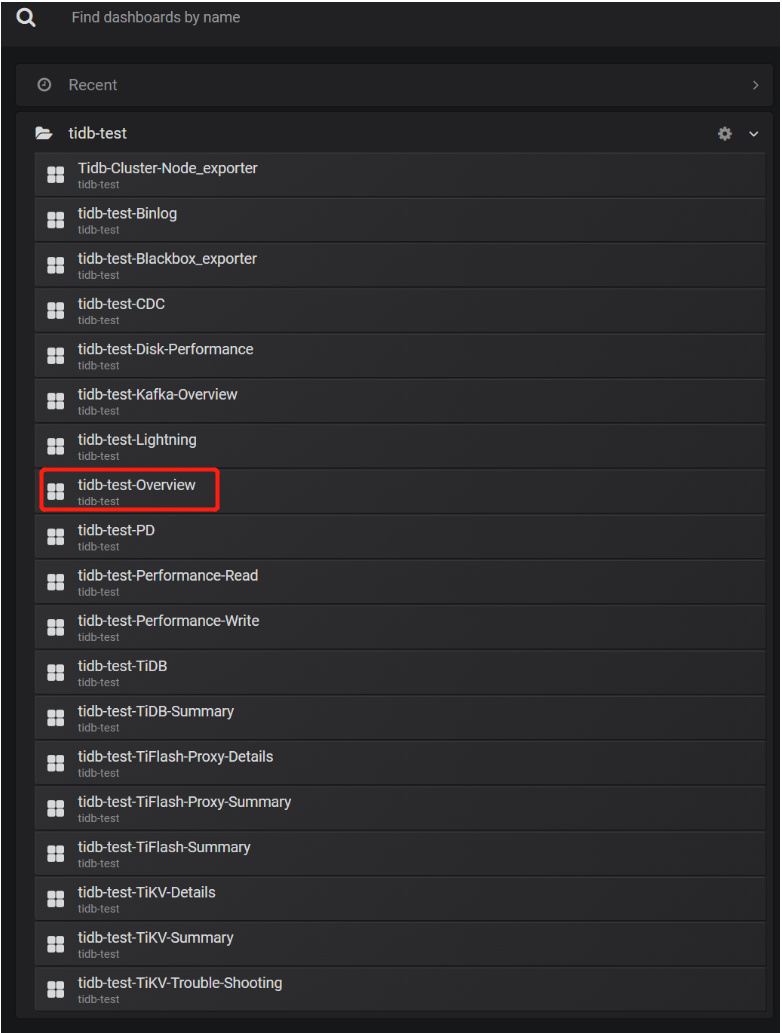
-
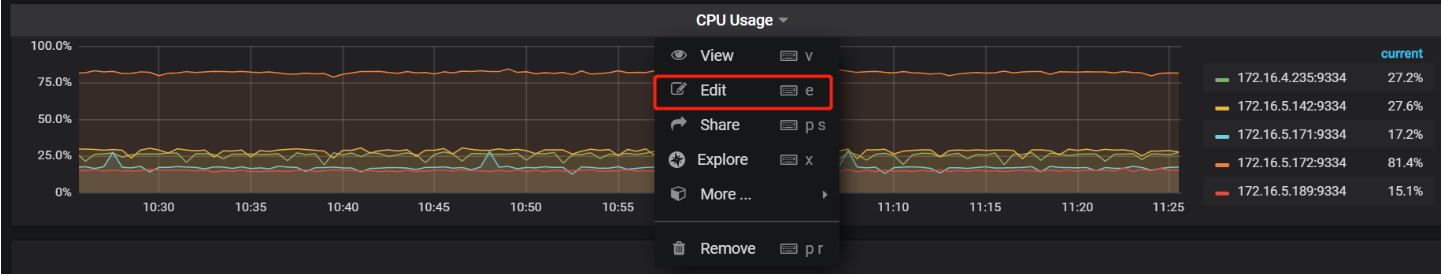
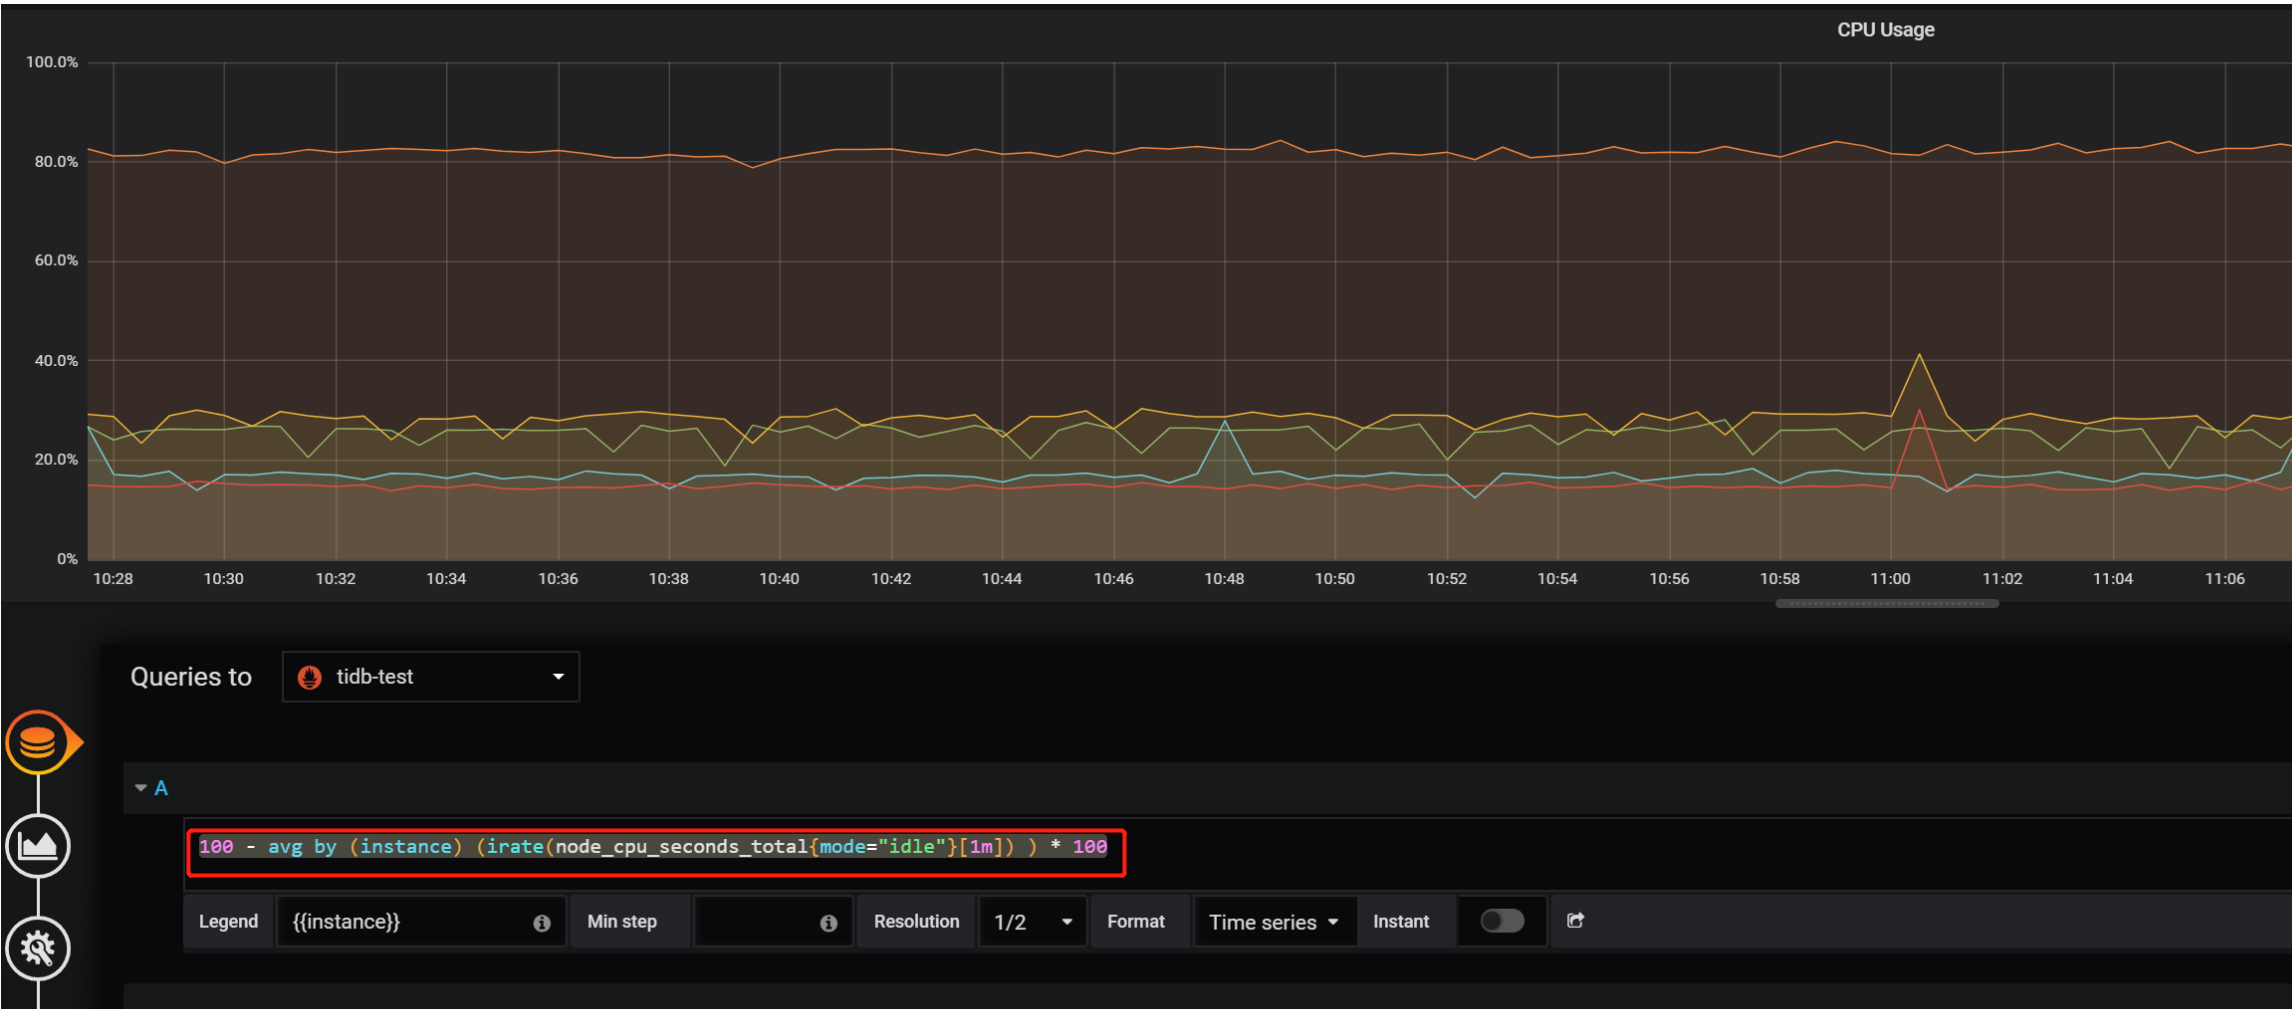
选择 over-view 界面后可以看到几个子界面,以 system info —> cpu 信息为例,可以点击 edit 编辑,查看对应的变量名称

-
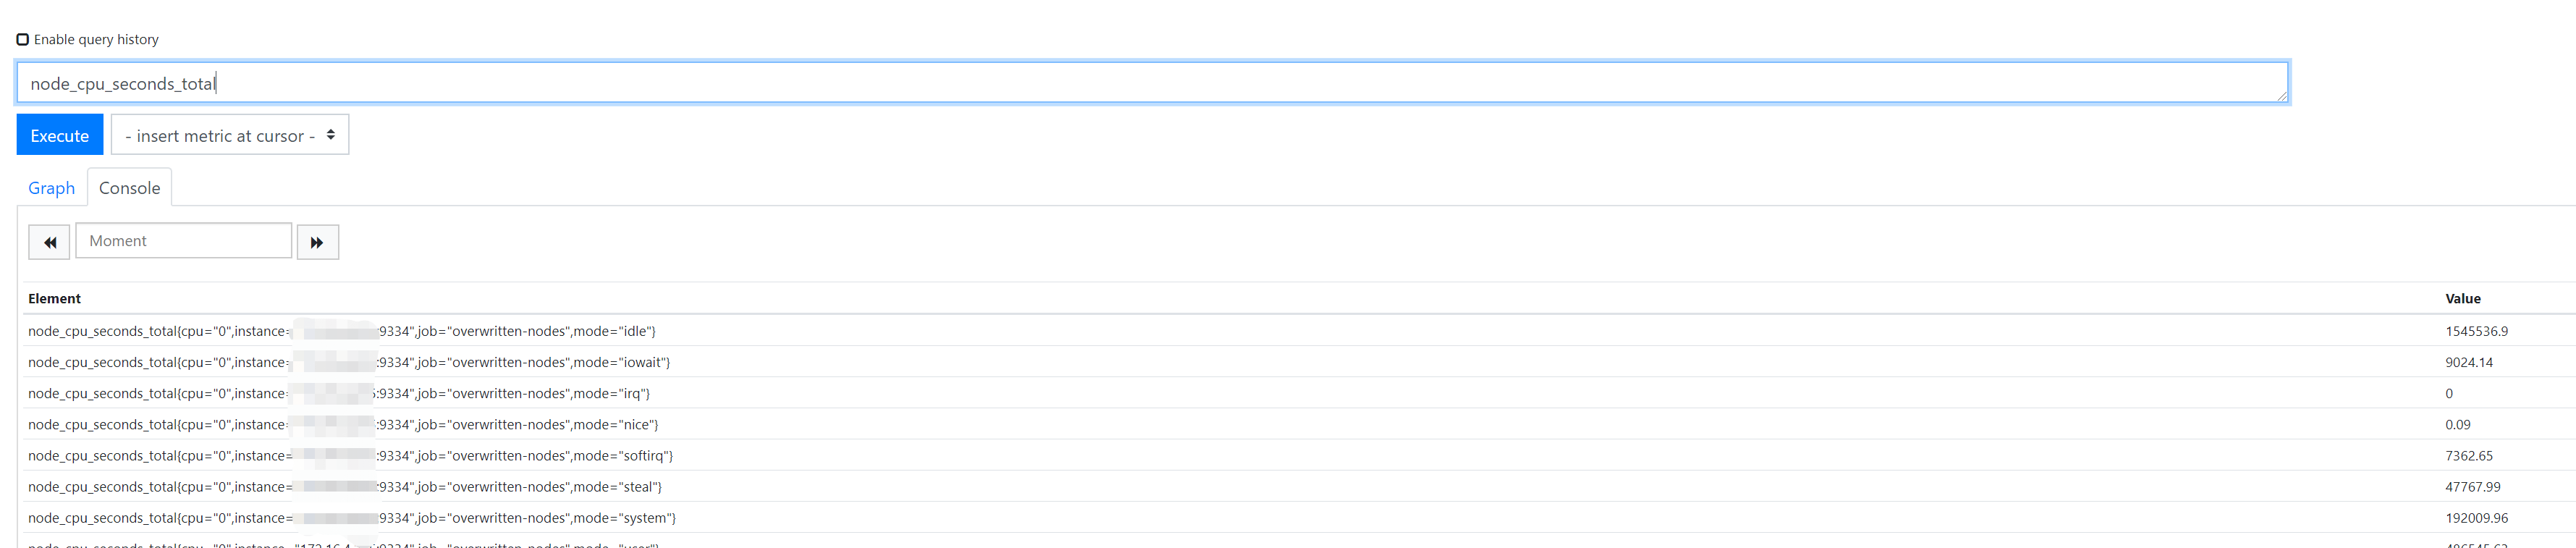
查到变量名称后,可以登录 Prometheus ,即 tiup 中查看到的 Prometheus 地址,这里可以查看监控的信息值
-
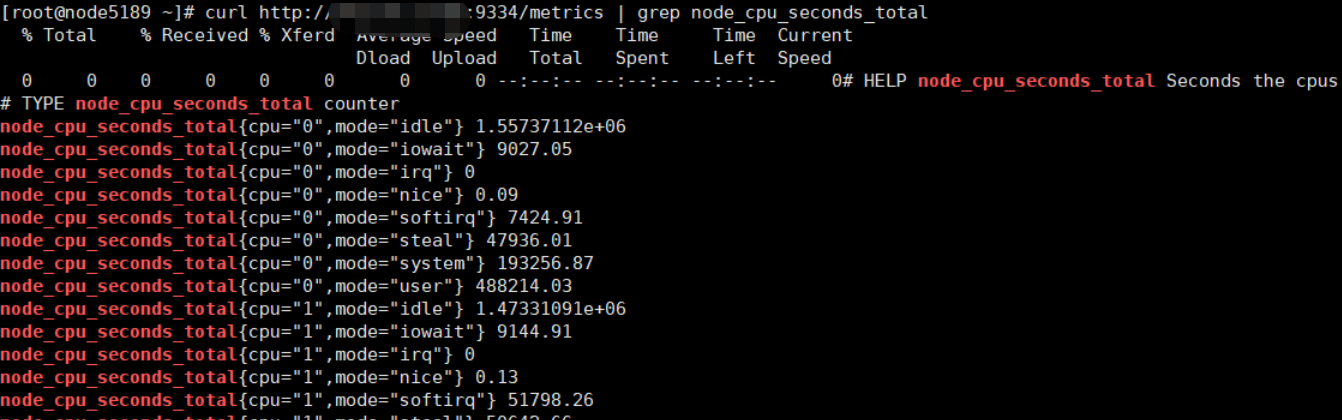
可以看到具体的值都是从目标机器上采集的,可以登录目标机器,执行以下命令查看本机采集的信息(IP 和 端口是 Prometheus 中的 instances).
curl http://xxx.xxx.xxx.xxx:9334/metrics | grep node_cpu_seconds_total
-
以上步骤已经可以排查 grafana —> prometheus -----> host/metrics 的链路信息,足以定位问题出现在哪一步骤。如果要继续查看 node_cpu_seconds_total 具体采集的操作系统哪些命令,需要查看 Prometheus 的 github 代码, 大部分主机信息都来自于以下 collector 的子项
https://github.com/prometheus/node_exporter/tree/0478ddef69620436c30a8ab05731c981783a74d6/collector -
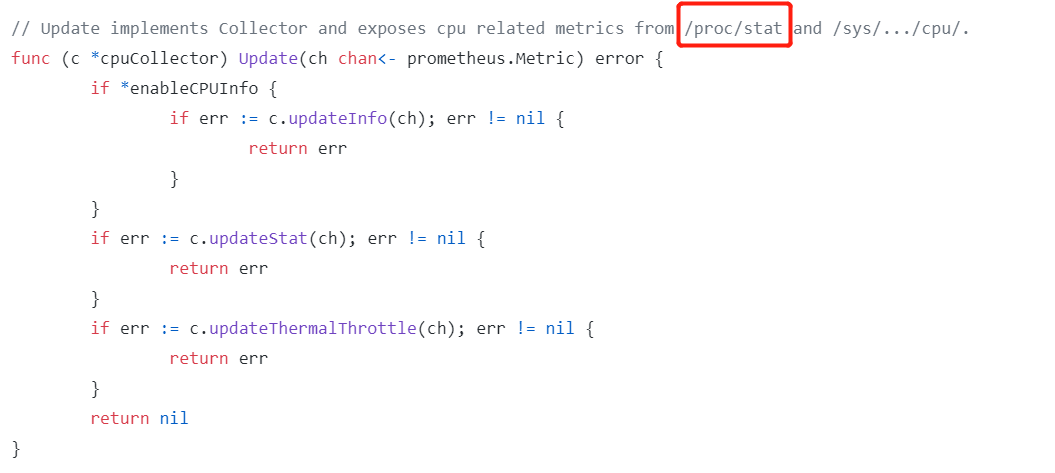
比如 cpu 信息 ,可以查看 https://github.com/prometheus/node_exporter/blob/0478ddef69620436c30a8ab05731c981783a74d6/collector/cpu_linux.go , cpu 信息来源于 /proc/stat
备注:如果 Grafana 无法显示监控信心,可以参考流程排查,通常的问题都是防火墙未关闭,或者端口未放通