没用用tidb自己的prometheus,统一到公共的prometheus,dashboard的取值地址是否可以自定义呢?
不建议,目前部署升级的时候会将监控模板进行覆盖,
如果出现以上报错可以使用如下办法修复:
tiup ctl pd --pd=“[http://](http:){pd-ip}:{pd-port}” config set metric-storage [http://](http:){prometheus-ip}:{prometheus-port}
验证:
curl http://pdhost:pdport/pd/api/v1/config
好的 非常感谢
![]()
Hi 顧問你好,
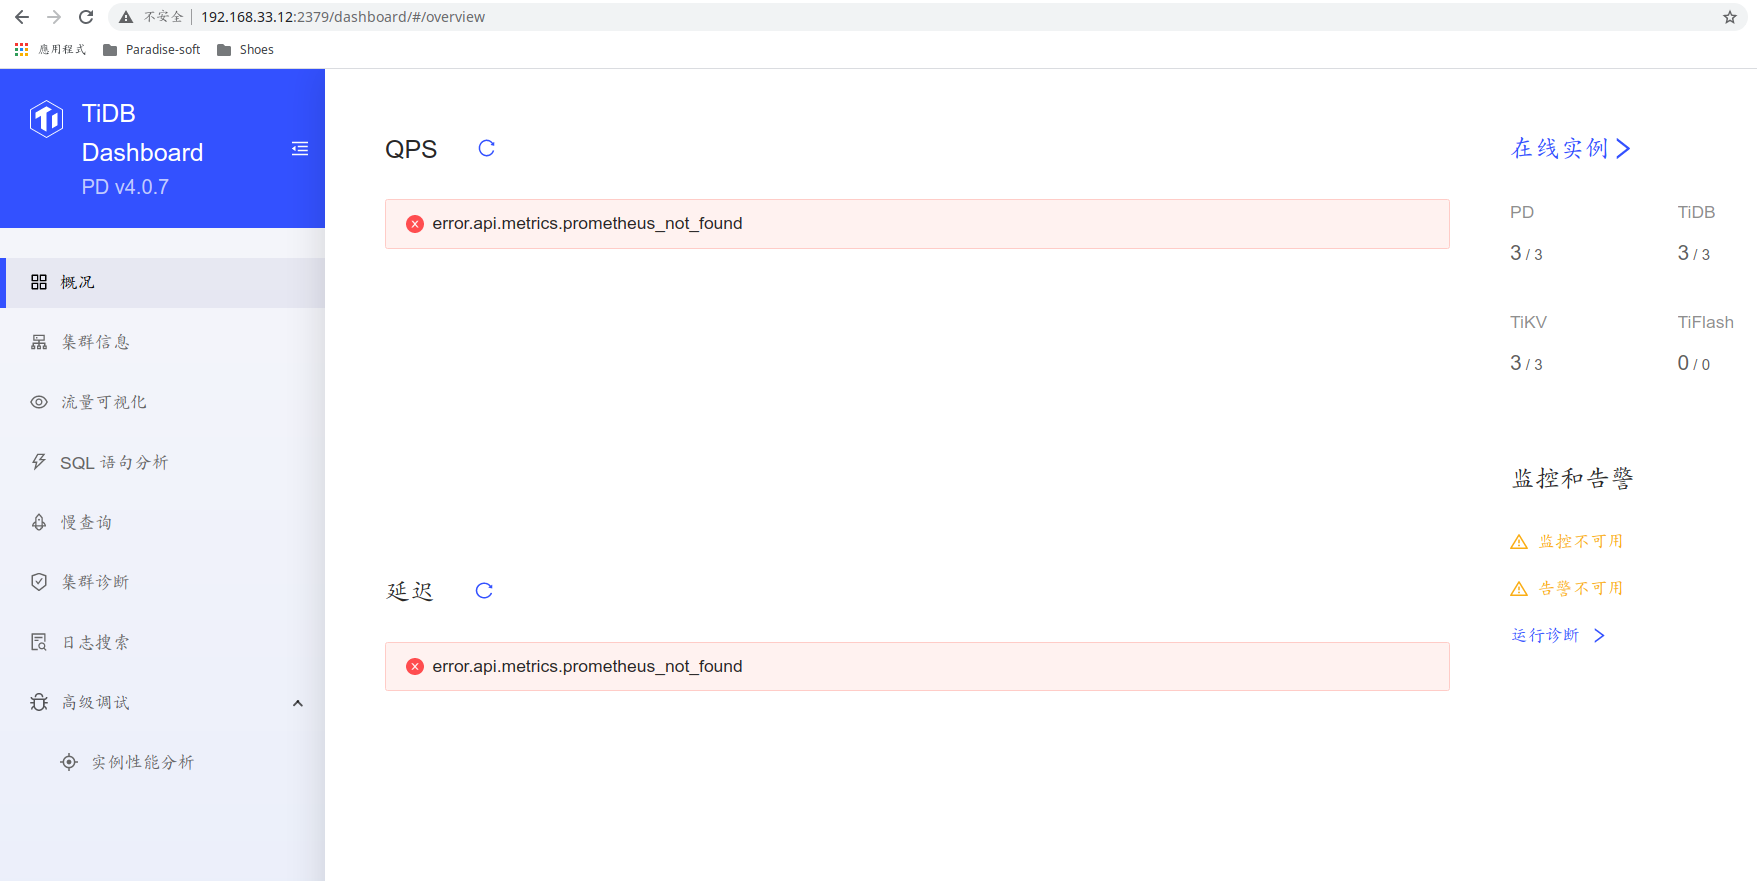
由於公司在監控上的要求,需要集中監控資訊到同一台Prometheus,我也同樣遇到上述問題error.api.metrics.prometheus_not_found,但按照上述方法執行後,Dashboard Overview頁面仍無法顯示
QPS與延遲圖表,再麻煩顧問不吝指導,感謝!
我佈署的拓樸為
192.168.33.10 Prometheus alertmanager Grafana
192.168.33.11 pd tidb tikv
192.168.33.12 pd tidb tikv
192.168.33.13 pd tidb tikv
版本: v4.0.7
執行命命如下:
tiup ctl pd --pd=“http://192.168.33.11:2379” config set metric-storage http://192.168.33.10:9090
Starting component ctl: /home/tidb/.tiup/components/ctl/v4.0.7/ctl pd --pd=http://192.168.33.11:2379 config set metric-storage http://192.168.33.10:9090
Success!
tiup ctl pd --pd=“http://192.168.33.12:2379” config set metric-storage http://192.168.33.10:9090
Starting component ctl: /home/tidb/.tiup/components/ctl/v4.0.7/ctl pd --pd=http://192.168.33.12:2379 config set metric-storage http://192.168.33.10:9090
Success!
tiup ctl pd --pd=“http://192.168.33.13:2379” config set metric-storage http://192.168.33.10:9090
Starting component ctl: /home/tidb/.tiup/components/ctl/v4.0.7/ctl pd --pd=http://192.168.33.13:2379 config set metric-storage http://192.168.33.10:9090
Success!
驗證上述步驟:
curl http://192.168.33.11:2379/pd/api/v1/config
curl http://192.168.33.12:2379/pd/api/v1/config
curl http://192.168.33.13:2379/pd/api/v1/config
擷取其中一台結果如下:
{
“client-urls”: “http://0.0.0.0:2379”,
“peer-urls”: “http://192.168.33.11:2380”,
“advertise-client-urls”: “http://192.168.33.11:2379”,
“advertise-peer-urls”: “http://192.168.33.11:2380”,
“name”: “pd-192.168.33.11-2379”,
“data-dir”: “/tidb-data/pd-2379”,
“force-new-cluster”: false,
“enable-grpc-gateway”: true,
“initial-cluster”: “pd-192.168.33.11-2379=http://192.168.33.11:2380,pd-192.168.33.12-2379=http://192.168.33.12:2380,pd-192.168.33.13-2379=http://192.168.33.13:2380”,
“initial-cluster-state”: “new”,
“initial-cluster-token”: “pd-cluster”,
“join”: “”,
“lease”: 3,
“log”: {
“level”: “”,
“format”: “text”,
“disable-timestamp”: false,
“file”: {
“filename”: “/tidb-deploy/pd-2379/log/pd.log”,
“max-size”: 300,
“max-days”: 0,
“max-backups”: 0
},
“development”: false,
“disable-caller”: false,
“disable-stacktrace”: false,
“disable-error-verbose”: true,
“sampling”: null
},
“tso-save-interval”: “3s”,
“metric”: {
“job”: “pd-192.168.33.11-2379”,
“address”: “”,
“interval”: “15s”
},
“schedule”: {
“max-snapshot-count”: 3,
“max-pending-peer-count”: 16,
“max-merge-region-size”: 20,
“max-merge-region-keys”: 200000,
“split-merge-interval”: “1h0m0s”,
“enable-one-way-merge”: “false”,
“enable-cross-table-merge”: “false”,
“patrol-region-interval”: “100ms”,
“max-store-down-time”: “30m0s”,
“leader-schedule-limit”: 4,
“leader-schedule-policy”: “count”,
“region-schedule-limit”: 2048,
“replica-schedule-limit”: 64,
“merge-schedule-limit”: 8,
“hot-region-schedule-limit”: 4,
“hot-region-cache-hits-threshold”: 3,
“store-limit”: {
“1”: {
“add-peer”: 15,
“remove-peer”: 15
},
“4”: {
“add-peer”: 15,
“remove-peer”: 15
},
“5”: {
“add-peer”: 15,
“remove-peer”: 15
}
},
“tolerant-size-ratio”: 0,
“low-space-ratio”: 0.8,
“high-space-ratio”: 0.7,
“scheduler-max-waiting-operator”: 5,
“enable-remove-down-replica”: “true”,
“enable-replace-offline-replica”: “true”,
“enable-make-up-replica”: “true”,
“enable-remove-extra-replica”: “true”,
“enable-location-replacement”: “true”,
“enable-debug-metrics”: “false”,
“schedulers-v2”: [
{
“type”: “balance-region”,
“args”: null,
“disable”: false,
“args-payload”: “”
},
{
“type”: “balance-leader”,
“args”: null,
“disable”: false,
“args-payload”: “”
},
{
“type”: “hot-region”,
“args”: null,
“disable”: false,
“args-payload”: “”
},
{
“type”: “label”,
“args”: null,
“disable”: false,
“args-payload”: “”
}
],
“schedulers-payload”: {
“balance-hot-region-scheduler”: null,
“balance-leader-scheduler”: {
“name”: “balance-leader-scheduler”,
“ranges”: [
{
“end-key”: “”,
“start-key”: “”
}
]
},
“balance-region-scheduler”: {
“name”: “balance-region-scheduler”,
“ranges”: [
{
“end-key”: “”,
“start-key”: “”
}
]
},
“label-scheduler”: {
“name”: “label-scheduler”,
“ranges”: [
{
“end-key”: “”,
“start-key”: “”
}
]
}
},
“store-limit-mode”: “manual”
},
“replication”: {
“max-replicas”: 3,
“location-labels”: “”,
“strictly-match-label”: “false”,
“enable-placement-rules”: “false”
},
“pd-server”: {
“use-region-storage”: “true”,
“max-gap-reset-ts”: “24h0m0s”,
“key-type”: “table”,
“runtime-services”: “”,
“metric-storage”: “http://192.168.33.10:9090”,
“dashboard-address”: “http://192.168.33.12:2379”,
“trace-region-flow”: “false”
},
“cluster-version”: “4.0.7”,
“quota-backend-bytes”: “8GiB”,
“auto-compaction-mode”: “periodic”,
“auto-compaction-retention-v2”: “1h”,
“TickInterval”: “500ms”,
“ElectionInterval”: “3s”,
“PreVote”: true,
“security”: {
“cacert-path”: “”,
“cert-path”: “”,
“key-path”: “”,
“cert-allowed-cn”: null
},
“label-property”: {},
“WarningMsgs”: null,
“DisableStrictReconfigCheck”: false,
“HeartbeatStreamBindInterval”: “1m0s”,
“LeaderPriorityCheckInterval”: “1m0s”,
“dashboard”: {
“tidb-cacert-path”: “”,
“tidb-cert-path”: “”,
“tidb-key-path”: “”,
“public-path-prefix”: “”,
“internal-proxy”: false,
“enable-telemetry”: true,
“enable-experimental”: false
},
“replication-mode”: {
“replication-mode”: “majority”,
“dr-auto-sync”: {
“label-key”: “”,
“primary”: “”,
“dr”: “”,
“primary-replicas”: 0,
“dr-replicas”: 0,
“wait-store-timeout”: “1m0s”,
“wait-sync-timeout”: “1m0s”
}
}
}
解决了吗?我的也这样
好了,start 就好了,restart没用
此话题已在最后回复的 1 分钟后被自动关闭。不再允许新回复。