前提:这个tidb集群是从3.0.11版本用tiup升级到4.0.0版本,现在是4.0.0版本。
1、集群升级后第一次扩容kv,扩容的这台kv服务器是第一次添加。
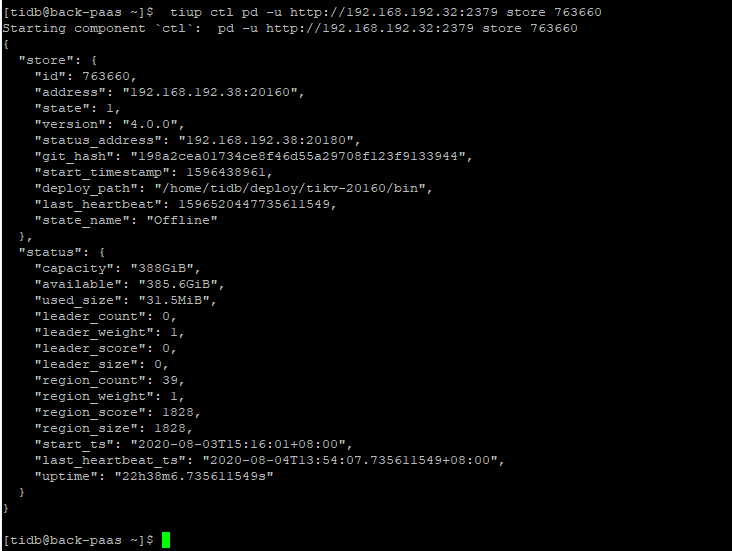
2、 pd-ctl 的 store 和config show all 信息
tiup ctl pd -u http://192.168.192.32:2379 store 763660 结果如下
config show all 结果如下
[tidb@back-paas ~]$ tiup ctl pd -u http://192.168.192.32:2379 config show all
Starting component `ctl`:  pd -u http://192.168.192.32:2379 config show all
{
  "client-urls": "http://0.0.0.0:2379",
  "peer-urls": "http://192.168.192.32:2380",
  "advertise-client-urls": "http://192.168.192.32:2379",
  "advertise-peer-urls": "http://192.168.192.32:2380",
  "name": "pd_huirui-32",
  "data-dir": "/home/tidb/deploy/data.pd",
  "force-new-cluster": false,
  "enable-grpc-gateway": true,
  "initial-cluster": "pd_huirui-31=http://192.168.192.31:2380,pd_huirui-32=http://192.168.192.32:2380,pd_huirui-33=http://192.168.192.33:2380",
  "initial-cluster-state": "new",
  "join": "",
  "lease": 3,
  "log": {
    "level": "info",
    "format": "text",
    "disable-timestamp": false,
    "file": {
      "filename": "/home/tidb/deploy/log/pd.log",
      "max-size": 300,
      "max-days": 0,
      "max-backups": 0
    },
    "development": false,
    "disable-caller": false,
    "disable-stacktrace": false,
    "disable-error-verbose": true,
    "sampling": null
  },
  "tso-save-interval": "3s",
  "metric": {
    "job": "pd_huirui-32",
    "address": "",
    "interval": "15s"
  },
  "schedule": {
    "max-snapshot-count": 3,
    "max-pending-peer-count": 16,
    "max-merge-region-size": 20,
    "max-merge-region-keys": 200000,
    "split-merge-interval": "1h0m0s",
    "enable-one-way-merge": "false",
    "enable-cross-table-merge": "false",
    "patrol-region-interval": "100ms",
    "max-store-down-time": "30m0s",
    "leader-schedule-limit": 4,
    "leader-schedule-policy": "count",
    "region-schedule-limit": 4,
    "replica-schedule-limit": 8,
    "merge-schedule-limit": 8,
    "hot-region-schedule-limit": 4,
    "hot-region-cache-hits-threshold": 3,
    "store-balance-rate": 15,
    "tolerant-size-ratio": 5,
    "low-space-ratio": 0.8,
    "high-space-ratio": 0.6,
    "scheduler-max-waiting-operator": 3,
    "enable-remove-down-replica": "true",
    "enable-replace-offline-replica": "true",
    "enable-make-up-replica": "true",
    "enable-remove-extra-replica": "true",
    "enable-location-replacement": "true",
    "enable-debug-metrics": "false",
    "schedulers-v2": [
      {
        "type": "balance-region",
        "args": null,
        "disable": false,
        "args-payload": ""
      },
      {
        "type": "balance-leader",
        "args": null,
        "disable": false,
        "args-payload": ""
      },
      {
        "type": "hot-region",
        "args": null,
        "disable": false,
        "args-payload": ""
      },
      {
        "type": "label",
        "args": null,
        "disable": false,
        "args-payload": ""
      }
    ],
    "schedulers-payload": {
      "balance-hot-region-scheduler": "null",
      "balance-leader-scheduler": "{\"name\":\"balance-leader-scheduler\",\"ranges\":[{\"start-key\":\"\",\"end-key\":\"\"}]}",
      "balance-region-scheduler": "{\"name\":\"balance-region-scheduler\",\"ranges\":[{\"start-key\":\"\",\"end-key\":\"\"}]}",
      "label-scheduler": "{\"name\":\"label-scheduler\",\"ranges\":[{\"start-key\":\"\",\"end-key\":\"\"}]}"
    },
    "store-limit-mode": "manual"
  },
  "replication": {
    "max-replicas": 3,
    "location-labels": "",
    "strictly-match-label": "false",
    "enable-placement-rules": "false"
  },
  "pd-server": {
    "use-region-storage": "true",
    "max-gap-reset-ts": "24h0m0s",
    "key-type": "table",
    "runtime-services": "",
    "metric-storage": "http://192.168.192.33:9090",
    "dashboard-address": "http://192.168.192.33:2379"
  },
  "cluster-version": "4.0.0",
  "quota-backend-bytes": "8GiB",
  "auto-compaction-mode": "periodic",
  "auto-compaction-retention-v2": "1h",
  "TickInterval": "500ms",
  "ElectionInterval": "3s",
  "PreVote": true,
  "security": {
    "cacert-path": "",
    "cert-path": "",
    "key-path": "",
    "cert-allowed-cn": null
  },
  "label-property": {},
  "WarningMsgs": [
    "Config contains undefined item: namespace-classifier"
  ],
  "DisableStrictReconfigCheck": false,
  "HeartbeatStreamBindInterval": "1m0s",
  "LeaderPriorityCheckInterval": "1m0s",
  "dashboard": {
    "tidb_cacert_path": "",
    "tidb_cert_path": "",
    "tidb_key_path": "",
    "public_path_prefix": "/dashboard"
  },
  "replication-mode": {
    "replication-mode": "majority",
    "dr-auto-sync": {
      "label-key": "",
      "primary": "",
      "dr": "",
      "primary-replicas": 0,
      "dr-replicas": 0,
      "wait-store-timeout": "1m0s",
      "wait-sync-timeout": "1m0s"
    }
  }
}

[tidb@back-paas ~]$