为提高效率,提问时请提供以下信息,问题描述清晰可优先响应。
- 【TiDB 版本】:3.0.5
- 【问题描述】: SQL:
SELECT ‘0’ AS fileType , e.uuid , b.original_name AS originalName , b.client , e.path , e.storage_type AS storageType , b.storage_location AS storageLocation , b.length , b.upload_time AS uploadTime , b.created_by AS createdBy , b.created_time AS createdTime FROM t_file_ext e LEFT JOIN t_file_basic b ON e.uuid = b.uuid WHERE e.path = ‘/’ AND b.client = ‘contract’ ORDER BY e.created_time DESC limit 50;
t_file_basic 表 125169826 条记录 t_file_ext 表 130634669 条记录,path = '/'的记录 约20% 两表uuid做关联 有130064307 条,可以认为两表uuid是重叠的。
t_file_basic .client =contract 有 2497884条 占15% t_file_basic .client =vsdshanghaigoo 有 2497884条 占2%
在 created_time 上有索引
contract 执行计划如下 ±---------------------------------±-------±-----±------------------------------------------------------------------------------------------------------------------------------------------------------------------------------------------------------±--------------------------------------------------------------------------±----------------------+ | id | count | task | operator info | execution info | memory | ±---------------------------------±-------±-----±------------------------------------------------------------------------------------------------------------------------------------------------------------------------------------------------------±--------------------------------------------------------------------------±----------------------+ | Projection_10 | 50.00 | root | filetype, ecm.e.uuid, ecm.b.originalname, ecm.b.client, ecm.e.path, ecm.e.storagetype, ecm.b.storagelocation, ecm.b.length, ecm.b.uploadtime, ecm.b.createdby, ecm.b.createdtime | time:563.230801ms, loops:2, rows:50 | N/A | | └─Projection_11 | 50.00 | root | “0”, ecm.e.uuid, ecm.b.original_name, ecm.b.client, ecm.e.path, ecm.e.storage_type, ecm.b.storage_location, ecm.b.length, ecm.b.upload_time, ecm.b.created_by, ecm.b.created_time, ecm.e.created_time | time:563.174494ms, loops:2, rows:50 | N/A | | └─Limit_17 | 50.00 | root | offset:0, count:50 | time:563.139134ms, loops:2, rows:50 | N/A | | └─IndexJoin_58 | 50.00 | root | inner join, inner:IndexLookUp_57, outer key:ecm.e.uuid, inner key:ecm.b.uuid | time:563.135906ms, loops:1, rows:50 | 528.79296875 KB | | ├─Projection_67 | 69.97 | root | ecm.e.uuid, ecm.e.path, ecm.e.storage_type, ecm.e.created_time | time:589.250966ms, loops:3, rows:2953 | N/A | | │ └─IndexLookUp_66 | 69.97 | root | | time:589.227316ms, loops:3, rows:2953 | 13.967904090881348 MB | | │ ├─IndexScan_63 | 370.55 | cop | table:e, index:created_time, range:[NULL,+inf], keep order:true, desc | time:354ms, loops:572, rows:581321 | N/A | | │ └─Selection_65 | 69.97 | cop | eq(ecm.e.path, “/”) | proc max:83ms, min:34ms, p80:83ms, p95:83ms, rows:2953, iters:22, tasks:3 | N/A | | │ └─TableScan_64 | 370.55 | cop | table:t_file_ext, keep order:false | proc max:82ms, min:34ms, p80:82ms, p95:82ms, rows:7168, iters:22, tasks:3 | N/A | | └─IndexLookUp_57 | 0.14 | root | | time:109.825582ms, loops:3, rows:1010 | 242.1640625 KB | | ├─IndexScan_54 | 1.00 | cop | table:b, index:uuid, range: decided by [eq(ecm.b.uuid, ecm.e.uuid)], keep order:false | proc max:2ms, min:0s, p80:1ms, p95:1ms, rows:2048, iters:277, tasks:277 | N/A | | └─Selection_56 | 0.14 | cop | eq(ecm.b.client, “contract”) | time:27ms, loops:6, rows:1010 | N/A | | └─TableScan_55 | 1.00 | cop | table:t_file_basic, keep order:false | time:26ms, loops:6, rows:1024 | N/A | ±---------------------------------±-------±-----±------------------------------------------------------------------------------------------------------------------------------------------------------------------------------------------------------±--------------------------------------------------------------------------±----------------------+
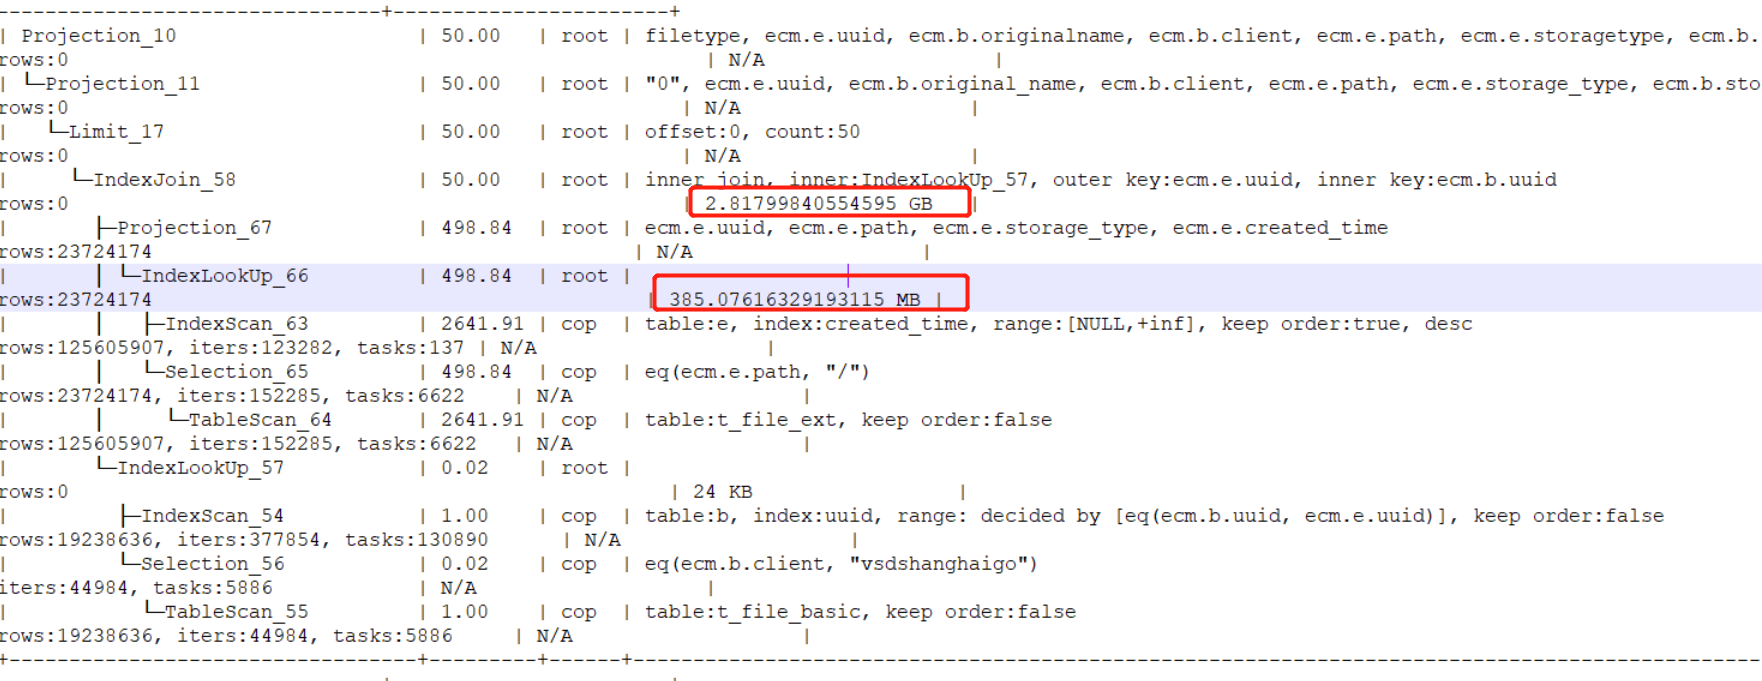
vsdshanghaigoo 执行计划 ±---------------------------------±--------±-----±------------------------------------------------------------------------------------------------------------------------------------------------------------------------------------------------------±-----------------------------------------------------------------------------------------±----------------------+ | id | count | task | operator info | execution info | memory | ±---------------------------------±--------±-----±------------------------------------------------------------------------------------------------------------------------------------------------------------------------------------------------------±-----------------------------------------------------------------------------------------±----------------------+ | Projection_10 | 50.00 | root | filetype, ecm.e.uuid, ecm.b.originalname, ecm.b.client, ecm.e.path, ecm.e.storagetype, ecm.b.storagelocation, ecm.b.length, ecm.b.uploadtime, ecm.b.createdby, ecm.b.createdtime | time:11m57.2013173s, loops:1, rows:0 | N/A | | └─Projection_11 | 50.00 | root | “0”, ecm.e.uuid, ecm.b.original_name, ecm.b.client, ecm.e.path, ecm.e.storage_type, ecm.b.storage_location, ecm.b.length, ecm.b.upload_time, ecm.b.created_by, ecm.b.created_time, ecm.e.created_time | time:11m57.201309746s, loops:1, rows:0 | N/A | | └─Limit_17 | 50.00 | root | offset:0, count:50 | time:11m57.201284359s, loops:1, rows:0 | N/A | | └─IndexJoin_58 | 50.00 | root | inner join, inner:IndexLookUp_57, outer key:ecm.e.uuid, inner key:ecm.b.uuid | time:11m57.201281936s, loops:1, rows:0 | 2.81799840554595 GB | | ├─Projection_67 | 498.84 | root | ecm.e.uuid, ecm.e.path, ecm.e.storage_type, ecm.e.created_time | time:11m49.979743493s, loops:23171, rows:23724174 | N/A | | │ └─IndexLookUp_66 | 498.84 | root | | time:11m49.84978126s, loops:23171, rows:23724174 | 385.07616329193115 MB | | │ ├─IndexScan_63 | 2641.91 | cop | table:e, index:created_time, range:[NULL,+inf], keep order:true, desc | proc max:753ms, min:190ms, p80:581ms, p95:646ms, rows:125605907, iters:123282, tasks:137 | N/A | | │ └─Selection_65 | 498.84 | cop | eq(ecm.e.path, “/”) | proc max:677ms, min:0s, p80:474ms, p95:534ms, rows:23724174, iters:152285, tasks:6622 | N/A | | │ └─TableScan_64 | 2641.91 | cop | table:t_file_ext, keep order:false | proc max:674ms, min:0s, p80:473ms, p95:532ms, rows:125605907, iters:152285, tasks:6622 | N/A | | └─IndexLookUp_57 | 0.02 | root | | time:3m28.409739799s, loops:935, rows:0 | 24 KB | | ├─IndexScan_54 | 1.00 | cop | table:b, index:uuid, range: decided by [eq(ecm.b.uuid, ecm.e.uuid)], keep order:false | proc max:23ms, min:0s, p80:8ms, p95:10ms, rows:19238636, iters:377854, tasks:130890 | N/A | | └─Selection_56 | 0.02 | cop | eq(ecm.b.client, “vsdshanghaigoo”) | proc max:298ms, min:0s, p80:123ms, p95:175ms, rows:0, iters:44984, tasks:5886 | N/A | | └─TableScan_55 | 1.00 | cop | table:t_file_basic, keep order:false | proc max:295ms, min:0s, p80:122ms, p95:174ms, rows:19238636, iters:44984, tasks:5886 | N/A | ±---------------------------------±--------±-----±------------------------------------------------------------------------------------------------------------------------------------------------------------------------------------------------------±-----------------------------------------------------------------------------------------±----------------------+
两个执行计划下 IndexLookUp_66算子 同为使用 created_time 索引对 path=’/'做过滤,为什么耗时和资源消耗不一样。