【TiDB 版本】: v3.0.12
【问题描述】:
我们的环境有 8 台 TiDB, 最近压力测试偶尔会随机有 TiDB 出现错误讯息 “TiDB 出现 PD server timeout%!(EXTRA string=start timestamp may fall behind safe point) 错误”
出现错误时, 其它七台 TiDB 正常, 所以推断不是 PD 端的问题
导致该错误出现的条件与原因目前还不太确定, 该错误出现后大概持续几个小时又会恢復正常
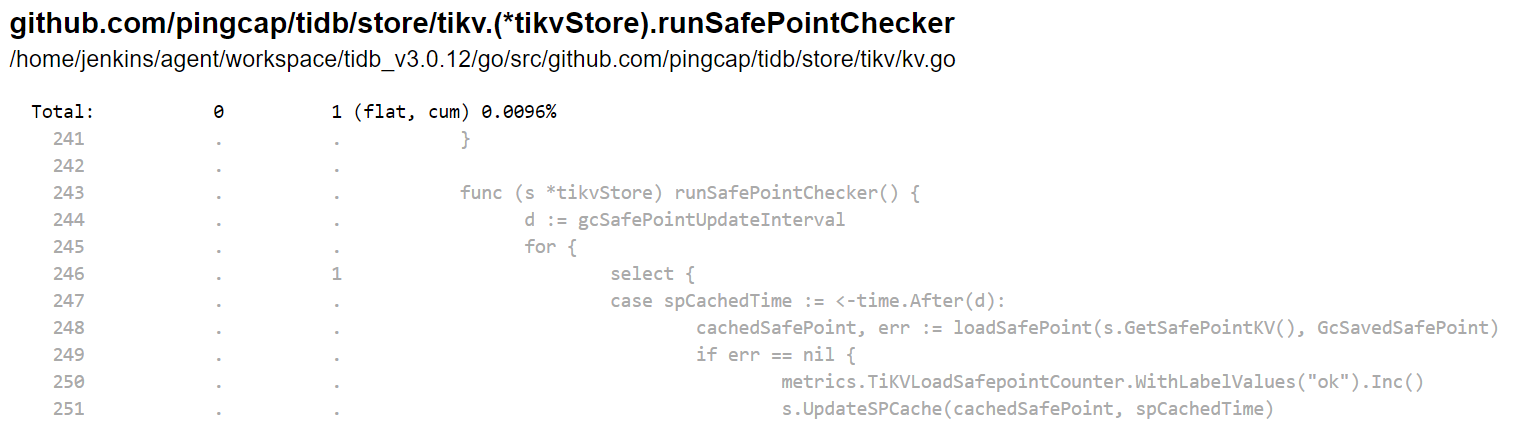
针对出问题的地方, 我们有查看了一下相关的原始码, 發现是以下这段逻辑似乎有问题
理论上 runSafePointChecker 这隻 goroutine 应该要每 gcSafePointUpdateInterval (10 秒钟) 去执行一次 loadSafePoint
func (s *tikvStore) runSafePointChecker() {
    d := gcSafePointUpdateInterval
    for {
        select {
        case spCachedTime := <-time.After(d):
            cachedSafePoint, err := loadSafePoint(s.GetSafePointKV(), GcSavedSafePoint)
            if err == nil {
                metrics.TiKVLoadSafepointCounter.WithLabelValues("ok").Inc()
                s.UpdateSPCache(cachedSafePoint, spCachedTime)
                d = gcSafePointUpdateInterval
            } else {
                metrics.TiKVLoadSafepointCounter.WithLabelValues("fail").Inc()
                logutil.Logger(context.Background()).Error("fail to load safepoint from pd", zap.Error(err))
                d = gcSafePointQuickRepeatInterval
            }
        case <-s.Closed():
            return
        }
    }
透过 pprof 的 goroutine 查看, 该 goroutine 是停在 select
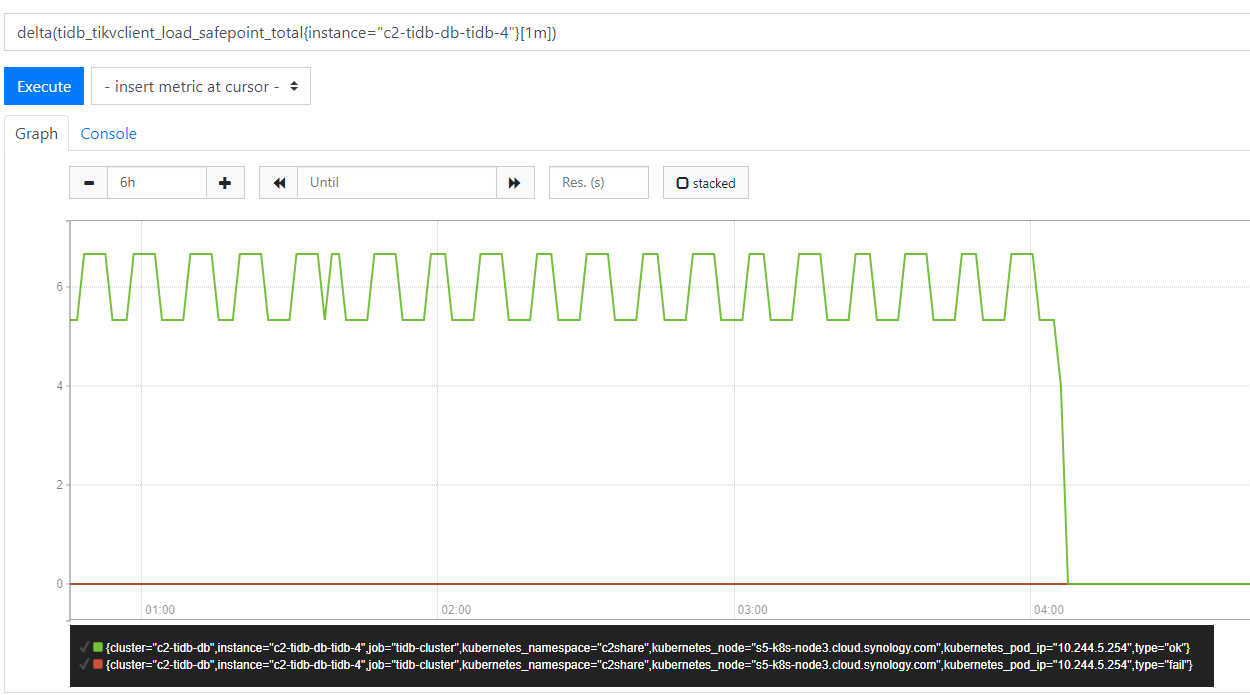
正常情况下, 至少每 10 秒应该会去执行一次 loadSafePoint, 不管成功或失败, 都会去更新 metrics.TiKVLoadSafepointCounter
但该 goroutine 卡住时, 从下图可以看到 metrics.TiKVLoadSafepointCounter 停止增加 (04:05)
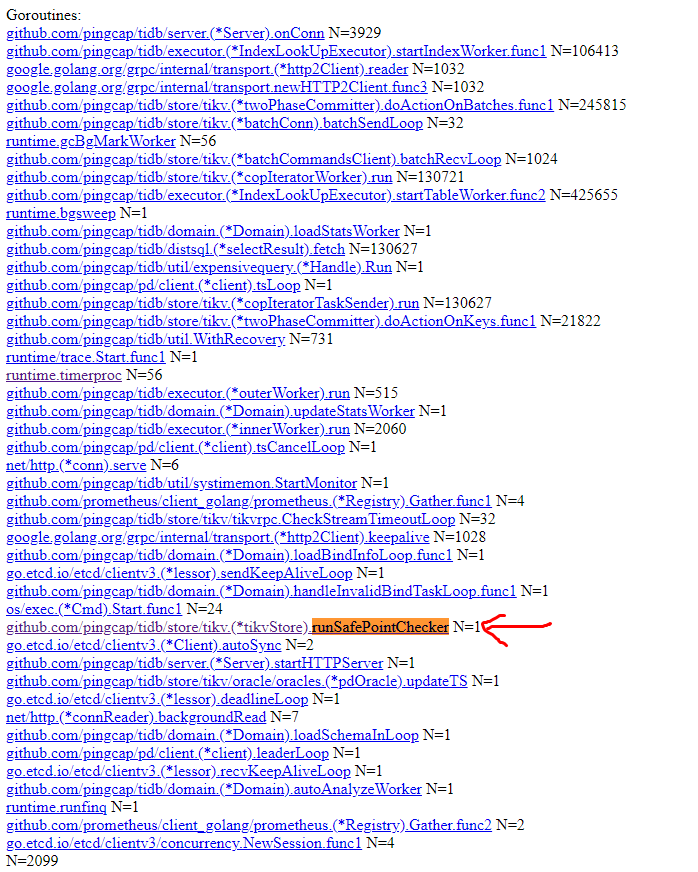
透过 pprof 的 trace 收集 30 秒的纪录, 可以看到 runSafePointChecker 的 goroutine 在这 30 秒似乎没有触發
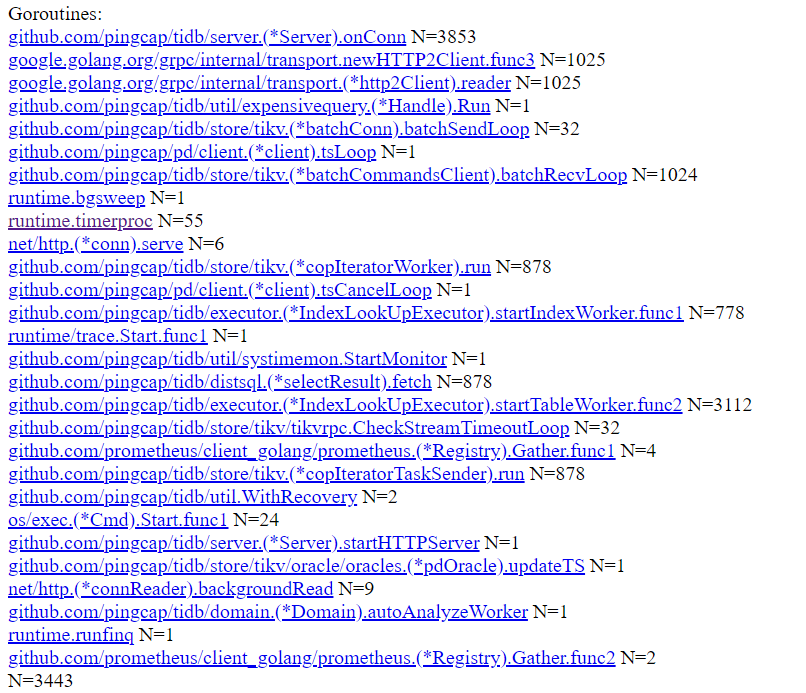
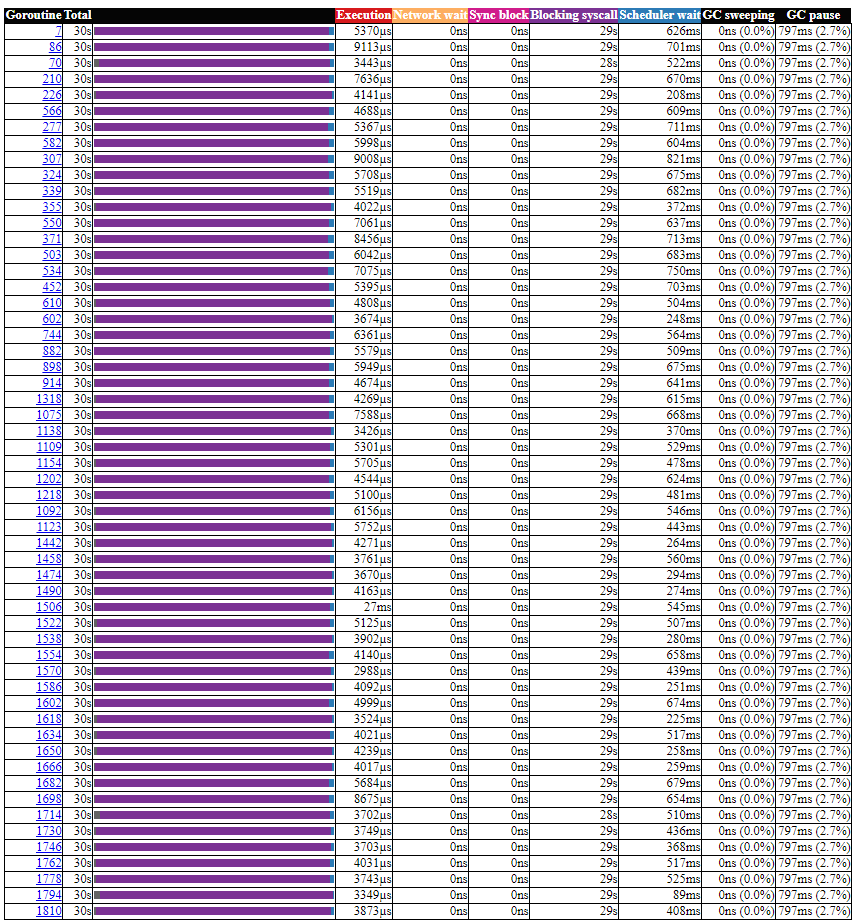
下图是正常 TiDB 的 trace 截图, 可以看到 runSafePointChecker 的 goroutine
查看 runtime.timerproc, 异常的 TiDB 有些 goroutine 的 bar 是灰色的 (unknown)
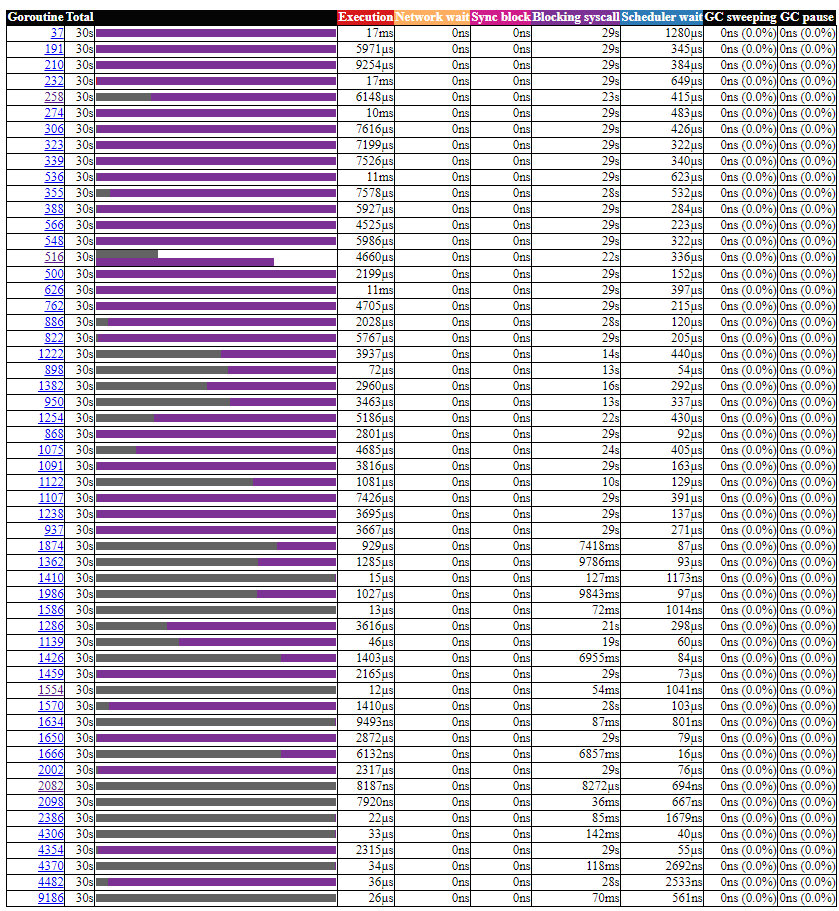
但如果是正常的 TiDB, runtime.timerproc 应该是紫色的, 大部分的时间应该是处于 Blocking syscall 的状态
从上面的资讯推论起来, 应该是 runtime.timerproc 有点异常, 导致 time.After(d) 没被触發.
目前查看了一下, 比较类似的问题应该是 https://github.com/golang/go/issues/14561
这个问题在 golang 1.14 有改善 https://github.com/golang/go/issues/24543
【我的疑问】:
- 不知道老师们是否有遇过类似的问题? 是否有什麽解决的方法
- 如果没有遇过的话, TiDB 有计画要升级到 golang 1.14 吗? 预计的时间大概是什麽时候