操作步骤:
1.将 TiDB Ansible 及 inventory.ini 配置导入到 TiUP (成功)
2.滚动升级 TiDB 集群 (成功)
3.升级后验证 (正常)
4.在原有 TiDB 集群上新增 TiFlash 组件 (成功)
tiup cluster display <cluster-name>如下:
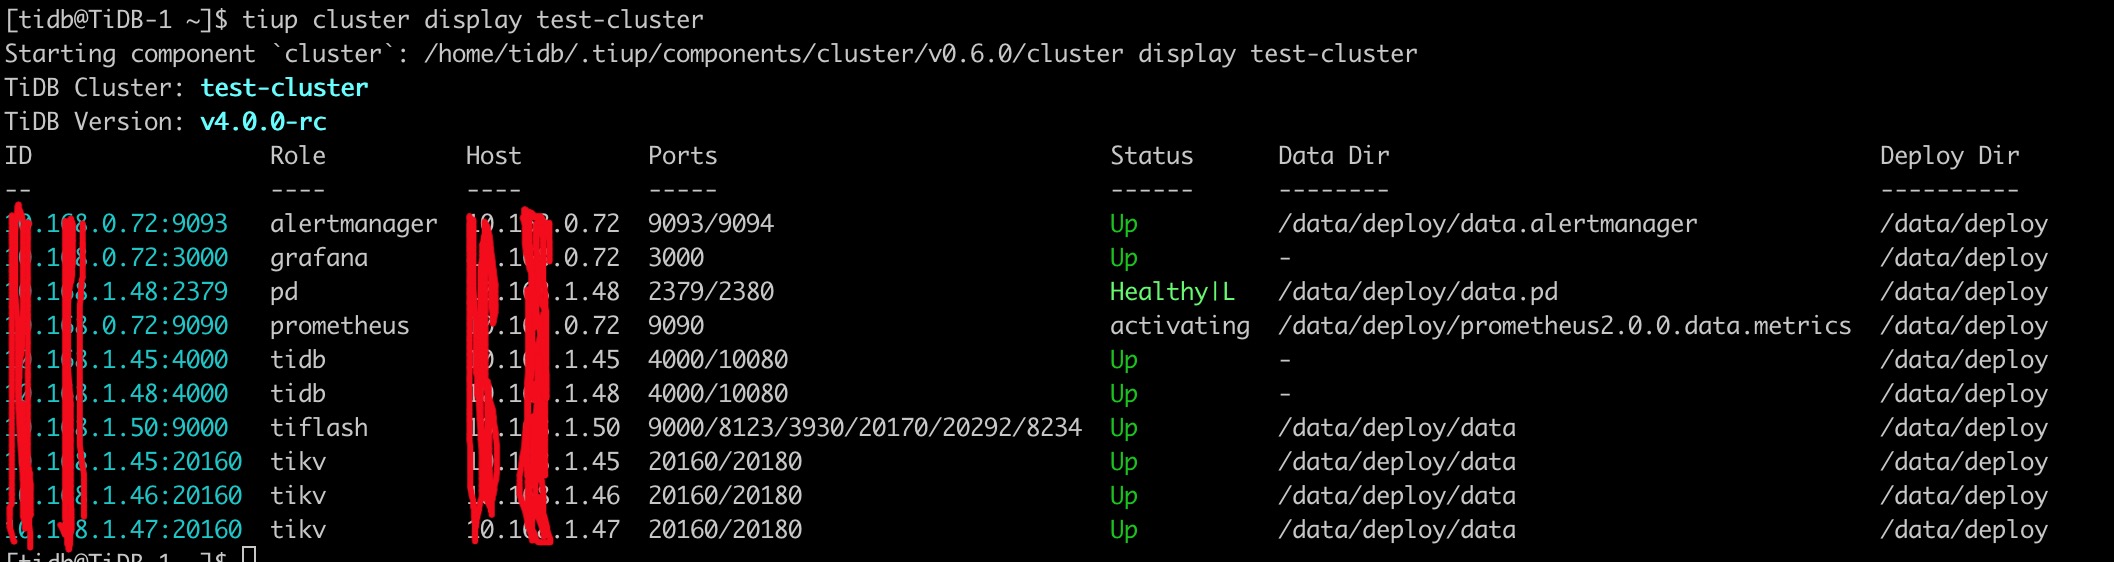
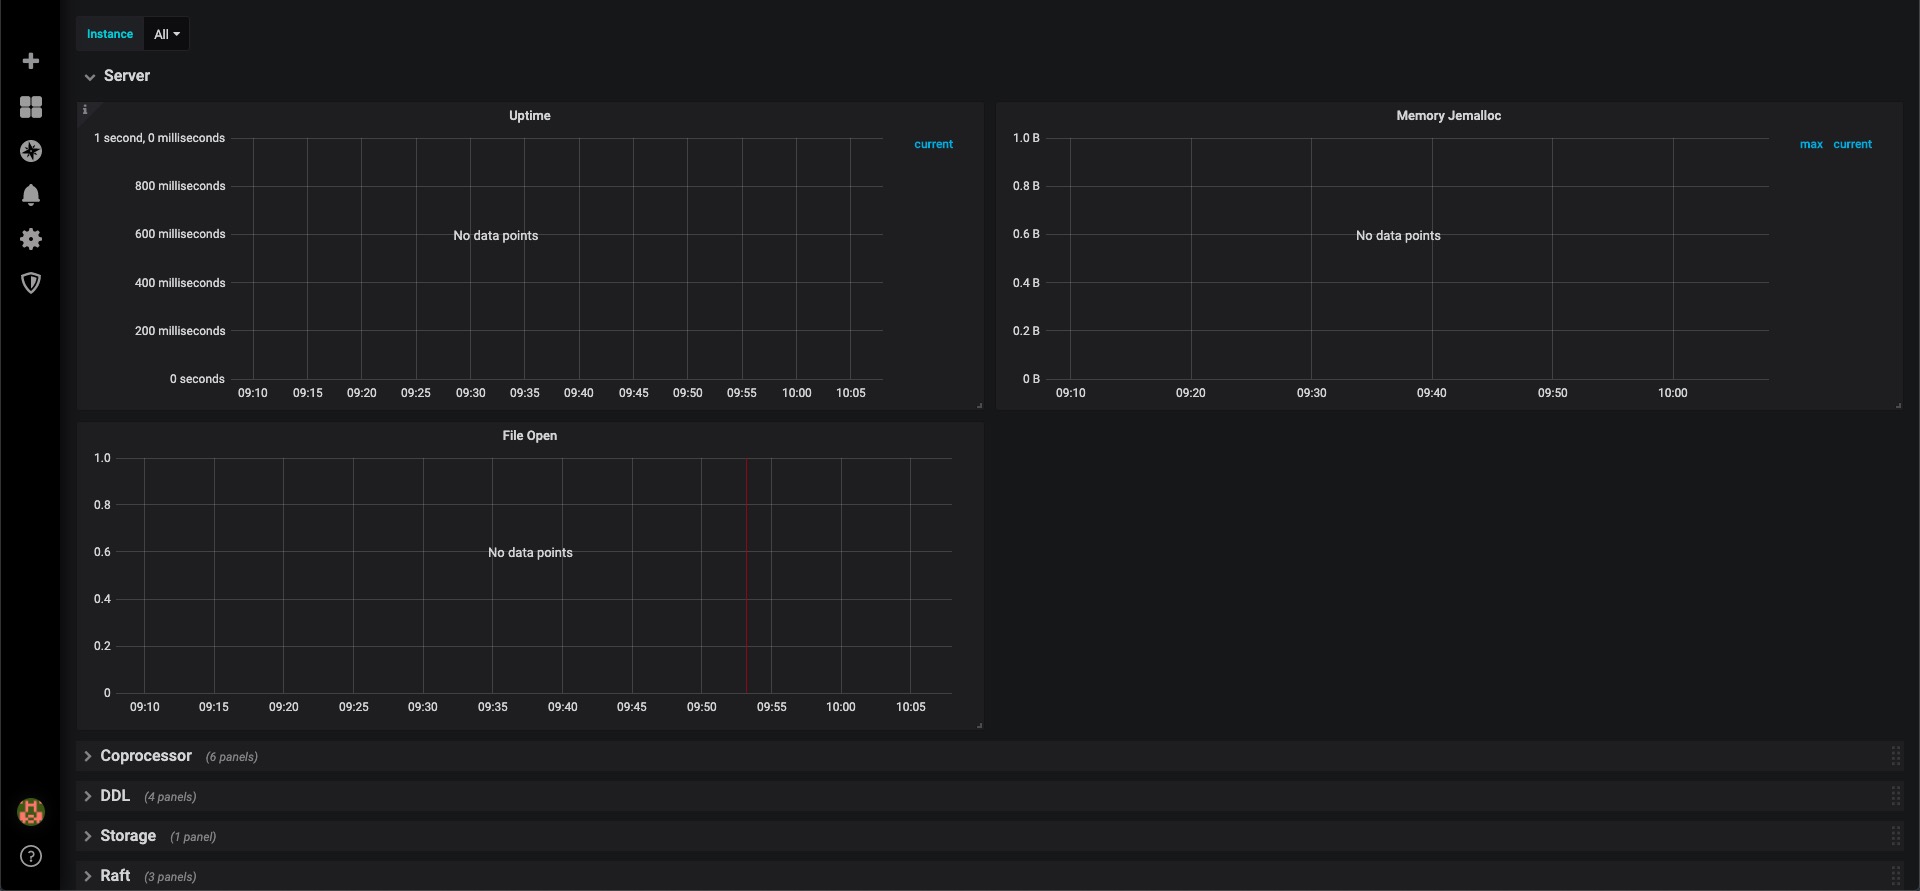
grafana监控上其他组件的监控数据正常,tiflash无监控数据
tiup cluster restart <cluster-name> 后问题依旧
操作步骤:
1.将 TiDB Ansible 及 inventory.ini 配置导入到 TiUP (成功)
2.滚动升级 TiDB 集群 (成功)
3.升级后验证 (正常)
4.在原有 TiDB 集群上新增 TiFlash 组件 (成功)
tiup cluster display <cluster-name>如下:
grafana监控上其他组件的监控数据正常,tiflash无监控数据
tiup cluster restart <cluster-name> 后问题依旧
您好,请问下第一步(将 TiDB Ansible 及 inventory.ini 配置导入到 TiUP )完成后,是否有验证 prometheus 以及 grafana 显示正常?另外可以看下 prometheus 的日志看下是否有异常,辛苦。
promethus报错日志:
level=info ts=2020-05-15T01:00:00.751991505Z caller=head.go:536 component=tsdb msg=“head GC completed” duration=36.466802ms
level=info ts=2020-05-15T01:00:01.872470833Z caller=head.go:583 component=tsdb msg=“WAL checkpoint complete” first=2068 last=2069 duration=1.120398281s
/data/deploy/scripts/run_prometheus.sh: line 13: /data/deploy/bin/prometheus: Is a directory
/data/deploy/scripts/run_prometheus.sh: line 13: exec: /data/deploy/bin/prometheus: cannot execute: Is a directory
我发现
/data/deploy/scripts/run_prometheus.sh: line 13: exec: /data/deploy/bin/prometheus 中的这个路径是错的,正确的是/data/deploy/bin/prometheus/prometheus,我改为/data/deploy/bin/prometheus/prometheus后重启后promethus状态正常
您好,请问下 ansible 部署时 prometheus 是正常的吗?另外方便提供下 import 时的 TiUP 日志吗?我们查下这个问题,多谢。
您好 我碰到了一样的问题,我还需要单独开一个主题吗?
我发现同样的问题是因为时间不一致造成,使用
ntpstat
查看时间是否同步正常