部署环境:
188.30.0.14 tikv 单机2实例
188.30.0.11 tikv 单机2实例
188.30.0.12 pd、tidb、monitoring_servers、grafana_servers、alertmanager_servers: 混合部署
部署topology.yaml文件内容如下:
[tidb@vm01test]$ cat /home/tidb/topology.yaml
global:
user: “tidb”
ssh_port: 22
deploy_dir: “/data/tidb/tidb-deploy”
data_dir: “/data/tidb/tidb-data”
server_configs:
tikv:
readpool.storage.use-unified-pool: false
readpool.coprocessor.use-unified-pool: true
storage.block-cache.shared: true
pd:
replication.location-labels: [“host”]
replication.enable-placement-rules: true
#tidb:
performance.txn-total-size-limit: 536870912
pd_servers:
- host: 188.30.0.12
tidb_servers: - host: 188.30.0.12
tikv_servers:
- host: 188.30.0.11
port: 20160
status_port: 20180
#numa_node: “0”
config:
server.labels: { host: “tikv1” }
readpool.unified.max-thread-count: 6
storage.block-cache.capacity: 7
raftstore.capactiy: 200 - host: 188.30.0.11
port: 20161
status_port: 20181
#numa_node: “1”
config:
server.labels: { host: “tikv1” }
readpool.unified.max-thread-count: 6
storage.block-cache.capacity: 7
raftstore.capactiy: 200 - host: 188.30.0.14
port: 20160
status_port: 20180
#numa_node: “0”
config:
server.labels: { host: “tikv2” }
readpool.unified.max-thread-count: 3
storage.block-cache.capacity: 3
raftstore.capactiy: 200 - host: 188.30.0.14
port: 20161
status_port: 20181
#numa_node: “1”
config:
server.labels: { host: “tikv2” }
readpool.unified.max-thread-count: 3
storage.block-cache.capacity: 3
raftstore.capactiy: 200
#tiflash_servers:
- host: 10.0.1.10
monitoring_servers:
- host: 188.30.0.12
grafana_servers:
- host: 188.30.0.12
alertmanager_servers:
- host: 188.30.0.12
部署和启动集群都没有报错。
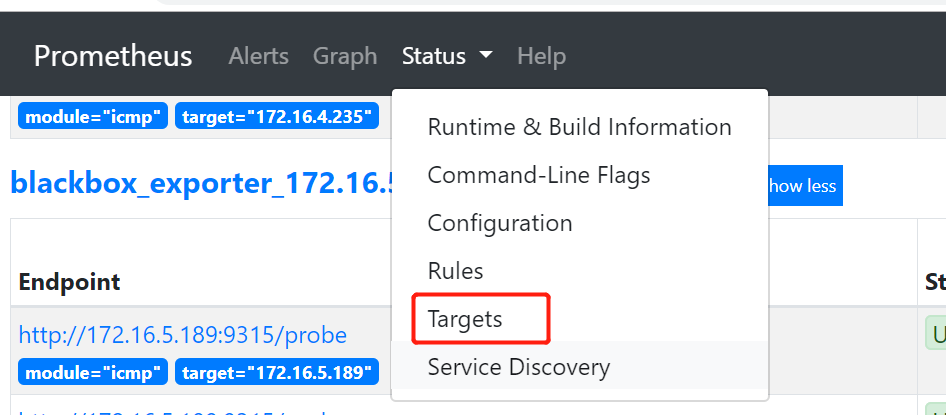
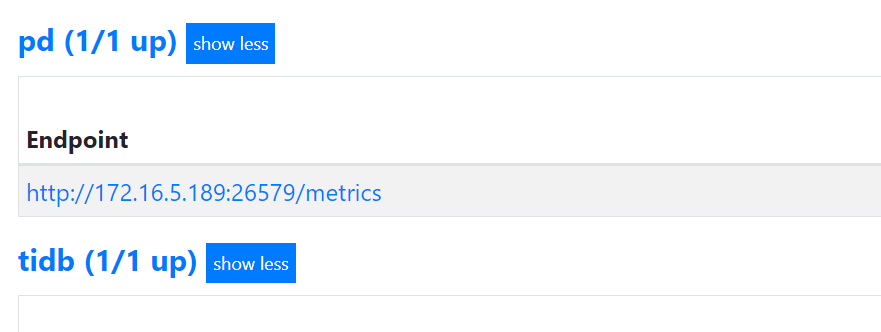
目前有的监控面板如下图:
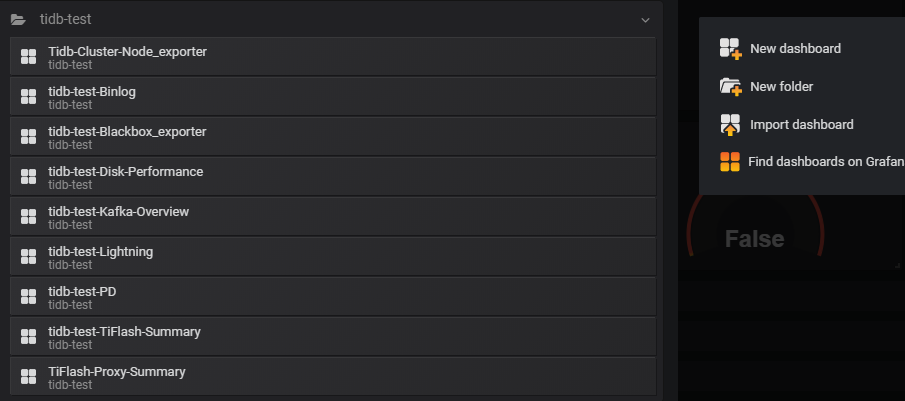
缺少很多其他面板(像tidb-test-overview、tidb-test-tidb、tidb-test-tikv等)
组件grafana,prometheus重启后,监控面板仍然没有恢复。
tiup cluster restart tidb-test -R grafana,prometheus