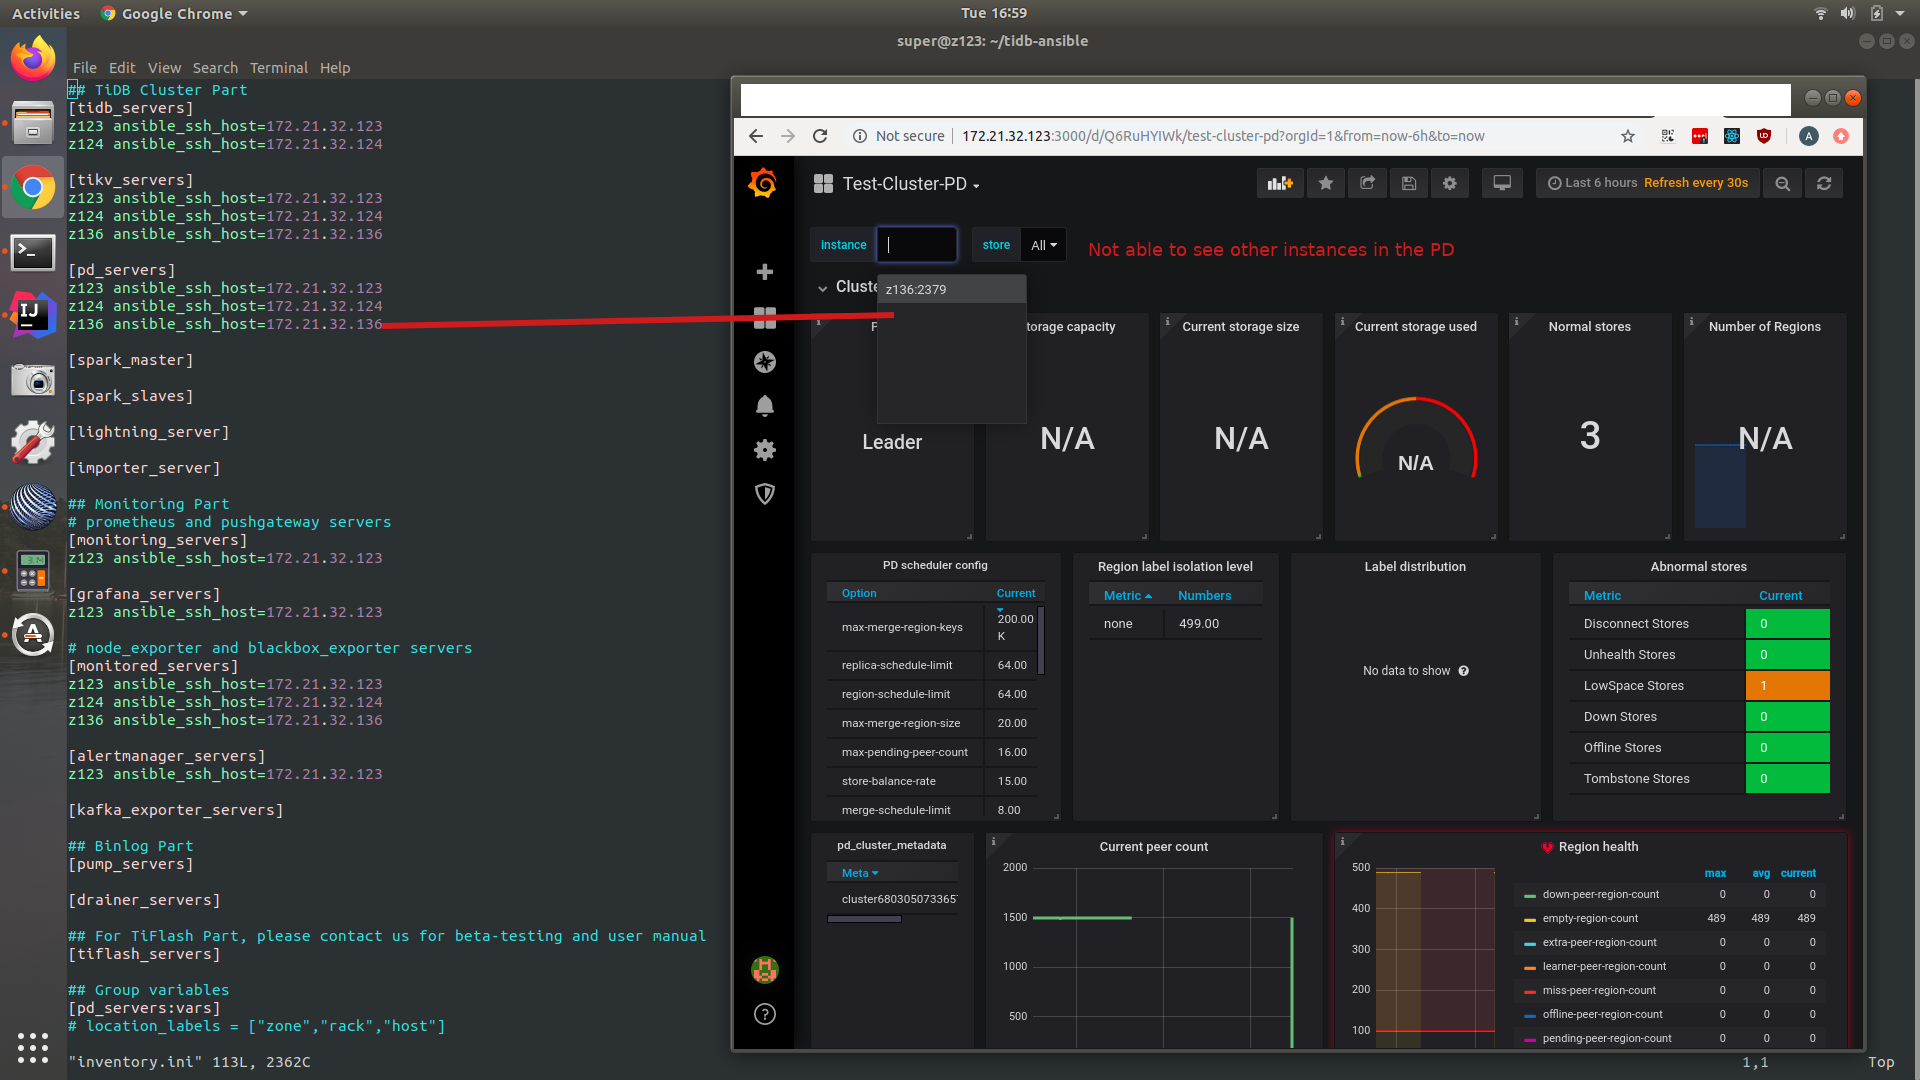
Hi , we have just deployed TiDB 4 and sometimes, Grafana does not show metric for all components in our cluster , how can we debug this ?
We have already tried to restart the entire cluster with ansible, but the data is still missing.
Hi , we have just deployed TiDB 4 and sometimes, Grafana does not show metric for all components in our cluster , how can we debug this ?
We have already tried to restart the entire cluster with ansible, but the data is still missing.
Hello Friend;
(1) Please execute command " curl http://172.21.32.123:20180/metrics | more " on server 172.21.32.123 ,check if have TiKV metrics .
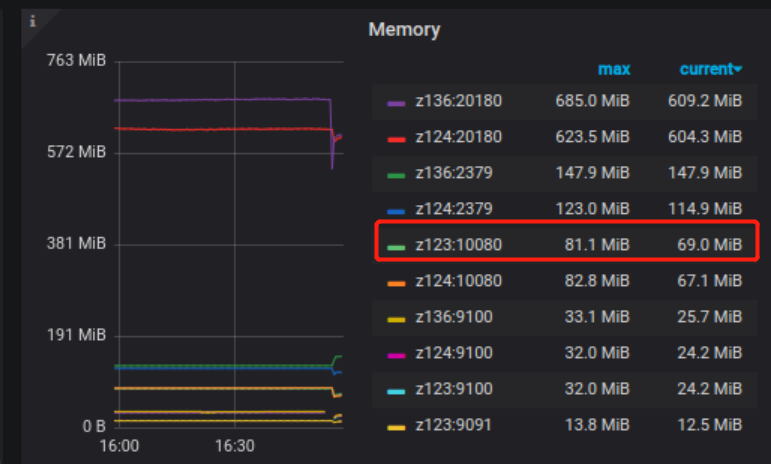
(2) From your picture , I see memory have z123 metric , . please check if your z123 server port 20180 is open.
(3) Please check if have firewall forbidden z123 port 20180.
Hi, I just checked, we are using Release Version: v4.0.0-beta.1-12-g8ccbcd36 Git Commit Hash: 8ccbcd36d6e4210af69152672797ac716ba947d1 Git Branch: master
when I curl the .123 machine on port 20180, it returned data as expected : curl http://172.21.32.123:20180/metrics | head -n 30 … > # TYPE gc_command_total counter > gc_command_total{type=“gc”} 0 > gc_command_total{type=“physical_scan_lock”} 0 > gc_command_total{type=“unsafe_destroy_range”} 1 > # HELP process_cpu_seconds_total Total user and system CPU time spent in seconds. > # TYPE process_cpu_seconds_total counter > process_cpu_seconds_total 4733.78 > # HELP process_max_fds Maximum number of open file descriptors. > # TYPE process_max_fds gauge > process_max_fds 1000000 > # HELP process_open_fds Number of open file descriptors. > # TYPE process_open_fds gauge > process_open_fds 583 > # HELP process_resident_memory_bytes Resident memory size in bytes. > # TYPE process_resident_memory_bytes gauge > process_resident_memory_bytes 620417024 > # HELP process_start_time_seconds Start time of the process since unix epoch in seconds. > # TYPE process_start_time_seconds gauge > process_start_time_seconds 1588107317.63 > # HELP process_virtual_memory_bytes Virtual memory size in bytes. > # TYPE process_virtual_memory_bytes gauge > process_virtual_memory_bytes 2430304256 > # HELP tikv_allocator_stats Allocator stats > # TYPE tikv_allocator_stats gauge > tikv_allocator_stats{type=“active”} 676651008 > tikv_allocator_stats{type=“allocated”} 646851752 > tikv_allocator_stats{type=“dirty”} 142768064
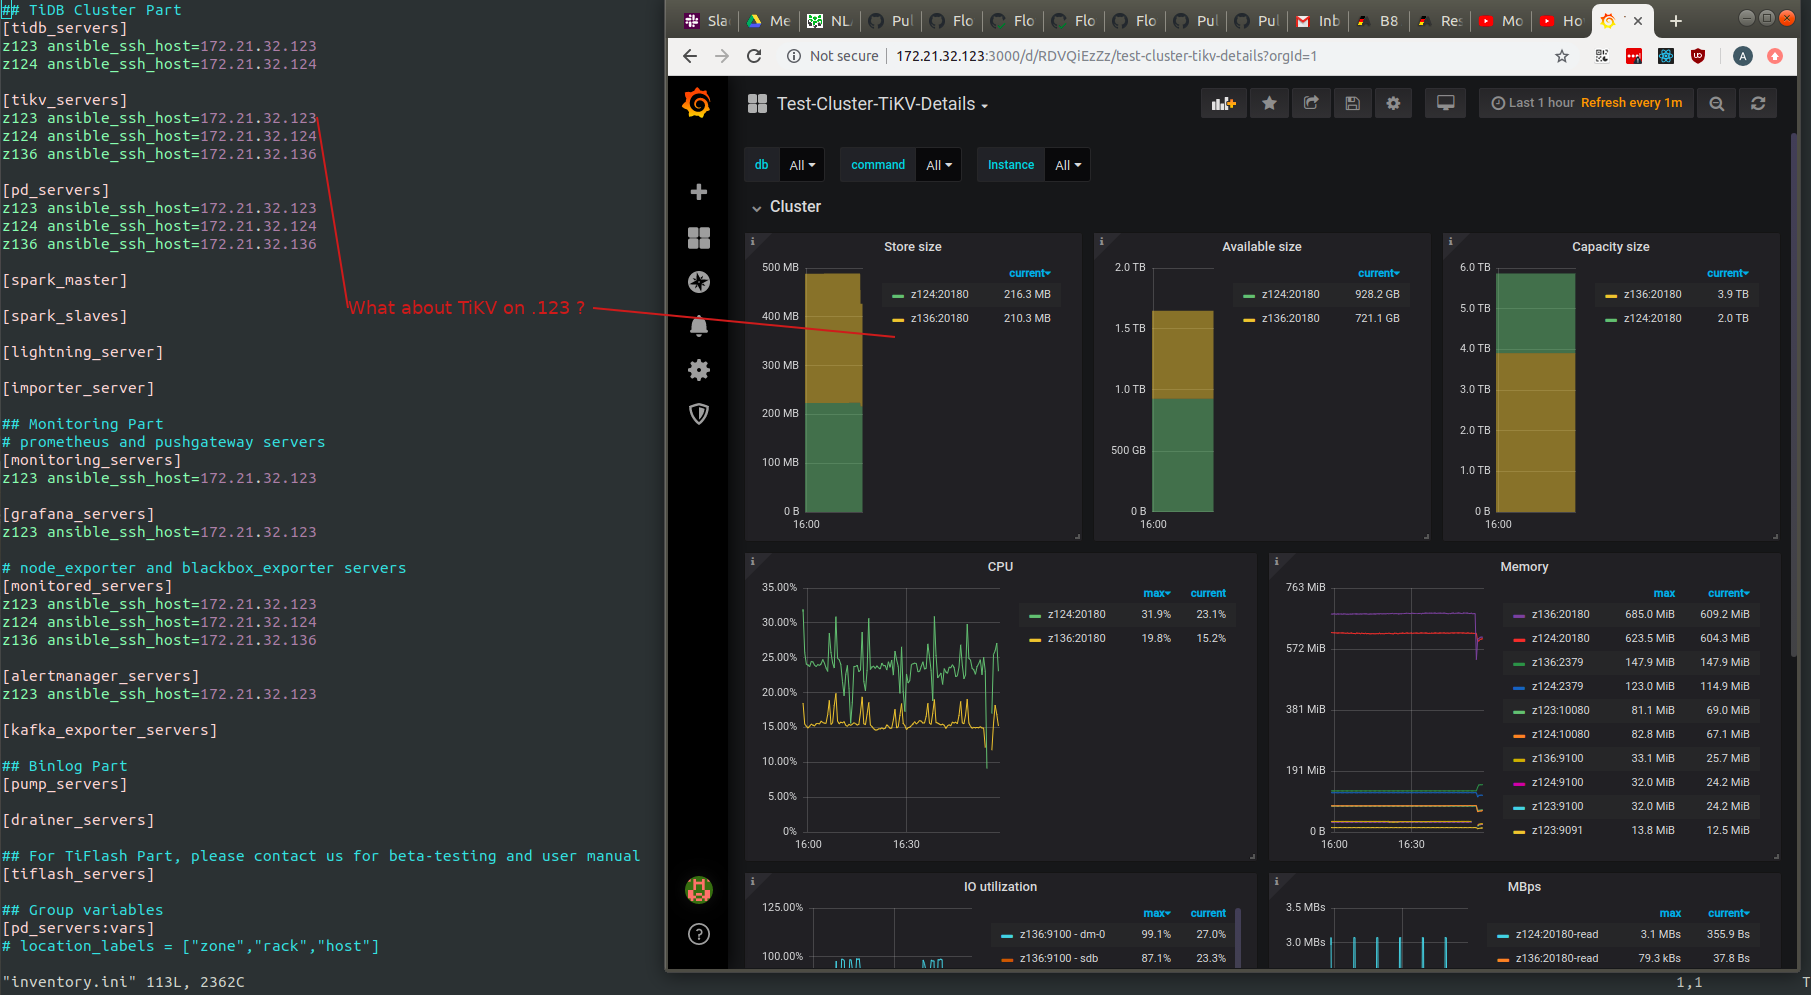
Yes , you are right, some of the Grafana charts show all machines in the cluster, just some charts do not populate for all machines (.123 in this case)
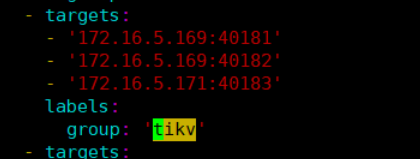
The path is your deploy dir, maybe like : <deploy_dir>/prometheus-9090/conf/prometheus.yml.
please use vi check static_configs parameter if tikv group include z123 instance.
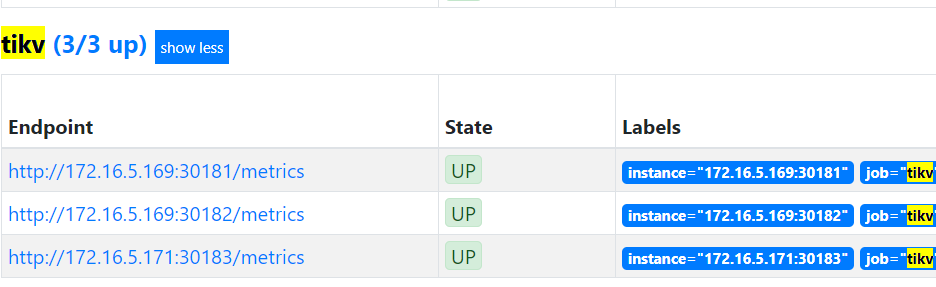
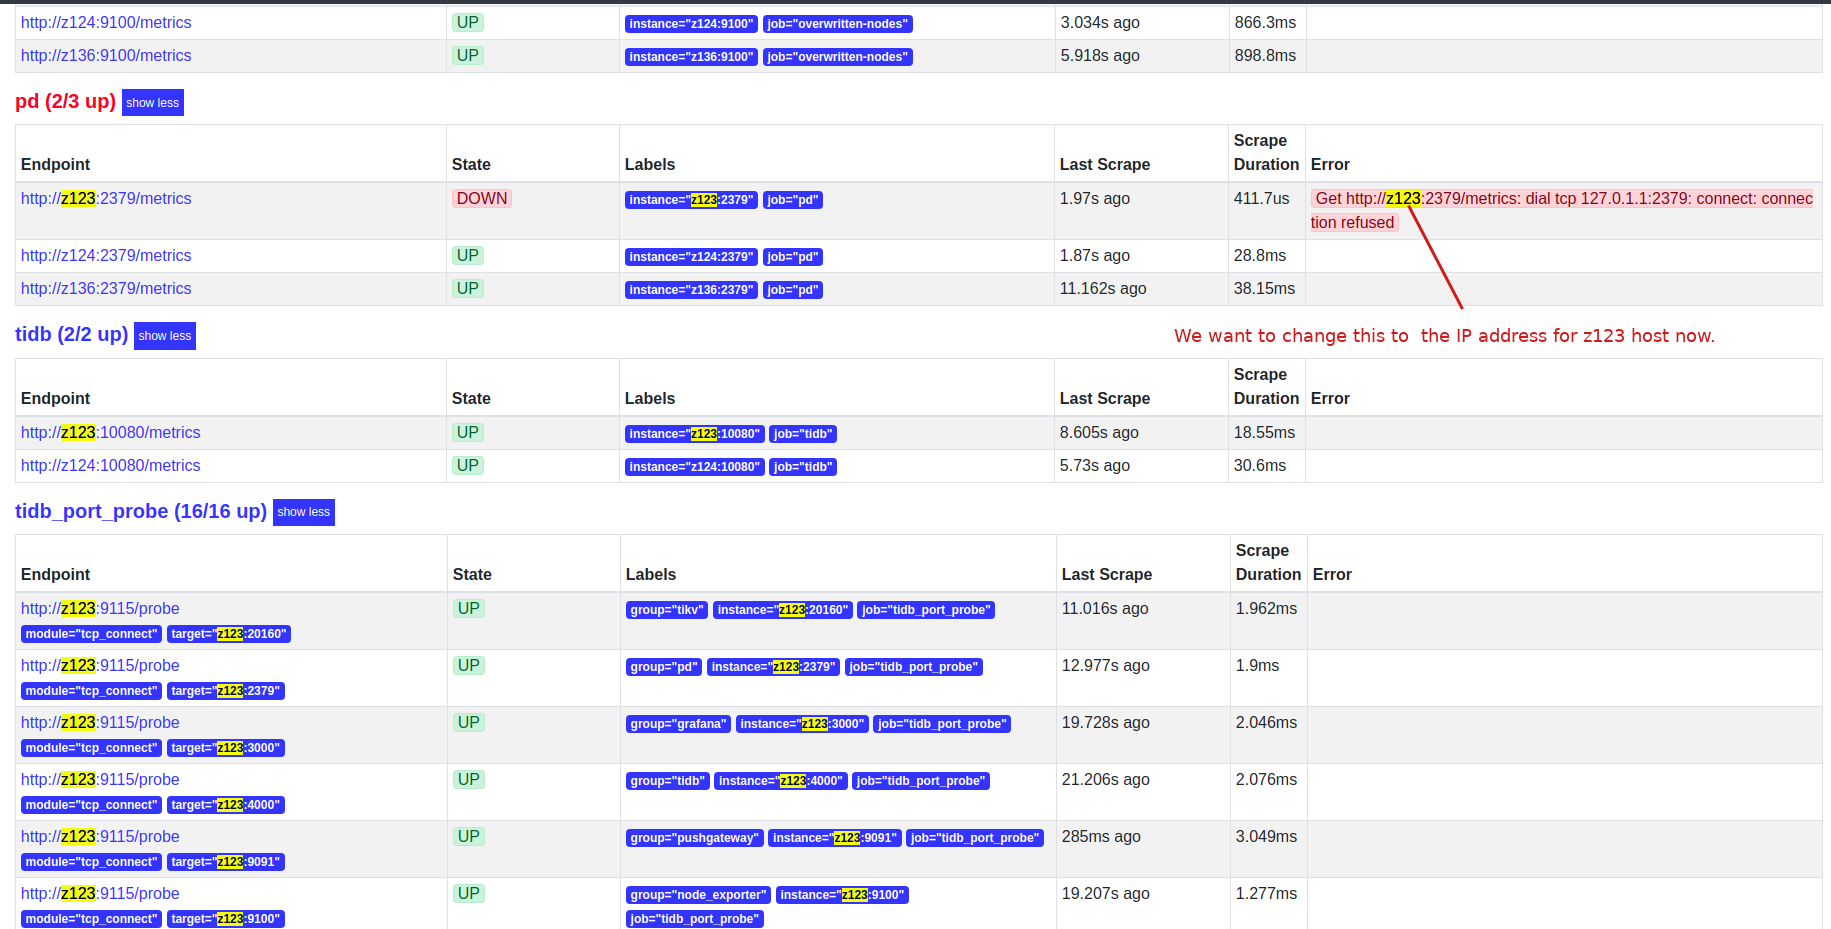
logon on your prometheus web. 172.21.32.123:9090 , choose status—> targets, check your tikv information.
If include z123 information. Please check if your web machine and z123 server have firewall ? if yes, please open z123 server 20180 port.
Thanks, this appears to be the problem for us. Our DNS name for “z123” has some issues and points to 172.0.1.1 instead of 172.0.0.1 localhost.
We now want to reset everything on TiDB to use just IP addresses and not host names, how can we use ansible-playbook
**to do it ? **
**Our configurations can be found here : https://pastebin.com/raw/zFTiFbFX **
ansible-playbook rolling_update and then rolling_update_monitor ?
hello friend:
Ansible not support ansible_ssh_host parameter now.
https://docs.ansible.com/ansible/2.3/intro_inventory.html
PD instance not support modify ip , you need scale out first ,then scale in (I think you’d better use Tiup deploy. destroy ansible environment , then deploy use tiup)
https://pingcap.com/docs/stable/how-to/scale/with-ansible/
If your environment is test environment and no data now. In 4.0 we recommend you to use tiup deploy TiDB.
https://pingcap.com/docs/stable/how-to/deploy/orchestrated/tiup/
4.0.0-RC have published, I think you’d better use RC release test.
makes sense, thanks.
![]()
此话题已在最后回复的 1 分钟后被自动关闭。不再允许新回复。