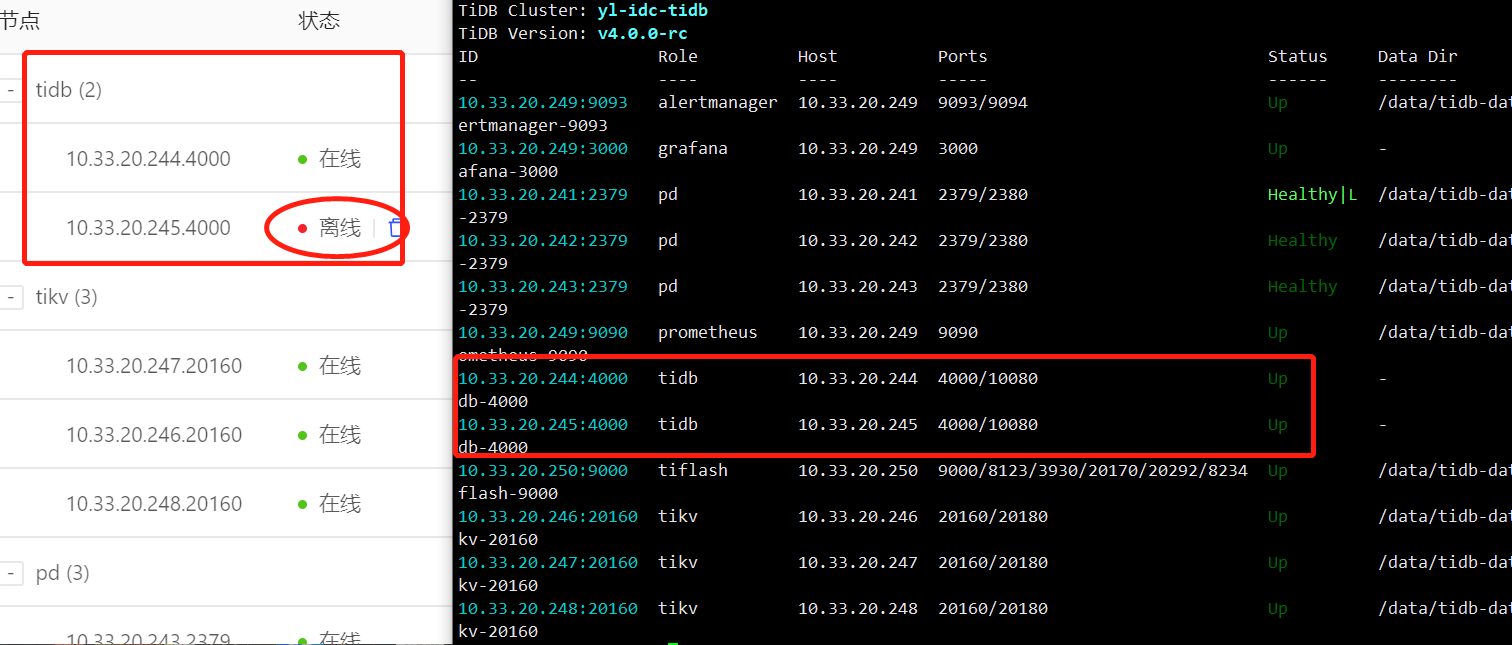
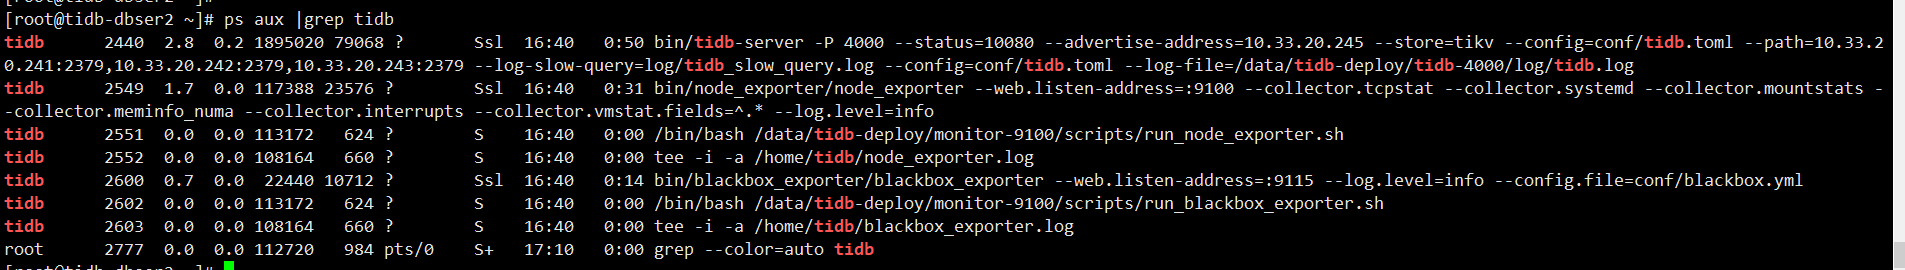
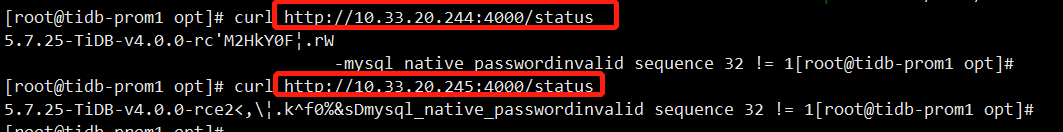
如图所示,命令行查看node是up状态。通过mysql客户端工具连接两个node都是能够正常使用的,但是dashboard显示为离线状态。
您好: 请问是否有一个是扩容的tidb? 如果是,是否有添加监控的进程给这个tidb
# # Global variables are applied to all deployments and as the default value of
# # them if the specific deployment value missing.

global:
  user: "tidb"
  ssh_port: 22
  deploy_dir: "/data/tidb-deploy"
  data_dir: "/data/tidb-data"

# # Monitored variables are used to all the machine
monitored:
  node_exporter_port: 9100
  blackbox_exporter_port: 9115
  # deploy_dir: "/tidb-deploy/monitored-9100"
  # data_dir: "/tidb-data/monitored-9100"
  # log_dir: "/tidb-deploy/monitored-9100/log"

# # Server configs are used to specify the runtime configuration of TiDB components
# # All configuration items can be found in TiDB docs:
# # - TiDB: https://pingcap.com/docs/stable/reference/configuration/tidb-server/configuration-file/
# # - TiKV: https://pingcap.com/docs/stable/reference/configuration/tikv-server/configuration-file/
# # - PD: https://pingcap.com/docs/stable/reference/configuration/pd-server/configuration-file/
# # All configuration items use points to represent the hierarchy, e.g:
# #   readpool.storage.use-unified-pool
# #           ^       ^
# # You can overwrite this configuration via instance-level `config` field

server_configs:
  tidb:
    log.slow-threshold: 300
    binlog.enable: false
    binlog.ignore-error: false
  tikv:
    # server.grpc-concurrency: 4
    # raftstore.apply-pool-size: 2
    # raftstore.store-pool-size: 2
    # rocksdb.max-sub-compactions: 1
    # storage.block-cache.capacity: "16GB"
    # readpool.unified.max-thread-count: 12
    readpool.storage.use-unified-pool: true
    readpool.coprocessor.use-unified-pool: true
  pd:
    schedule.leader-schedule-limit: 4
    schedule.region-schedule-limit: 2048
    schedule.replica-schedule-limit: 64
    replication.enable-placement-rules: true
  tiflash:
    logger.level: "info"
  # pump:
  #   gc: 7

pd_servers:
  - host: 10.33.20.241
  - host: 10.33.20.242
  - host: 10.33.20.243

tidb_servers:
  - host: 10.33.20.244
  - host: 10.33.20.245

tikv_servers:
  - host: 10.33.20.246
  - host: 10.33.20.247
  - host: 10.33.20.248

tiflash_servers:
  - host: 10.33.20.251
  # ssh_port: 22
  # tcp_port: 9000
  # http_port: 8123
  # flash_service_port: 3930
  # flash_proxy_port: 20170
  # flash_proxy_status_port: 20292
  # metrics_port: 8234
  # deploy_dir: /tidb-deploy/tiflash-9000
  # data_dir: /tidb-data/tiflash-9000
  # log_dir: /tidb-deploy/tiflash-9000/log
  # numa_node: "0,1"
  # # Config is used to overwrite the `server_configs.tiflash` values
  # config:
  #   logger.level: "info"
  # learner_config:
  #   log-level: "info"
  #  - host: 10.0.1.15
  #  - host: 10.0.1.16

# pump_servers:
#   - host: 10.0.1.17
#     ssh_port: 22
#     port: 8250
#     deploy_dir: "/tidb-deploy/pump-8249"
#     data_dir: "/tidb-data/pump-8249"
#     log_dir: "/tidb-deploy/pump-8249/log"
#     numa_node: "0,1"
#     # Config is used to overwrite the `server_configs.drainer` values
#     config:
#       gc: 7
#   - host: 10.0.1.18
#   - host: 10.0.1.19

# drainer_servers:
#   - host: 10.0.1.17
#     port: 8249
#     data_dir: "/tidb-data/drainer-8249"
#     # if drainer doesn't have checkpoint, use initial commitTS to initial checkpoint
#     # will get a latest timestamp from pd if setting to be -1 (default -1)
#     commit_ts: -1
#     deploy_dir: "/tidb-deploy/drainer-8249"
#     log_dir: "/tidb-deploy/drainer-8249/log"
#     numa_node: "0,1"
#     # Config is used to overwrite the `server_configs.drainer` values
#     config:
#       syncer.db-type: "mysql"
#       syncer.to.host: "127.0.0.1"
#       syncer.to.user: "root"
#       syncer.to.password: ""
#       syncer.to.port: 3306
#   - host: 10.0.1.19


monitoring_servers:
  - host: 10.33.20.249
    # ssh_port: 22
    # port: 9090
    # deploy_dir: "/tidb-deploy/prometheus-8249"
    # data_dir: "/tidb-data/prometheus-8249"
    # log_dir: "/tidb-deploy/prometheus-8249/log"

grafana_servers:
  - host: 10.33.20.249
    # port: 3000
    # deploy_dir: /tidb-deploy/grafana-3000

alertmanager_servers:
  - host: 10.33.20.249
    # ssh_port: 22
    # web_port: 9093
    # cluster_port: 9094
    # deploy_dir: "/tidb-deploy/alertmanager-9093"
    # data_dir: "/tidb-data/alertmanager-9093"
    # log_dir: "/tidb-deploy/alertmanager-9093/log"

你好,关于 Dashboard 上 TiDB 显示为离线状态的问题,可能是一个目前还没有发现的 bug。如果您愿意帮助我们排查问题所在的话,劳烦执行以下以下命令,并回复我们命令的执行结果:
etcdctl get /topology/tidb --prefix --endpoints=127.0.0.1:2379
其中 127.0.0.1:2379 需要替换为 pd IP。etcdctl 二进制(适用于 Mac / Linux)可以从这里下载:https://github.com/etcd-io/etcd/releases
已经解决了。是因为245那个node的dnsserver设置有误;但是我不知道其中的关系是什么,我的dnsserver设置的是一个公网地址;修改为正确的dnsserver之后 245这个node成功在线了
此话题已在最后回复的 1 分钟后被自动关闭。不再允许新回复。