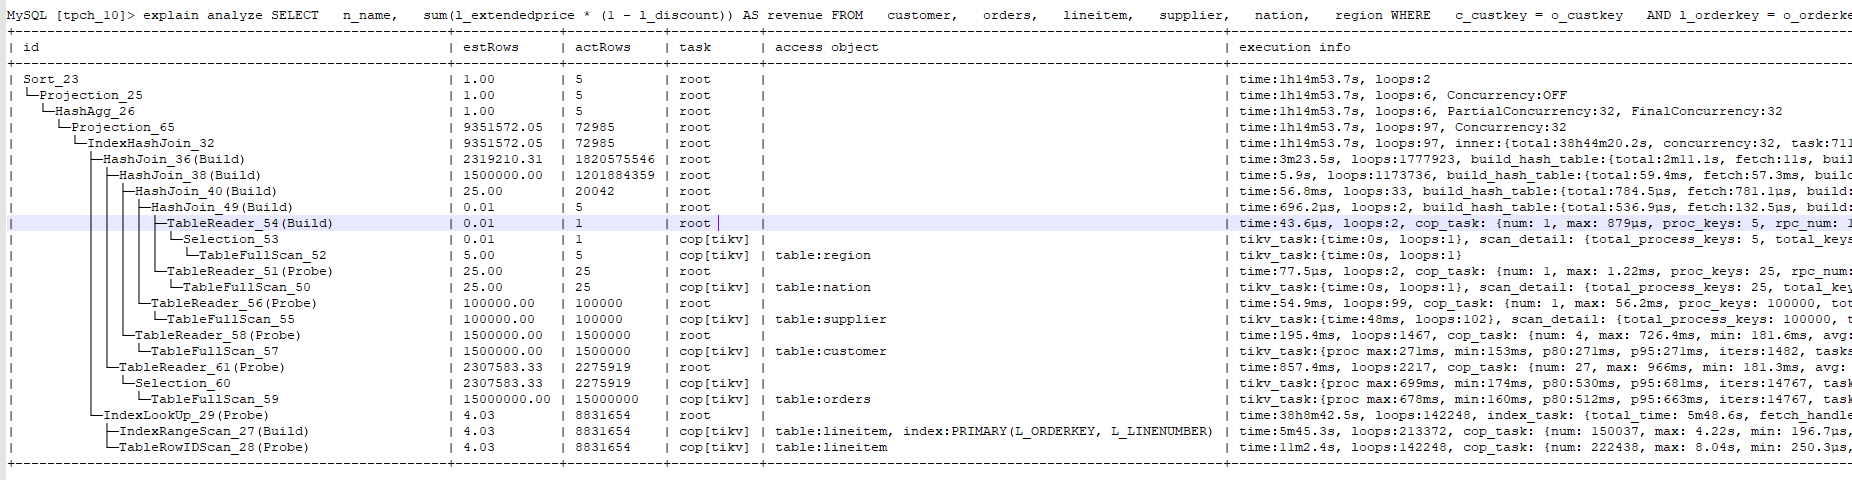
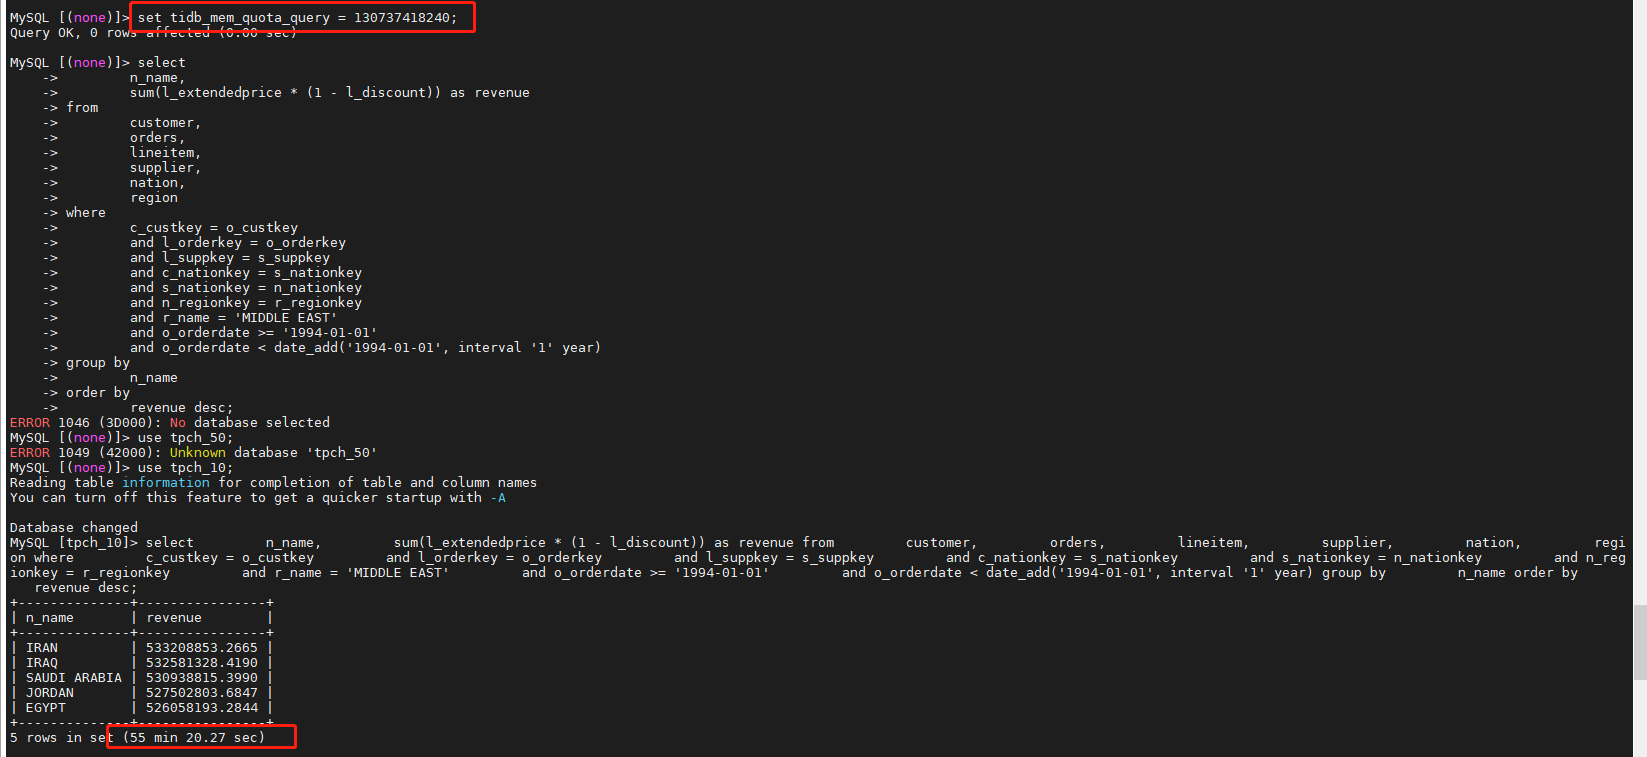
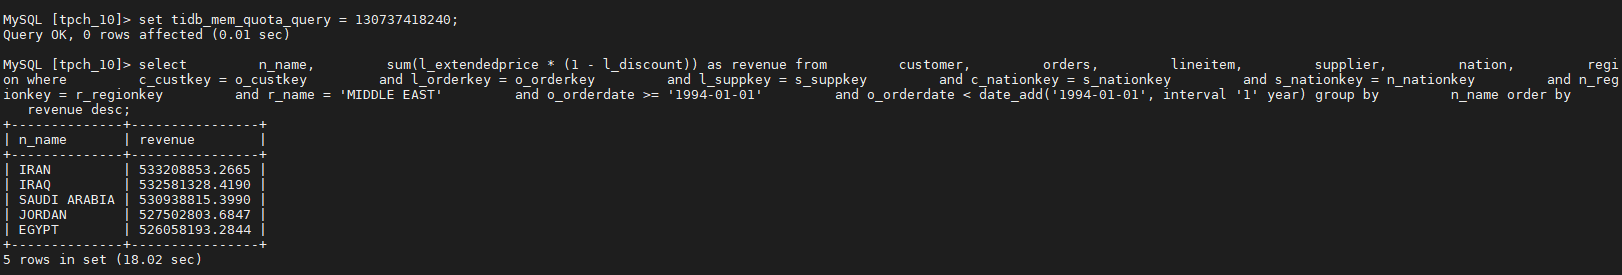
MySQL [tpch_10]> explain analyze SELECT n_name, sum(l_extendedprice * (1 - l_discount)) AS revenue FROM customer, orders, lineitem, supplier, nation, region WHERE c_custkey = o_custkey AND l_orderkey = o_orderkey AND l_suppkey = s_suppkey AND c_nationkey = s_nationkey AND s_nationkey = n_nationkey AND n_regionkey = r_regionkey AND r_name = ‘MIDDLE EAST’ AND o_orderdate >= ‘1994-01-01’ AND o_orderdate < date_add(‘1994-01-01’, INTERVAL ‘1’ year) GROUP BY n_name ORDER BY revenue DESC;
±-----------------------------------------------------±------------±-----------±----------±--------------------------------------------------------±-----------------------------------------------------------------------------------------------------------------------------------------------------------------------------------------------------------------------------------------------------------------------------------------------------------------------------------------------------------------------------------------------±------------------------------------------------------------------------------------------------------------------------------------------------------------------------------------------------------------------------------------------------±----------±--------+
| id | estRows | actRows | task | access object | execution info | operator info | memory | disk |
±-----------------------------------------------------±------------±-----------±----------±--------------------------------------------------------±-----------------------------------------------------------------------------------------------------------------------------------------------------------------------------------------------------------------------------------------------------------------------------------------------------------------------------------------------------------------------------------------------±------------------------------------------------------------------------------------------------------------------------------------------------------------------------------------------------------------------------------------------------±----------±--------+
| Sort_23 | 1.00 | 5 | root | | time:1h14m53.7s, loops:2 | Column#54:desc | 9.39 KB | 0 Bytes |
| └─Projection_25 | 1.00 | 5 | root | | time:1h14m53.7s, loops:6, Concurrency:OFF | tpch_10.nation.n_name, Column#54 | 1.88 KB | N/A |
| └─HashAgg_26 | 1.00 | 5 | root | | time:1h14m53.7s, loops:6, PartialConcurrency:32, FinalConcurrency:32 | group by:Column#60, funcs:sum(Column#58)->Column#54, funcs:firstrow(Column#59)->tpch_10.nation.n_name | 4.09 MB | N/A |
| └─Projection_65 | 9351572.05 | 72985 | root | | time:1h14m53.7s, loops:97, Concurrency:32 | mul(tpch_10.lineitem.l_extendedprice, minus(1, tpch_10.lineitem.l_discount))->Column#58, tpch_10.nation.n_name, tpch_10.nation.n_name | 2.68 MB | N/A |
| └─IndexHashJoin_32 | 9351572.05 | 72985 | root | | time:1h14m53.7s, loops:97, inner:{total:38h44m20.2s, concurrency:32, task:71124, construct:31m22.3s, fetch:38h11m8.4s, build:9m32.7s, join:1m39.7s} | inner join, inner:IndexLookUp_29, outer key:tpch_10.orders.o_orderkey, inner key:tpch_10.lineitem.l_orderkey, equal cond:eq(tpch_10.orders.o_orderkey, tpch_10.lineitem.l_orderkey), eq(tpch_10.supplier.s_suppkey, tpch_10.lineitem.l_suppkey) | 89.0 GB | N/A |
| ├─HashJoin_36(Build) | 2319210.31 | 1820575546 | root | | time:3m23.5s, loops:1777923, build_hash_table:{total:2m11.1s, fetch:11s, build:2m0s}, probe:{concurrency:32, total:39h43m44.3s, max:1h14m48s, probe:38h33m49.3s, fetch:1h9m54.9s} | inner join, equal:[eq(tpch_10.customer.c_custkey, tpch_10.orders.o_custkey)] | 33.2 GB | 0 Bytes |
| │ ├─HashJoin_38(Build) | 1500000.00 | 1201884359 | root | | time:5.9s, loops:1173736, build_hash_table:{total:59.4ms, fetch:57.3ms, build:2.1ms}, probe:{concurrency:32, total:1h9m38.8s, max:2m11.1s, probe:1h9m33s, fetch:5.8s} | inner join, equal:[eq(tpch_10.supplier.s_nationkey, tpch_10.customer.c_nationkey)] | 639.5 KB | 0 Bytes |
| │ │ ├─HashJoin_40(Build) | 25.00 | 20042 | root | | time:56.8ms, loops:33, build_hash_table:{total:784.5µs, fetch:781.1µs, build:3.36µs}, probe:{concurrency:32, total:1.82s, max:57.2ms, probe:64.6ms, fetch:1.76s} | inner join, equal:[eq(tpch_10.nation.n_nationkey, tpch_10.supplier.s_nationkey)] | 868 Bytes | 0 Bytes |
| │ │ │ ├─HashJoin_49(Build) | 0.01 | 5 | root | | time:696.2µs, loops:2, build_hash_table:{total:536.9µs, fetch:132.5µs, build:404.4µs}, probe:{concurrency:32, total:19ms, max:627.5µs, probe:24.4µs, fetch:19ms} | inner join, equal:[eq(tpch_10.region.r_regionkey, tpch_10.nation.n_regionkey)] | 20.5 KB | 0 Bytes |
| │ │ │ │ ├─TableReader_54(Build) | 0.01 | 1 | root | | time:43.6µs, loops:2, cop_task: {num: 1, max: 879µs, proc_keys: 5, rpc_num: 1, rpc_time: 823.3µs, copr_cache: disabled} | data:Selection_53 | 236 Bytes | N/A |
| │ │ │ │ │ └─Selection_53 | 0.01 | 1 | cop[tikv] | | tikv_task:{time:0s, loops:1}, scan_detail: {total_process_keys: 5, total_keys: 6} | eq(tpch_10.region.r_name, “MIDDLE EAST”) | N/A | N/A |
| │ │ │ │ │ └─TableFullScan_52 | 5.00 | 5 | cop[tikv] | table:region | tikv_task:{time:0s, loops:1} | keep order:false, stats:pseudo | N/A | N/A |
| │ │ │ │ └─TableReader_51(Probe) | 25.00 | 25 | root | | time:77.5µs, loops:2, cop_task: {num: 1, max: 1.22ms, proc_keys: 25, rpc_num: 1, rpc_time: 1.11ms, copr_cache: disabled} | data:TableFullScan_50 | 993 Bytes | N/A |
| │ │ │ │ └─TableFullScan_50 | 25.00 | 25 | cop[tikv] | table:nation | tikv_task:{time:0s, loops:1}, scan_detail: {total_process_keys: 25, total_keys: 26} | keep order:false, stats:pseudo | N/A | N/A |
| │ │ │ └─TableReader_56(Probe) | 100000.00 | 100000 | root | | time:54.9ms, loops:99, cop_task: {num: 1, max: 56.2ms, proc_keys: 100000, tot_proc: 51ms, tot_wait: 1ms, rpc_num: 1, rpc_time: 56.1ms, copr_cache: disabled} | data:TableFullScan_55 | 1.53 MB | N/A |
| │ │ │ └─TableFullScan_55 | 100000.00 | 100000 | cop[tikv] | table:supplier | tikv_task:{time:48ms, loops:102}, scan_detail: {total_process_keys: 100000, total_keys: 100001} | keep order:false | N/A | N/A |
| │ │ └─TableReader_58(Probe) | 1500000.00 | 1500000 | root | | time:195.4ms, loops:1467, cop_task: {num: 4, max: 726.4ms, min: 181.6ms, avg: 359.5ms, p95: 726.4ms, max_proc_keys: 434849, p95_proc_keys: 434849, tot_proc: 903ms, rpc_num: 4, rpc_time: 1.44s, copr_cache: disabled} | data:TableFullScan_57 | 22.9 MB | N/A |
| │ │ └─TableFullScan_57 | 1500000.00 | 1500000 | cop[tikv] | table:customer | tikv_task:{proc max:271ms, min:153ms, p80:271ms, p95:271ms, iters:1482, tasks:4}, scan_detail: {total_process_keys: 1500000, total_keys: 1500004} | keep order:false | N/A | N/A |
| │ └─TableReader_61(Probe) | 2307583.33 | 2275919 | root | | time:857.4ms, loops:2217, cop_task: {num: 27, max: 966ms, min: 181.3ms, avg: 588.3ms, p95: 966ms, max_proc_keys: 680574, p95_proc_keys: 559877, tot_proc: 12s, rpc_num: 27, rpc_time: 15.9s, copr_cache: disabled} | data:Selection_60 | 52.5 MB | N/A |
| │ └─Selection_60 | 2307583.33 | 2275919 | cop[tikv] | | tikv_task:{proc max:699ms, min:174ms, p80:530ms, p95:681ms, iters:14767, tasks:27}, scan_detail: {total_process_keys: 15000000, total_keys: 15000027} | ge(tpch_10.orders.o_orderdate, 1994-01-01 00:00:00.000000), lt(tpch_10.orders.o_orderdate, 1995-01-01) | N/A | N/A |
| │ └─TableFullScan_59 | 15000000.00 | 15000000 | cop[tikv] | table:orders | tikv_task:{proc max:678ms, min:160ms, p80:512ms, p95:663ms, iters:14767, tasks:27} | keep order:false | N/A | N/A |
| └─IndexLookUp_29(Probe) | 4.03 | 8831654 | root | | time:38h8m42.5s, loops:142248, index_task: {total_time: 5m48.6s, fetch_handle: 5m45.5s, build: 1.71s, wait: 1.43s}, table_task: {total_time: 23h36m24.8s, num: 71124, concurrency: 2275968} | | 11.6 KB | N/A |
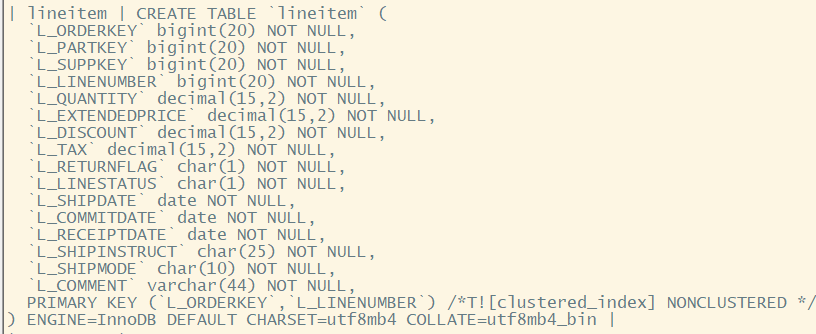
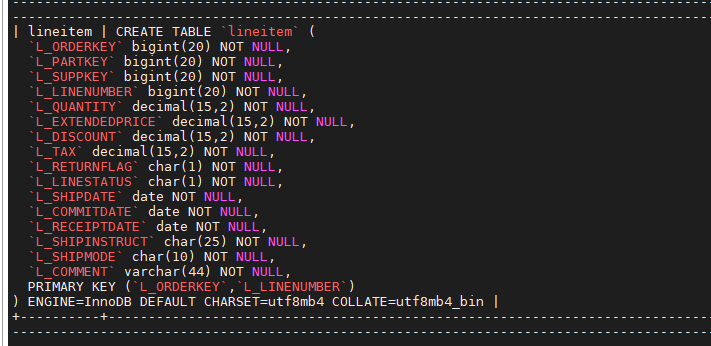
| ├─IndexRangeScan_27(Build) | 4.03 | 8831654 | cop[tikv] | table:lineitem, index:PRIMARY(L_ORDERKEY, L_LINENUMBER) | time:5m45.3s, loops:213372, cop_task: {num: 150037, max: 4.22s, min: 196.7µs, avg: 2.18ms, p95: 1.24ms, max_proc_keys: 196, p95_proc_keys: 126, tot_proc: 55.7s, tot_wait: 8.19s, rpc_num: 150037, rpc_time: 4m52.2s, copr_cache: disabled}, tikv_task:{proc max:3ms, min:0s, p80:1ms, p95:1ms, iters:287327, tasks:150037}, scan_detail: {total_process_keys: 8831654, total_keys: 11041338} | range: decided by [eq(tpch_10.lineitem.l_orderkey, tpch_10.orders.o_orderkey)], keep order:false | N/A | N/A |
| └─TableRowIDScan_28(Probe) | 4.03 | 8831654 | cop[tikv] | table:lineitem | time:11m2.4s, loops:142248, cop_task: {num: 222438, max: 8.04s, min: 250.3µs, avg: 4.18ms, p95: 1.28ms, max_proc_keys: 131, p95_proc_keys: 79, tot_proc: 52.4s, tot_wait: 10.2s, rpc_num: 222438, rpc_time: 12m25.3s, copr_cache: disabled}, tikv_task:{proc max:3ms, min:0s, p80:1ms, p95:1ms, iters:353373, tasks:222438}, scan_detail: {total_process_keys: 8831654, total_keys: 10715382} | keep order:false | N/A | N/A |
±-----------------------------------------------------±------------±-----------±----------±--------------------------------------------------------±-----------------------------------------------------------------------------------------------------------------------------------------------------------------------------------------------------------------------------------------------------------------------------------------------------------------------------------------------------------------------------------------------±------------------------------------------------------------------------------------------------------------------------------------------------------------------------------------------------------------------------------------------------±----------±--------+