[v4.0.10]执行计划中关于rpc_time的问题

为提高效率,请提供以下信息,问题描述清晰能够更快得到解决:
【 TiDB 使用环境】
版本:v4.0.10
环境:生产环境

【概述】 场景 + 问题概述
相同的sql,并且force index,问题期间从执行计划的算子信息中查看是rpc_time比正常期间更长,这个值的含义从官网有看到,但是不清楚具体原因是什么。
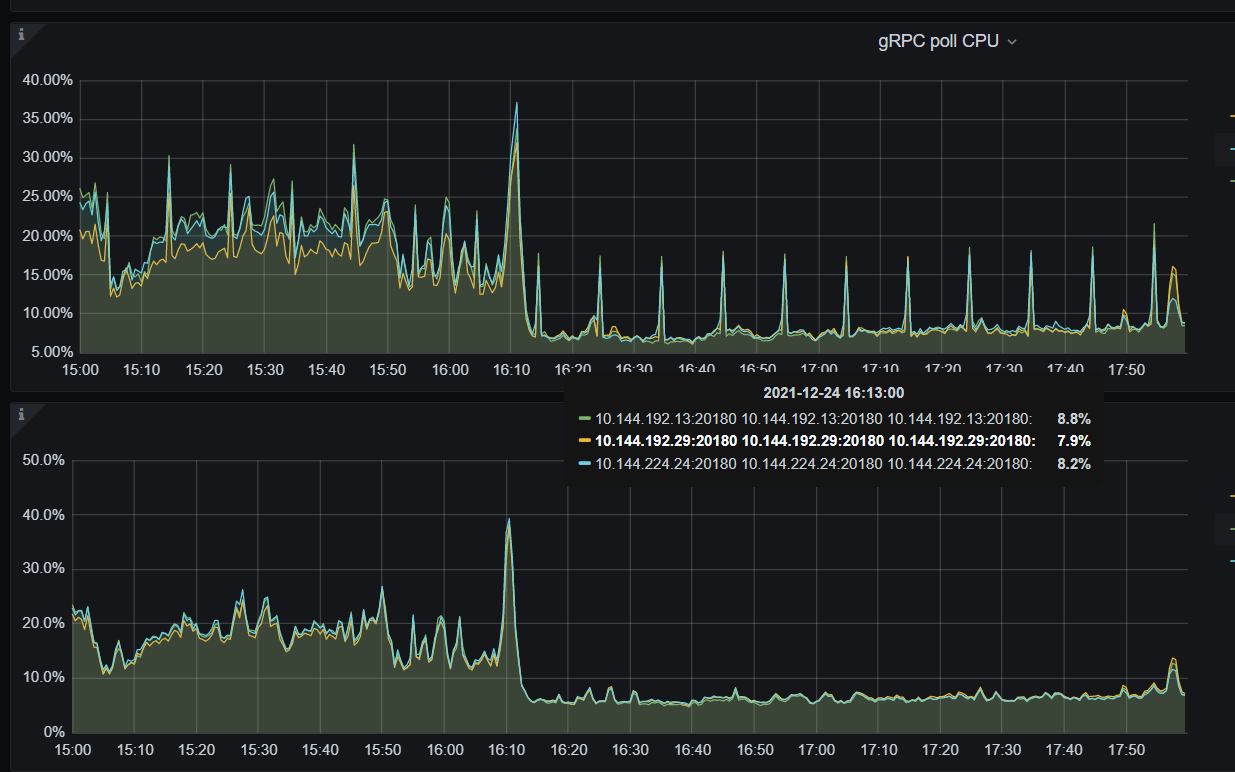
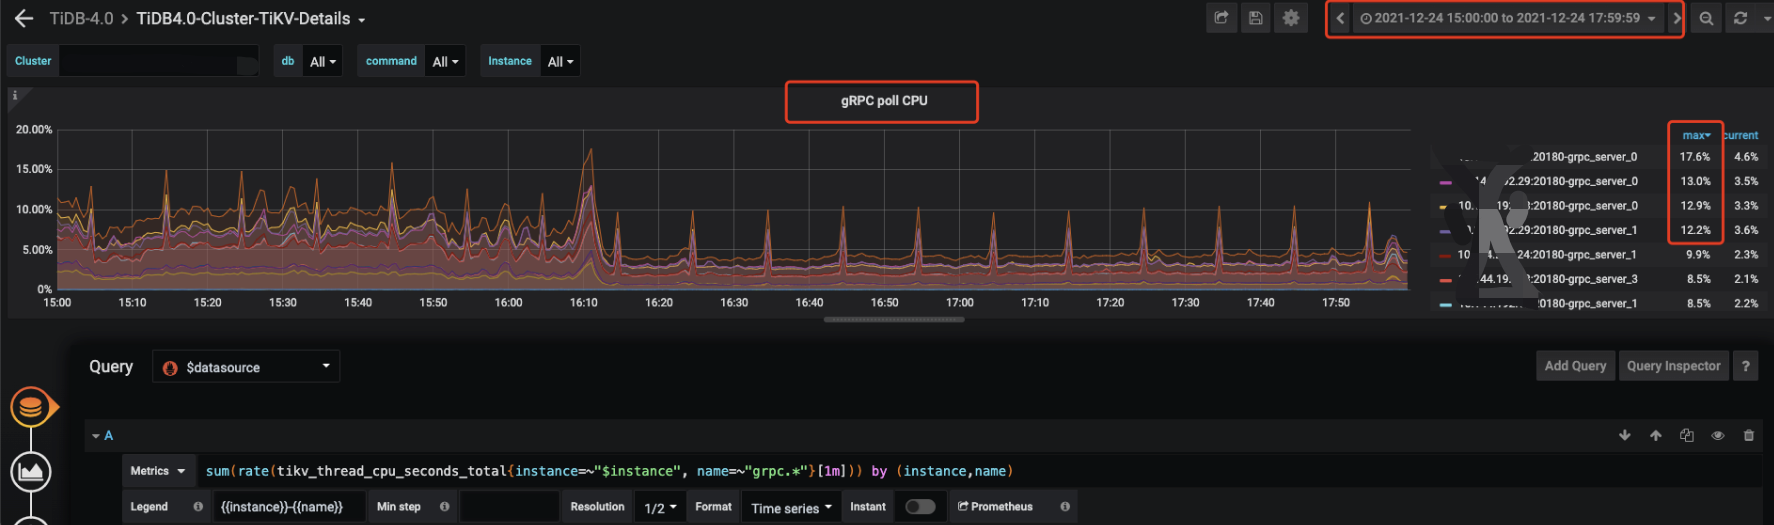
问题期间服务器无压力,cpu load在2.39%左右、io使用率在10%以内,内存256G
tikv节点无pending,恢复正常前无analyze table,表健康度91。

【背景】 做过哪些操作
无任何操作

【现象】 业务和数据库现象
问题期间该条sql慢查较多

【问题】 当前遇到的问题
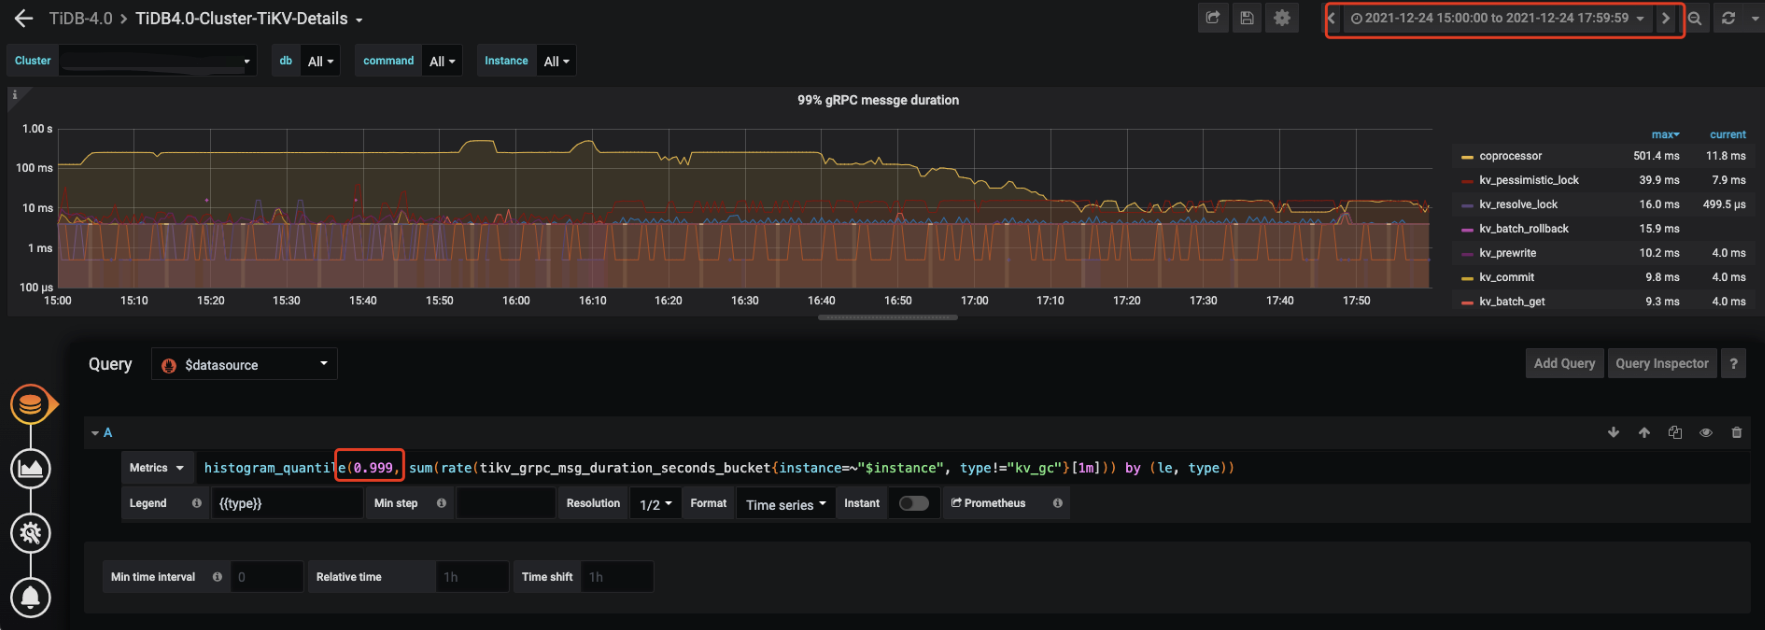
相同的执行计划,问题期间limit算子中的rpc_time比正常时间高200ms左右

【TiDB 版本】
v4.0.10

【附件】 相关日志及配置信息
sql如下:

SELECT id, videocid, videoaid, cmtid, userid, state, dmctime, utime, last_push_time, last_push_state, current_push_status, last_hit_strategy, validate, mtime, ctime FROM table_xx force index(ix_current_push_status_utime) WHERE (current_push_status = 0 AND utime <= 1640335762) AND utime >= 1640332252 LIMIT 2000;

表结构如下:

 CREATE TABLE `table_xx` (
  `id` bigint(20) unsigned NOT NULL AUTO_INCREMENT,
  `videocid` bigint(20) unsigned NOT NULL DEFAULT '0'',
  `cmtid` bigint(20) unsigned NOT NULL DEFAULT '0' ,
  `userid` bigint(20) unsigned NOT NULL DEFAULT '0' ,
  `state` int(11) NOT NULL DEFAULT '0',
  `dmctime` int(11) NOT NULL DEFAULT '0',
  `utime` int(11) NOT NULL DEFAULT '0',
  `last_push_time` int(11) NOT NULL DEFAULT '0' ,
  `last_push_state` int(11) NOT NULL DEFAULT '0',
  `current_push_status` tinyint(4) NOT NULL DEFAULT '0' ,
  `last_hit_strategy` varchar(20) NOT NULL DEFAULT '' ,
  `validate` int(11) NOT NULL DEFAULT '0',
  `mtime` datetime NOT NULL DEFAULT CURRENT_TIMESTAMP ON UPDATE CURRENT_TIMESTAMP ,
  `ctime` datetime NOT NULL DEFAULT CURRENT_TIMESTAMP,
  `videoaid` bigint(20) unsigned NOT NULL DEFAULT '0' ,
  PRIMARY KEY (`id`),
  UNIQUE KEY `ix_cmtid` (`cmtid`),
  KEY `ix_current_push_status_last_push_time` (`current_push_status`,`last_push_time`),
  KEY `ix_dmctime` (`dmctime`),
  KEY `ix_ctime` (`ctime`),
  KEY `ix_mtime` (`mtime`),
  KEY `ix_utime` (`utime`),
  KEY `ix_aid` (`videoaid`),
  KEY `ix_current_push_status_utime` (`current_push_status`,`utime`)
) ENGINE=InnoDB DEFAULT CHARSET=utf8mb4 COLLATE=utf8mb4_bin AUTO_INCREMENT=730415744 

正常期间执行计划:

+----------------------------------+---------+---------+-----------+-----------------------------------------------------------------------------+-----------------------------------------------------------------------------------------------------------------------------------------------------------------------+------------------------------------------------------------------------------------------------------------------------------------------------------------------------------------------------------------------------------------------------------------------------------------------------------------------------------------------------------------------------------------------------------------------------------------------------------------------------------------------+--------------+------+
| id                               | estRows | actRows | task      | access object                                                               | execution info                                                                                                                                                        | operator info                                                                                                                                                                                                                                                                                                                                                                                                                                                                            | memory       | disk |
+----------------------------------+---------+---------+-----------+-----------------------------------------------------------------------------+-----------------------------------------------------------------------------------------------------------------------------------------------------------------------+------------------------------------------------------------------------------------------------------------------------------------------------------------------------------------------------------------------------------------------------------------------------------------------------------------------------------------------------------------------------------------------------------------------------------------------------------------------------------------------+--------------+------+
| Projection_7                     | 77.71   | 0       | root      |                                                                             | time:38.881407ms, loops:1, Concurrency:OFF                                                                                                                            | DBxx.tablexx.id, DBxx.tablexx.videocid, DBxx.tablexx.videoaid, DBxx.tablexx.cmtid, DBxx.tablexx.userid, DBxx.tablexx.state, DBxx.tablexx.dmctime, DBxx.tablexx.utime, DBxx.tablexx.last_push_time, DBxx.tablexx.last_push_state, DBxx.tablexx.current_push_status, DBxx.tablexx.last_hit_strategy, DBxx.tablexx.validate, DBxx.tablexx.mtime, DBxx.tablexx.ctime | 5.5703125 KB | N/A  |
| └─IndexLookUp_14                 | 77.71   | 0       | root      |                                                                             | time:38.878846ms, loops:1,  table_task:{num:0, concurrency:4, time:155.34822ms}                                                                                       | limit embedded(offset:0, count:2000)                                                                                                                                                                                                                                                                                                                                                                                                                                                     | 235 Bytes    | N/A  |
|   ├─Limit_13(Build)              | 77.71   | 0       | cop[tikv] |                                                                             | time:0s, loops:0, cop_task: {num: 1, max:38.73929ms, proc_keys: 50678, rpc_num: 1, rpc_time: 38.723702ms, copr_cache_hit_ratio: 0.00}, tikv_task:{time:36ms, loops:1} | offset:0, count:2000                                                                                                                                                                                                                                                                                                                                                                                                                                                                     | N/A          | N/A  |
|   │ └─IndexRangeScan_11          | 77.71   | 0       | cop[tikv] | table:tablexx, index:ix_current_push_status_utime(current_push_status, utime) | time:0ns, loops:0, tikv_task:{time:36ms, loops:1}                                                                                                                     | range:[0 1640332252,0 1640335762], keep order:false                                                                                                                                                                                                                                                                                                                                                                                                                                      | N/A          | N/A  |
|   └─TableRowIDScan_12(Probe)     | 77.71   | 0       | cop[tikv] | table:tablexx                                                                 | time:0ns, loops:0                                                                                                                                                     | keep order:false, stats:pseudo                                                                                                                                                                                                                                                                                                                                                                                                                                                           | N/A          | N/A  |
+----------------------------------+---------+---------+-----------+-----------------------------------------------------------------------------+-----------------------------------------------------------------------------------------------------------------------------------------------------------------------+------------------------------------------------------------------------------------------------------------------------------------------------------------------------------------------------------------------------------------------------------------------------------------------------------------------------------------------------------------------------------------------------------------------------------------------------------------------------------------------+--------------+------+
5 rows in set (0.04 sec)

问题期间执行计划:

|| |id                |task     |estRows          |operator info                                                                                                                                                                                                                                                                                                                                                                                                                                                                           |actRows|execution info                                                                                                                                                          |memory      |disk|
|---|---|---|---|---|---|---|---|---|
||Projection_7      |root     |77.62712324719992|DBxx.tablexx.id, DBxx.tablexx.videocid, DBxx.tablexx.videoaid, DBxx.tablexx.cmtid, DBxx.tablexx.userid, DBxx.tablexx.state, DBxx.tablexx.dmctime, DBxx.tablexx.utime, DBxx.tablexx.last_push_time, DBxx.tablexx.last_push_state, DBxx.tablexx.current_push_status, DBxx.tablexx.last_hit_strategy, DBxx.tablexx.validate, DBxx.tablexx.mtime, DBxx.tablexx.ctime|0      |time:182.72606ms, loops:1, Concurrency:OFF                                                                                                                              |5.5703125 KB|N/A|
||└─IndexLookUp_14  |root     |77.62712324719992|limit embedded(offset:0, count:2000)                                                                                                                                                                                                                                                                                                                                                                                                                                                    |0      |time:182.723766ms, loops:1,  table_task:{num:0, concurrency:4, time:730.762083ms}                                                                                       |235 Bytes   |N/A|
||  ├─Limit_13      |cop[tikv]|77.62712324719992|offset:0, count:2000                                                                                                                                                                                                                                                                                                                                                                                                                                                                    |0      |time:0s, loops:0, cop_task: {num: 1, max:182.618097ms, proc_keys: 50678, rpc_num: 1, rpc_time: 182.606906ms, copr_cache_hit_ratio: 0.00}, tikv_task:{time:64ms, loops:1}|N/A         |N/A|
||  │ └─IndexScan_11|cop[tikv]|77.62712324719992|table:tablexx, index:ix_current_push_status_utime(current_push_status, utime), range:[0 1640332252,0 1640335762], keep order:false                                                                                                                                                                                                                                                                                                                                                        |0      |time:0ns, loops:0, tikv_task:{time:64ms, loops:1}                                                                                                                       |N/A         |N/A|
||  └─TableScan_12  |cop[tikv]|77.62712324719992|table:tablexx, keep order:false, stats:pseudo                                                                                                                                                                                                                                                                                                                                                                                                                                             |0      |time:0ns, loops:0                                                                                                                                                       |N/A         |N/A ||

两个执行计划不同的地方:
有问题:cop_task: {num: 1, max:182.618097ms, proc_keys: 50678, rpc_num: 1, rpc_time: 182.606906ms, copr_cache_hit_ratio: 0.00}, tikv_task:{time:64ms, loops:1}

正常:cop_task: {num: 1, max:38.73929ms, proc_keys: 50678, rpc_num: 1, rpc_time: 38.723702ms, copr_cache_hit_ratio: 0.00}, tikv_task:{time:36ms, loops:1}


若提问为性能优化、故障排查类问题,请下载脚本运行。终端输出的打印结果,请务必全选并复制粘贴上传。

1 个赞
  • rpc_num , rpc_time :向 TiKV 发送 Cop 类型的 RPC 请求总数量和总时间。

可以在grafana上看看grpc的cpu负载情况,另外要看看tikv所在主机的负载情况。

我这边一般出现stats:pseudo,就代表需要重新收集统计信息

operator info 结果

EXPLAIN 返回结果中 operator info 列可显示诸如条件下推等信息。本文以上示例中, operator info 结果各字段解释如下:

  • range: [1,1] 表示查询的 WHERE 字句 ( a = 1 ) 被下推到了 TiKV,对应的 task 为 cop[tikv]
  • keep order:false 表示该查询的语义不需要 TiKV 按顺序返回结果。如果查询指定了排序(例如 SELECT * FROM t WHERE a = 1 ORDER BY id ),该字段的返回结果为 keep order:true
  • stats:pseudo 表示 estRows 显示的预估数可能不准确。TiDB 定期在后台更新统计信息。也可以通过执行 ANALYZE TABLE t 来手动更新统计信息。

grpc poll cpu这个值么?问题期间不到10%,大概在6-7%之间
集群的拓扑是3tikv、3tidb、3pd,部署在3台物理机(64C256G)上,问题期间cpu、io、内存使用率如下:
服务器1:单核load avg0.04、磁盘io使用率3%以内(iops 2k左右无明显波动、bandwidth write 13.7MBs左右,问题期间有1min30s波动到34.31MBs,read 几十kBs)、内存:use117G、available134G、network inbound 12-16Mbps、outbound15Mbps以内
服务器2:单核load avg0.04、磁盘io使用率7%以内(iops 2k左右无明显波动、bandwidth write 40MBs左右,read 几十kBs-13MBs)、内存:use115G、available136G、network inbound 10Mbps以内、outbound15Mbps以内
服务器3:单核load avg0.05、磁盘io使用率3%以内(iops 2k左右无明显波动、bandwidth write 20MBs以内,read 几MBs)、内存:use113G、available137G、network inbound 10Mbps以内、outbound15Mbps以内

看下问题期间tikv的系统负载情况

服务器级别的一些监控信息上面发了,大佬看看还需要哪些内容

整体 grpc poll cpu 可能看不出来问题,需要看下 gRPC CPU Per Thread ,是不是里面单个线程打满了;
或者在 tikv-details → grpc 监控面板中,可以把 duration 调成 999 线,看看 grpc message duration 正常时间点和问题时间点的差异。

tikv-details -> grpc 下有6个面板
1.gRPC message count——问题期间并无高峰
2.gRPC message failed 无数据
3.99% gRPC message duration——coprocessor问题期间250ms左右(问题时间之前也是这个耗时),其余项无明显波动
4.Average gRPC message duration——coprocessor略有上升(5ms上升25ms左右,16:36左右该sql恢复正常,这个耗时17:10才恢复5ms左右)
5.gRPC batch size——无明显波动
6.raft message batch size——avg无明显波动,99%问题期间略有下降(7下降到5)

Thread CPU下无gRPC CPU Per Thread面板,关于gRPC的只有gRPC poll CPU

问题期间前后,该表的统计信息都没有更新过,而且表统计信息健康度在90以上,前后的执行计划来看是一致的,感觉跟统计信息没太大关系

https://docs.pingcap.com/zh/tidb/v5.2/exporting-grafana-snapshots/#将-grafana-监控数据导出成快照

不一定导的出监控数据,之前试过
我导出一波看看

1.可以把监控 「99% gRPC message duration」调整 999 线看下,调整下监控表达式:


2.grpc poll cpu 也可以调整下监控指标的表达式,添加下 by name

3.可以按照楼上的建议导出下监控数据瞅瞅~

全量的监控导不出,我就导了gRPC以及Thread CPU面板的相关数据
TiDB4.0-Cluster-TiKV-Details_2021-12-27T08_49_21.912Z.json (2.1 MB)

问题时间段是什么时候开始的?平时unifired read pool也是这么不均衡吗? 16:10分前有比较多的读写操作。


15:11-16:10,16:22-16:36左右,这两个时间点
平时unifired read pool CPU波动也是比较高的,下图是last 24 hours

如果方便的话,可以把监控项 「99% gRPC message duration」和 「grpc poll cpu 」表达式调整后的结果反馈下 ,看下是不是存在单线程的瓶颈。

1.[99% gRPC message duration]调整 999 线后面板如下


2.[grpc poll cpu]调整下控指标的表达式,添加by name 后面板如下

从 tikv cop 监控中看到,慢的主要是 index scan 相关请求(table scan 请求耗时最长 ~30ms),从 index scan 请求相关的 rocksdb 操作看到读 write cf 时遇到 tombstone 比较多:


猜测是写入量太少无法触发 compaction 所以 tombstone 数据无法及时清理导致的,可以试试使用 tikv-ctl 手动 compact write cf

:ok_hand:

此话题已在最后回复的 1 分钟后被自动关闭。不再允许新回复。