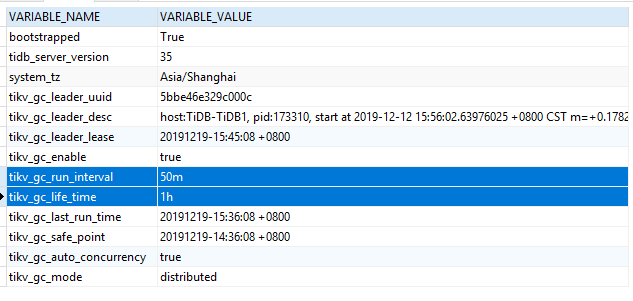
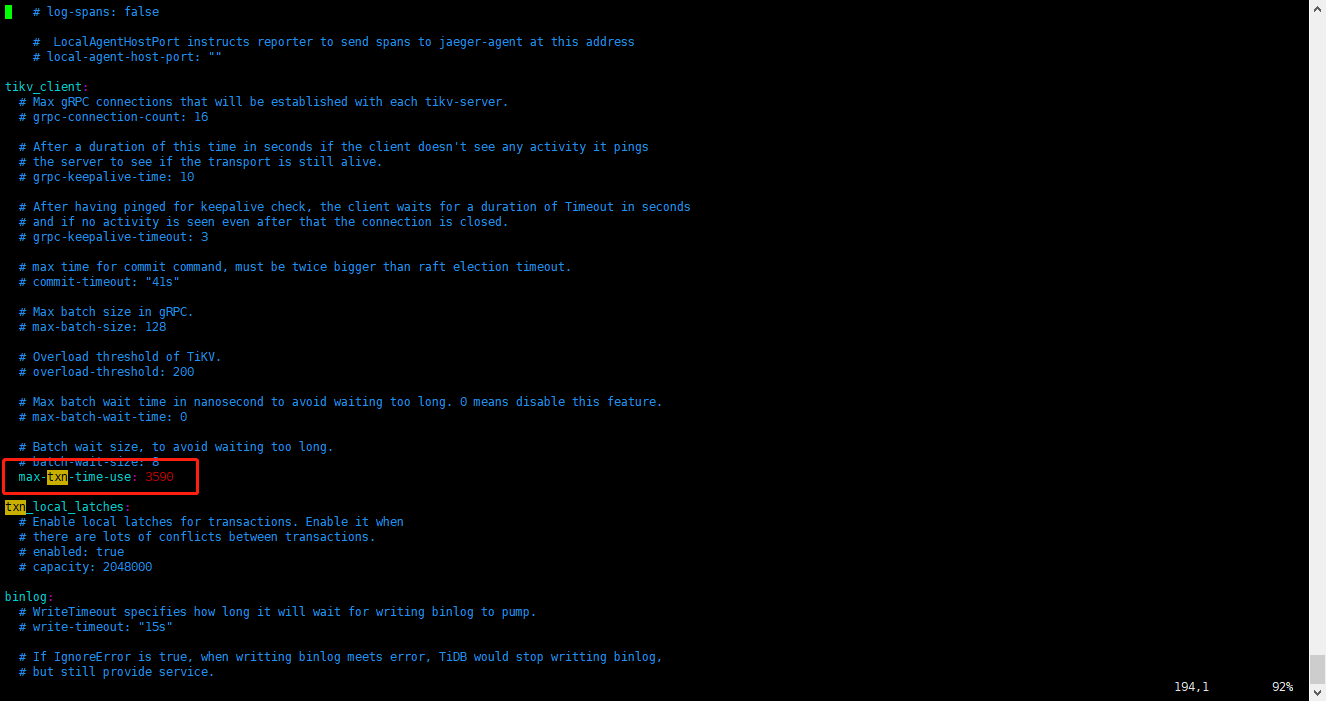
应该已经拿到3590这个参数了。但是还是不行。
[2019/12/19 15:28:23.119 +08:00] [INFO] [printer.go:54] [“loaded config”] [config="{“host”:“0.0.0.0”,“advertise-address”:“172.18.25.83”,“port”:4000,“cors”:"",“store”:“tikv”,“path”:“172.18.25.83:2379”,“socket”:"",“lease”:“45s”,“run-ddl”:true,“split-table”:true,“token-limit”:1000,“oom-action”:“log”,“mem-quota-query”:34359738368,“enable-streaming”:false,“txn-local-latches”:{“enabled”:true,“capacity”:2048000},“lower-case-table-names”:2,“log”:{“level”:“info”,“format”:“text”,“disable-timestamp”:false,“file”:{“filename”:"/data1/log/tidb.log",“log-rotate”:true,“max-size”:300,“max-days”:0,“max-backups”:0},“slow-query-file”:"/data1/log/tidb_slow_query.log",“slow-threshold”:300,“expensive-threshold”:10000,“query-log-max-len”:2048},“security”:{“skip-grant-table”:false,“ssl-ca”:"",“ssl-cert”:"",“ssl-key”:"",“cluster-ssl-ca”:"",“cluster-ssl-cert”:"",“cluster-ssl-key”:""},“status”:{“report-status”:true,“status-host”:“0.0.0.0”,“status-port”:10080,“metrics-addr”:"",“metrics-interval”:15,“record-db-qps”:false},“performance”:{“max-procs”:0,“max-memory”:0,“tcp-keep-alive”:true,“cross-join”:true,“stats-lease”:“3s”,“run-auto-analyze”:true,“stmt-count-limit”:5000,“feedback-probability”:0.05,“query-feedback-limit”:1024,“pseudo-estimate-ratio”:0.8,“force-priority”:“NO_PRIORITY”,“bind-info-lease”:“3s”},“prepared-plan-cache”:{“enabled”:false,“capacity”:100,“memory-guard-ratio”:0.1},“opentracing”:{“enable”:false,“sampler”:{“type”:“const”,“param”:1,“sampling-server-url”:"",“max-operations”:0,“sampling-refresh-interval”:0},“reporter”:{“queue-size”:0,“buffer-flush-interval”:0,“log-spans”:false,“local-agent-host-port”:""},“rpc-metrics”:false},“proxy-protocol”:{“networks”:"",“header-timeout”:5},“tikv-client”:{“grpc-connection-count”:16,“grpc-keepalive-time”:10,“grpc-keepalive-timeout”:3,“commit-timeout”:“41s”,“max-txn-time-use”:3590,“max-batch-size”:128,“overload-threshold”:200,“max-batch-wait-time”:0,“batch-wait-size”:8},“binlog”:{“enable”:true,“write-timeout”:“15s”,“ignore-error”:false,“binlog-socket”:"",“strategy”:“range”},“compatible-kill-query”:false,“plugin”:{“dir”:"",“load”:""},“pessimistic-txn”:{“enable”:false,“default”:false,“max-retry-count”:256,“ttl”:“30s”},“check-mb4-value-in-utf8”:true,“treat-old-version-utf8-as-utf8mb4”:true}"]