【 TiDB 使用环境】
大量表做了tiflash,主要进行数据统计和报表
【现象】 业务和数据库现象
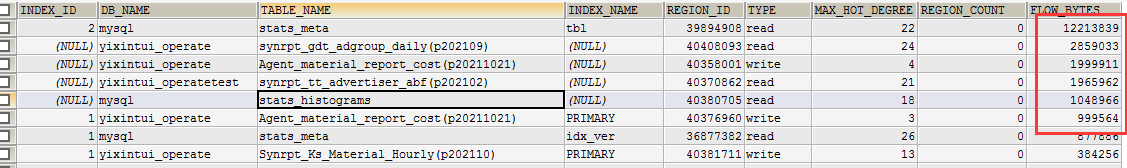
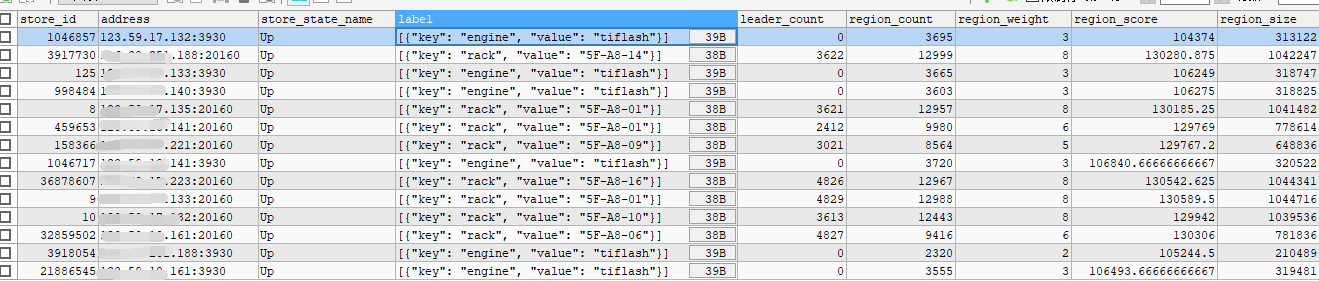
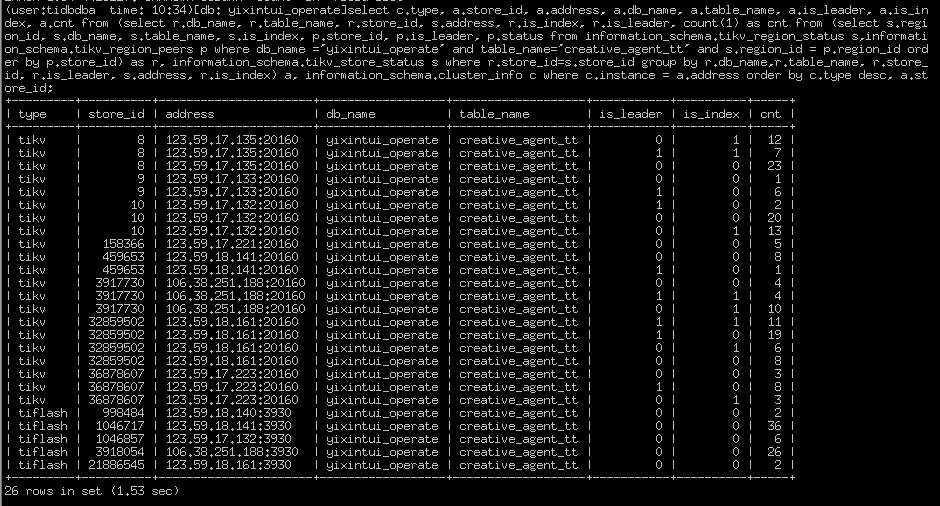
【问题】 同样的region weight,固定的节点cpu使用率高,怀疑有region 热点, 如何排查
【 TiDB 版本】 v5.1.2
【附件】 相关日志及监控(https://metricstool.pingcap.com/)

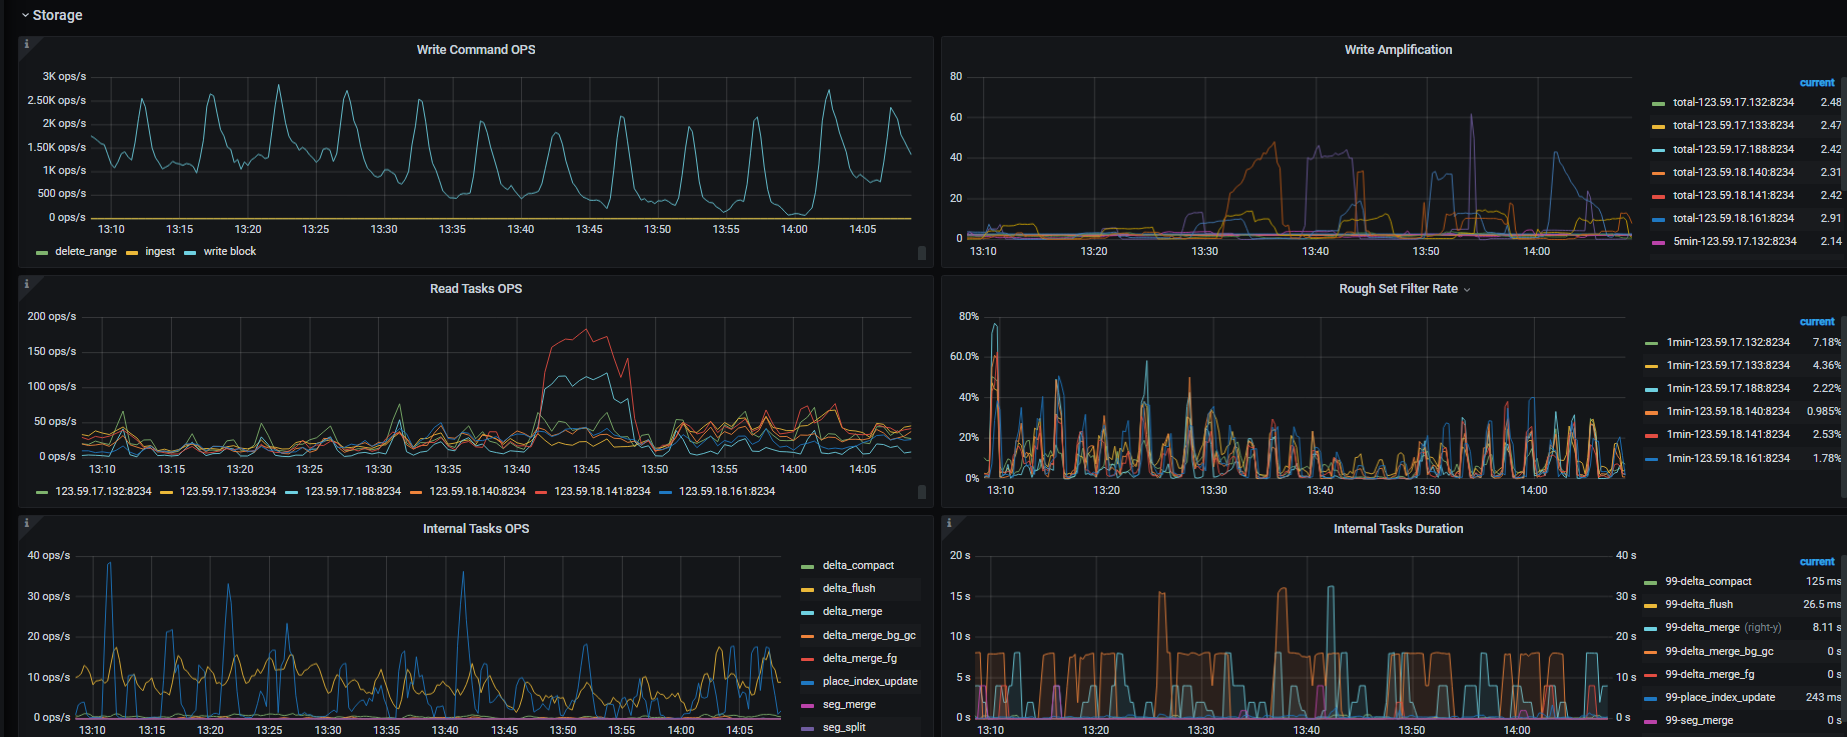
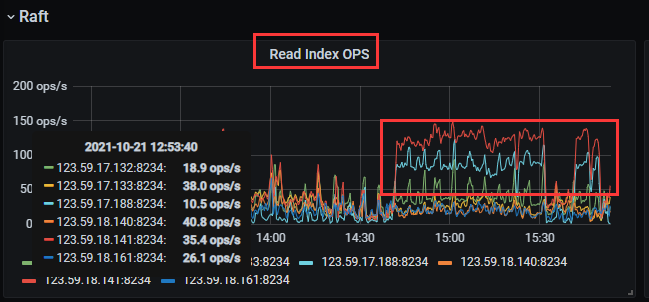
压力固定在188 和141 节点,其他tiflash 没有压力
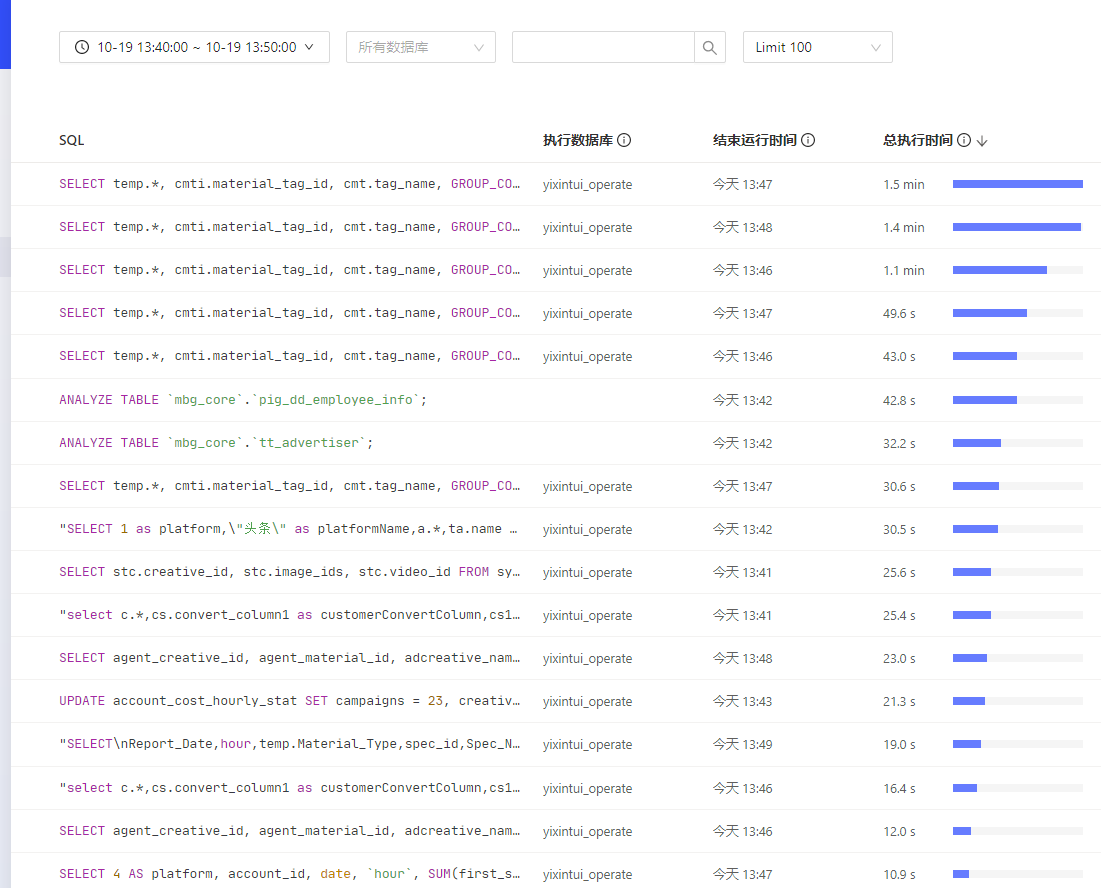
这段时间 慢查询,
【 TiDB 使用环境】
大量表做了tiflash,主要进行数据统计和报表
【现象】 业务和数据库现象
【问题】 同样的region weight,固定的节点cpu使用率高,怀疑有region 热点, 如何排查
【 TiDB 版本】 v5.1.2
【附件】 相关日志及监控(https://metricstool.pingcap.com/)
这段时间 慢查询,
你慢SQL的这个截图选择的时间不是监控图中异常对应的时间片,你再看看那个时间的慢SQL
怀疑是有热点region, 该怎么排查。 或者说 如何让tiflash region分布更均衡。所有tiflash节点配置一样,region weight 也一样
可以参考这个帖子先排查下是哪个表导致的,同时抓一下 tiflash 的 profile 信息,多谢。
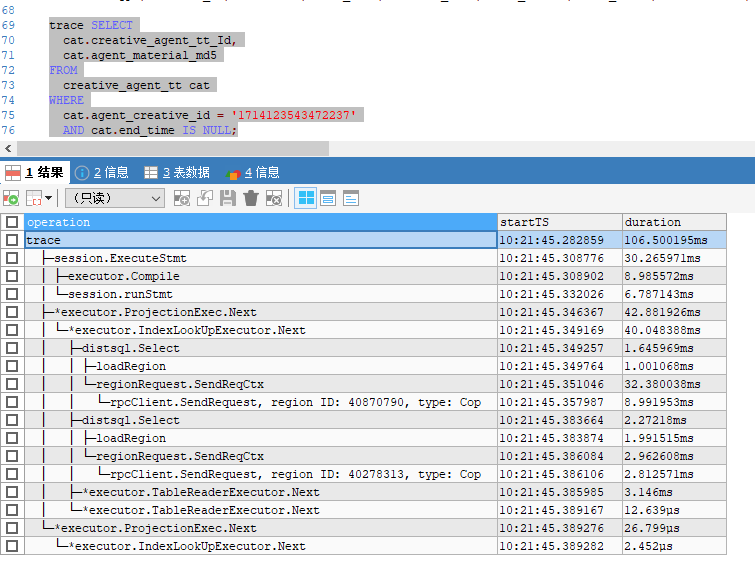
profile 信息

SQL还在查
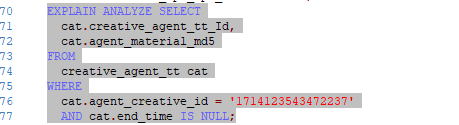
SELECT
cat.creative_agent_tt_Id,
cat.agent_material_md5
FROM
creative_agent_tt cat
WHERE
cat.agent_creative_id = ‘171413xxx9480’
AND cat.end_time IS NULL;
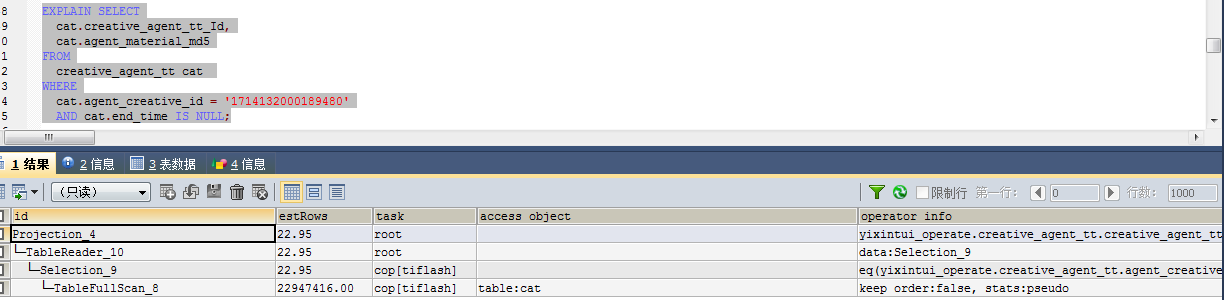
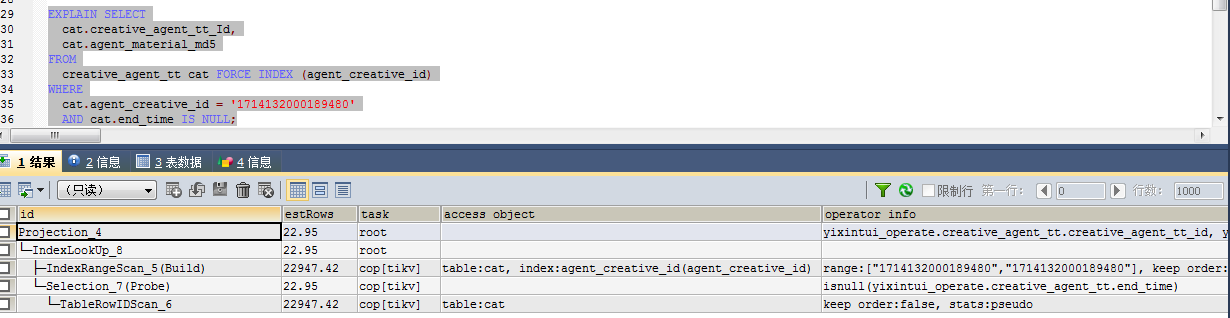
这个sql 有索引 但是执行计划走的tiflash
我让他们试试 强制索引 ,咱们这个执行计划选择的时候 没有使用CBO原则吗?
EXPLAIN SELECT
cat.creative_agent_tt_Id,
cat.agent_material_md5
FROM
creative_agent_tt cat FORCE INDEX (agent_creative_id)
WHERE
cat.agent_creative_id = ‘171413xxx9480’
AND cat.end_time IS NULL;
麻烦提供下下面的信息:
集群信息tiup cluster display
异常时段Grafana TiFlash-Summary仪表盘中的TiFlash指标
所有的TiFlash日志,包括tiflash.log / tiflash_tikv.log
麻烦提供这个SQL的执行计划explain analyze
请用户提供一下如下信息:
请问,你的问题跟楼主的问题不是同一个问题吧?如果不是请开新帖,谢谢。
是这个SQL 定时批量执行 导致的tiflash cpu高
是执行:explain analyze 慢SQL,你之前使用 explain,而不是explain analyze
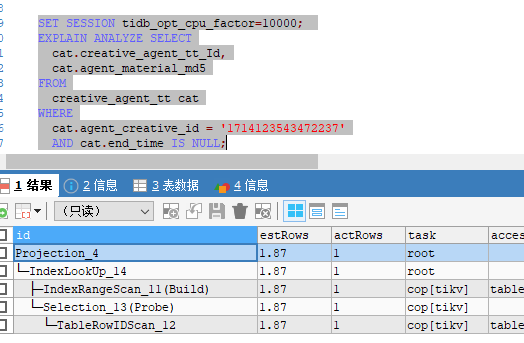
可能跟参数 tidb_opt_cpu_factor=10000有关系
set session tidb_opt_cpu_factor=10; 就会优选 索引了
tidb 选5.1.1 就走索引, 选5.1.2 就走全表
| id | estRows | actRows | task | access object | execution info | operator info | memory | disk |
|---|---|---|---|---|---|---|---|---|
| Projection_4 | 23.26 | 1 | root | time:954.8ms, loops:2, Concurrency:OFF | yixintui_operate.creative_agent_tt.creative_agent_tt_id, yixintui_operate.creative_agent_tt.agent_material_md5 | 2.20 KB | N/A | |
| └─TableReader_10 | 23.26 | 1 | root | time:954.8ms, loops:2, cop_task: {num: 36, max: 625ms, min: 83.1ms, avg: 314.1ms, p95: 604.3ms, rpc_num: 36, rpc_time: 11.3s, copr_cache_hit_ratio: 0.00} | data:Selection_9 | 408 Bytes | N/A | |
| └─Selection_9 | 23.26 | 1 | cop[tiflash] | tiflash_task:{proc max:623ms, min:82.5ms, p80:427.1ms, p95:599.3ms, iters:1, tasks:36, threads:36} | eq(yixintui_operate.creative_agent_tt.agent_creative_id, “1714123543472237”), isnull(yixintui_operate.creative_agent_tt.end_time) | N/A | N/A | |
| └─TableFullScan_8 | 23261061.00 | 23427983 | cop[tiflash] | table:cat | tiflash_task:{proc max:609ms, min:70.5ms, p80:416.1ms, p95:577.3ms, iters:431, tasks:36, threads:36} | keep order:false, stats:pseudo | N/A | N/A |
tidb 5.1.1
v5.3.0 的tidb 也是 按tiflash 走 。
5.3 set tidb_opt_cpu_factor=10; 也会走tikv 索引 。
tiflash的负载和副本数有关系吗,因为我默认设置的是2个副本,所以只有2个tiflash提供服务